INVESTIGATION
Bayesian Population Genomic Inference of Crossing
Over and Gene Conversion
Badri Padhukasahasram1and Bruce Rannala
Genome Center and Department of Evolution and Ecology, University of California, Davis, California 95616
ABSTRACTMeiotic recombination is a fundamental cellular mechanism in sexually reproducing organisms and its different forms, crossing over and gene conversion both play an important role in shaping genetic variation in populations. Here, we describe a coalescent-based full-likelihood Markov chain Monte Carlo (MCMC) method for jointly estimating the crossing-over, gene-conversion, and mean tract length parameters from population genomic data under a Bayesian framework. Although computationally more expensive than methods that use approximate likelihoods, the relative efficiency of our method is expected to be optimal in theory. Furthermore, it is also possible to obtain a posterior sample of genealogies for the data using this method. We first check the performance of the new method on simulated data and verify its correctness. We also extend the method for inference under models with variable gene-conversion and crossing-over rates and demonstrate its ability to identify recombination hotspots. Then, we apply the method to two empirical data sets that were sequenced in the telomeric regions of the X chromosome ofDrosophila melanogaster. Our results indicate that gene conversion occurs more frequently than crossing over in thesu-wandsu-sgene sequences while the local rates of crossing over as inferred by our program are not low. The mean tract lengths for gene-conversion events are estimated to be70 bp and 430 bp, respectively, for these data sets. Finally, we discuss ideas and optimizations for reducing the execution time of our algorithm.
C
ROSSING over and gene conversion refer to two differ-ent mechanisms of recombination by which homologous chromosomes exchange genetic material during meiosis. In many eukaryotes, recombination is an essential requirement for sexual reproduction because it maintains physical con-nections between homologous chromosomes and contrib-utes to proper segregation at the end of the first meiotic division. As currently understood, recombination starts with the formation of a double-stranded break in the DNA and proceeds by a series of biochemical steps leading to its repair (e.g., see Szostaket al.1983; Stahl 1994). This repair can result in either the reciprocal exchange of large chromo-somal regions (called crossing over) or the exchange of short DNA tracts (called gene conversion). The stretch of DNA exchanged during a gene-conversion event is called a conversion tract. A crossing-over event involves a singlebreakpoint in the chromosome and regions beyond this breakpoint are swapped between homologs to create mosaic products. In contrast, a gene conversion creates a mosaic in which a short internal fragment comes from one homolog while the rest of the chromosome flanking this fragment comes from the other. The products are similar in length to the participating homologs.
Crossing over is the better studied mechanism of re-combination and crossing-over rates are known to vary tremendously across the genome at all scales. In particular, sperm-typing experiments as well as population genetic analysis of human polymorphism data have provided considerable evidence for fine-scale rate variation along the genome (e.g., see Fullertonet al. 1994; Dunhamet al. 1999; Jeffreyset al.2001, 2005; Innanet al.2003; Crawford et al.2004; McVeanet al.2004; International Hapmap Con-sortium 2005; Myers et al. 2005; Fearnhead and Smith 2005; Tiemann Boege et al.2006; Coopet al.2008). Nota-bly, the population genetic studies ignored the effects of gene conversion and assumed that crossing over was the only mechanism underlying all exchanges. In general, gene conversion has been harder to study due to lack of appro-priatefine-scale data and powerful statistical tools. Sperm-typing studies at a few individual human loci have provided Copyright © 2011 by the Genetics Society of America
doi: 10.1534/genetics.111.130195
Manuscript received April 30, 2011; accepted for publication July 18, 2011 Available freely online through the author-supported open access option. Supporting information is available online at http://www.genetics.org/content/ suppl/2011/08/12/genetics.111.130195.DC1.
1Corresponding author: Genome Center, 4341 GBSF, 451 Health Sciences Drive, University of California, Davis, CA 95616. E-mail: [email protected]
evidence of high rates of gene conversion relative to crossing over (Zangenberg et al.1995; Jeffreys and May 2004) and observed tract lengths that appear to be in the range of 50– 150 bp. Gene conversion has also been studied experimen-tally in yeast and fruitflies (Fogelet al.1983; Hillikeret al. 1991, 1994; Paques and Haber 1999; Allers and Lichten 2001; Mancera et al.2008) and tracts are estimated to be in the range of 350–2000 bp in these organisms. Neverthe-less, the nature and extent of variation in gene-conversion rates along genomes remains by and large unknown.
Characterizing the basic parameters of gene conversion (i.e., rates and tract lengths) within organisms is useful for a variety of reasons. First, it helps to better explain the patterns of linkage disequilibrium observed in single-nucleotide polymorphism (SNP) data (Wall and Pritchard 2003; Padhukasahasramet al.2004). Second, algorithms for association mapping (e.g., Liuet al.2001; Morriset al. 2002; Niu et al.2002; Carlsonet al.2004) and for detecting natural selection (e.g., Voightet al.2006) make assumptions about the local recombination parameters and conversion esti-mates may helpfine-tune such methods. Finally, meiotic gene conversion is a fundamental biological mechanism and its re-lationship to crossing over is not yet fully understood and is an important open question. The emergence of dense SNP data sets from next generation sequencing technologies in the com-ing years presents a major opportunity to accurately quantify recombination rates from a population genetics standpoint. Thus, population genetic analysis of gene-conversion and crossing-over rates can eventually shed light on the rela-tionship between these two processes and can supplement experimental approaches in answering this question (see previous studies Langley et al. 2000; Allers and Lichten 2001; Andolfatto and Wall 2003; Padhukasahasram et al. 2006; Manceraet al.2008).
Currently, several statistical methods exist that are designed to jointly estimate the crossing-over and gene-conversion rates from population genetic data. Methods developed by Frisse et al.(2001), Ptaket al.(2004), and Wall (2004) generalize the composite-likelihood approach first proposed in Hudson (2001). These approaches divide the data into small subsets (pairs or triplets of segregating sites), calculate likelihoods for these subsets, and multiply them together. The likelihood thus obtained is called the composite likelihood. Composite-likelihood methods use precomputed Composite-likelihood lookup tables for all the possible configurations of the subsets and are typi-cally fast. Because the subsets are not independent of one another, they do not calculate the true likelihood of the data. Therefore, correct confidence intervals can be obtained only by using simulations.
Padhukasahasram et al. (2006) describe a rejection-sampling method that simultaneously utilizes informative long-range and short-range summary statistics to infer the recombination parameters. This approach uses only part of the information available in the data for the sake of compu-tational efficiency. Confidence intervals may be directly cal-culated from the likelihood surface in this method.
The approximate-likelihood method for estimating crossing-over rates [called product of approximate conditionals (PAC)] that was proposed in Li and Stephens (2003) has also been extended by several recent studies to include gene conversion. Briefly, this method infers recombination parameters under a heuristic model and is computationally efficient. However, inference is currently restricted to the constant population size Wright–Fisher model only. Hellenthal (2006) used a PAC model where the conversion tract can include at most one marker. Gay et al.(2007) improved on that work to allow for arbitrary gene-conversion tract lengths and this method can be used for coestimating crossing-over and gene-conversion rates as well as tract lengths. One simplification in their model was that they disallowed overlapping gene-conversion events. Yin et al.(2009) further generalized this work to allow for over-lapping events and in theory this method is expected to perform at least as well as the method of Gay et al. (2007). Simu-lations indicate that this generalization (at least for a subset of parameters) leads to a more accurate PAC-based method for jointly estimating all three recombination parameters.
In this article, we extend the Bayesian Markov chain Monte Carlo (MCMC) method (originally developed to infer crossing over exclusively) of Wang and Rannala (2008) to jointly estimate the population crossing-over rate, the pop-ulation gene-conversion rate, and the mean conversion tract length from SNP data. Wefirst check the performance of the new method on simulated data and verify its correctness. In addition, we extend the method for inference under models with variable gene-conversion and crossing-over rates and demonstrate its ability to identify recombination hotspots. Next, we apply the method to two empirical data sets that were sequenced in the telomeric regions of the X chromo-some of Drosophila melanogaster. Because the new method generates a posterior sample of genealogies consistent with the observed data, it is possible to obtain the distribution of gene-conversion breakpoints for a data set. Comparison of this distribution with a prior using a Bayes factor may be informative about the locations of conversion breakpoints in the history of the sample. We also calculate the Bayes factors for gene-conversion initiation points for these two Drosoph-ila data sets. Our analysis suggests that gene conversion occurs more frequently than crossing over in the su-w and su-sgene sequences while the local rates of crossing over as inferred by our program are not low. The estimated mean tract lengths for these regions are 70 bp and 430 bp, re-spectively. Furthermore, plots of the logarithm of Bayes fac-tors for conversion start points do not indicate any strong deviations from a prior distribution expected under a model with uniform recombination rates. Finally, we discuss ideas and optimizations for improving the run-time efficiency of our algorithm.
Materials and Methods
Our recombination inference method is based on the retrospective coalescent framework in which the genealogy
of a sample of sequences is approximated by a graph called the ancestral recombination graph (ARG) (Kingman 1982; Hudson 1983; Griffiths and Marjoram 1996). In particular, the method uses the coalescent with gene conversion as described in Wiuf and Hein (2000). In this model, conver-sion tract lengths are assumed to be geometrically distrib-uted (Hilliker et al. 1994). The distribution of tract length (Z) given that a gene-conversion event has occurred, i.e., P(Z = z|gene conversion), is thus equal to q(1 2 q)z–1,
whereqdenotes the reciprocal of the mean conversion tract length (m). Consider a sequence of lengthL +1 bp. A gene-conversion event can initiate between any two adjacent base pairs along the sequence. Without loss of generality, the model also assumes that a tract will always be to the right of the initiation position. Thus, if a conversion event initiates at gap S,S= 1, 2, 3, . . . ,L, then the end point is S + z. Gene-conversion events that initiate outside the sequence on the left and terminate within the sequence must also be in-cluded in our analysis. The probability that the tract length is greater than km, where mis the mean conversion tract length and k is a positive integer, becomes negligible as k grows. So, only afinite sequence (say 50m) on the left of the sequence of interest needs to be taken into account for the latter kind of events and the rest of the chromosome can be ignored.
Letrdenote the population crossing-over rate,gthe pop-ulation gene-conversion rate, anduthe population mutation parameter. LetXdenote a sample of haplotypes or genotypes andGSdenote a collection of correlated trees (i.e., an ARG) at the marker locations consistent withX. We are interested in sampling from the following posterior probability density:
fðr;g;mjXÞ ¼
Ð
fðXjGS;uÞfðGSjr;g;mÞfðrÞfðgÞfðmÞfðuÞdudGS
fðXÞ : (1)
The posterior distribution of recombination parameters can be numerically evaluated by using a reversible-jump MCMC (RJMCMC) scheme. In particular, a Metropolis– Hast-ings (MH) algorithm is used to estimate the parameters de-scribed in Equation 1. The MH algorithm has two steps: (i) the proposal step in which potential new parameter values are simulated from the proposal density Q(f9|f) and (ii) the acceptance step in which the proposed values are ac-cepted with probability aor rejected with probability 1 –
a. If accepted, f9 becomes the current state in the chain; otherwise the chain remains at fand f9is discarded. The acceptance probability for a parameter is given by
a¼min
1; lðf9jXÞQðfjf9Þfðf9Þ lðfjXÞQðf9jfÞfðfÞ
; (2)
where f denotes the prior density and ldenotes the likeli-hood. For each node in the ARG, we store an array of size equal to the number of markers and keep track of marker positions that are ancestral to the sample. We call this the ancestry vector [also the Marker Ancestry (MA) vector, see
Wang and Rannala 2008]. The distance between the start and the end of the ancestral locations in this vector is re-ferred to as the length of the ancestry vector. Our joint es-timation program begins with a binary tree that is consistent with the observed data and then proceeds according to the following proposal moves.
Adding (or removing) a pair of crossing-over and coalescence nodes
We generate two uniform random variablesuandvfrom the interval (0,tH), wheretHdenotes the height of the
geneal-ogy. The smaller of the two becomes the time for inserting a new crossing-over node and the larger is the time corre-sponding to the coalescence node. The remainder of this move is identical to the one in Wang and Rannala (2008) except that the probability of acceptance becomes
a¼min 1; lðXjG9S;uÞQðGSjG9SÞfðG9Sjr;g;mÞ lðXGS;uÞQðG9SGSÞfðGSr;g;mÞ
!
;
where the proposal ratio is
QðGSjG9SÞ
QðG9SGSÞ
¼t 2
Hn9br1n9br2ðl22l1Þ 2npair :
GSdenotes the current genealogy andG9Sdenotes the newly proposed genealogy. npairhere refers to the number of
pos-sible pairs of crossing-over and coalescence nodes that can be deleted from G9S. n9br1 and n9br2 refer to the number of
eligible branches at the times at which new crossing-over and coalescence nodes will be inserted where eligible branches must have ancestry vector length.1 when insert-ing crossinsert-ing-over nodes. l2 2 l1 refers to the distance
be-tween the start and the end of the ancestral segment in a branch.
The probability of adding a pair of nodes to move fromGS toGS9is given by
2=t2H·ð1=n9br1Þ·ð1=n9br2Þ·ð1=ðl22l1ÞÞ:
Thefirst term denotes the probability of proposing the ages of the two nodes, the second and third terms denote the probability that the two nodes are inserted into the particular eligible branches at their respective times, and the last term denotes the probability of proposing a re-combination breakpoint in the crossing-over node that is inserted. Note that when deleting a pair of crossing-over and coalescence nodes, we randomly choose a pair to delete. Thus, in the proposal ratio 1/npair denotes the probability
that the same pair of crossing-over and coalescent nodes that were added are chosen for deletion, to move back from G9S toGS.
Calculating the likelihood of data given a genealogy GS: l(X|GS, u) denotes the likelihood of observing a set of haplotypes/genotypes given an ARG and the population
mutation rate. Given the genealogical tree ti for a marker site i, and conditional on one or more mutations having occurred, the likelihood of a marker tree is given by
Pl2tiIðD i l¼D
i lAÞ½ð12e
20:5utlÞp Di
lþe
20:5utl þIðDi l6¼D
i lAÞ½ð12e
20:5utlÞp Di
l
12e20:5uTi ;
wherelindicates a branch intiwith lengthtl, connectingD i l and DilA, with DilA being the ancestral allele of Dil in that branch. The likelihood is calculated across all branches in
tiandIdenotes the indicator function. ParameterTi repre-sents the sum of the branch lengths in tiandpjis the fre-quency of allelejat stationarity.l(X|GS,u) is the product of the likelihoods across all the marker trees.
Adding (or removing) a pair of gene-conversion and coalescence nodes
As before, we generate two uniform random variables u and v from the interval (0, tH), where tH denotes the
height of the genealogy. The smaller of the two becomes the time for inserting a new gene-conversion node and the larger is the time corresponding to the coalescence node. Note that we are interested only in gene-conversion events that can potentially change the genealogy of the sample at the marker locations and thus the sample configuration.
Letl22l1denote the distance between the start and the
end of the ancestral segment in a branch of the graph. We propose a gap position (g) for initiation of gene conversion nonuniformly from a region of lengthl22l1+ 50m, where
the sequence of length 50mlies to the immediate left of the start of the ancestral region in the MA vector andmdenotes the mean conversion tract length.
The probability that a gap location is proposed is pro-portional to the chance that the tract length is greater than or equal to the distance (k) from the nearest MA vector position on the right of that gap location. The chance that the tract length is$kis given by
qð12qÞk21þqð12qÞkþqð12qÞkþ1. . .N¼ qð12qÞ
k21
ð12ð12qÞÞ ¼ ð12qÞk21:
After choosing the initiation gap, we propose a tract length (z) according to a truncated geometric distribution conditional on the tract length greater than or equal to the distance from the nearest MA vector position on the right, so that only tracts that can affect the genealogy of the sample at markers are included. When the start of the gene-conver-sion tract is to the left of the start of the MA vector, we include the additional condition that the end of the tract is always to the left of the end of the MA vector. Thus, we exclude tracts$l2–l1+kfor such cases because such tracts
do not affect the sample configuration (the probability of picking such a gap is proportional to ð12qÞk212 ð12qÞl22l1þk21). The probability of acceptance is equal to
a¼min 1; lðXjG9S;uÞQðGSjG9SÞfðG9Sjr;g;mÞ lðXGS;uÞQðG9SGSÞfðGSr;g;mÞ
!
;
where the proposal ratio is
QðGSjG9SÞ
QðG9SGSÞ
¼ t2Hn9br1n9br2 2npairpðgÞdðzÞ:
The terms are the same as before except thatp(g) denotes the chance that a gap location is proposed. Letpjdenote the probability that a gene-conversion tract that initiates at thejth base pair along the sequence includes some but not all ances-try vector positions. Then,pðgÞ ¼pg=
Pj¼l2
j¼l1250mpj.d(z) repre-sents the density of the truncated geometric distribution for tract length at the chosen gap location; i.e., P(Z =z|Tract includes some but not all MA vector positions. Note that the proposal distributions for both initiation points and tract lengths are identical to the prior distributions when gene-conversion rates are assumed to be uniform along the sequence. npair refers to the number of possible pairs of
gene-conversion and coalescence nodes that can be deleted. n9br1 andn9br2refer to the number of eligible branches at the
times at which new gene-conversion and coalescence nodes will be inserted, where eligible branches must have ancestry vector length.1 when inserting gene-conversion nodes.
Local topology rearrangements
This move consists of moving either a recombination or a coalescence node to a new location in the graph. It is identical to what is described in Wang and Rannala (2008) except that the conditional probability terms will include parametersr,g, andminstead ofralone.
Propose new waiting times between events in the graph
We propose a new graph with new waiting times between the successive (recombination or coalescence) events. The topol-ogy of the graph is left unchanged in this new move. The waiting times to the next event are proposed from the prior distribution expected under coalescent theory on the basis of the number of lineages and the ancestry vectors after the previous event. Note that this proposal is independent of the current waiting times. The probability of acceptance is given by
a¼min 1; lðXjG9S;uÞQðGSjG9SÞfðG9Sjr;g;mÞ lðXGS;uÞQðG9SGSÞfðGSr;g;mÞ
!
:
Let k denote the number of lineages after the previous event. Under coalescent theory, the rate of coalescence is 0.5k(k – 1), the rate of crossing over is 0.5kr, the rate of gene conversion is 0.5kg, and the waiting time to the next event is exponentially distributed with an overall rate of [0.5k(k–1) + 0.5kr+ 0.5kg]. However, because here we are interested only in informative gene-conversion and
crossing-over events, we have to make some modifications when calculating the rates. Let fidenote the fraction of the sequence included within the start and the end of the an-cestry vector. Then, the rate of informative crossing-over events for theith lineage is given byrfiand the overall rate of crossing over becomesrt¼
Pi¼k
i¼1rfi:Similarly, letpij de-note the probability that a gene-conversion tract that ini-tiates at the jth basepair along the sequence in lineage i includes some but not all ancestry vector positions at that lineage. Let g/Ldenote the gene-conversion rate per base pair. Then, the rate of informative gene conversions is given bygt¼
Pi¼k i¼1
Pj¼l2ðiÞ
j¼l1ðiÞ250mpijg=L;wherel1(i) andl2(i) denote
the start and the end of the ancestry vector for theith lin-eage. Thus, the waiting times to informative events are ex-ponentially distributed with a rate of [0.5k(k–1) + 0.5rt+ 0.5gt]. The overall probability of a proposal is equal to the product of the exponential density functions of successive events. Note that since we propose the new waiting times from the coalescent prior,
QðGSjG9SÞfðG9Sjr;g;mÞ
QðG9SGSÞfðGSr;g;mÞ
¼1:
Coalescent prior density for a genealogy: To calculate the coalescent prior probability for a genealogyGS,i.e.,f(GS|r,
g,m), we calculate the product of three quantities at each event and multiply them together:
1. Density of the waiting time for that event: The time is exponentially distributed with a rate of [0.5k(k – 1) + 0.5rt + 0.5gt].
2. The probability that the event is a coalescence or a gene conversion or a crossing over:
PðCoalescenceÞ ¼ 0:5kðk21Þ
½0:5kðk21Þ þ0:5rtþ0:5gt
Pðgene conversionÞ ¼ 0:5gt
½0:5kðk21Þ þ0:5rtþ0:5gt
Pðcrossing overÞ ¼ 0:5rt
½0:5kðk21Þ þ0:5rtþ0:5gt :
3. The chance is calculated that (a) a particular pair of lin-eages will be picked to coalesce; i.e., 2/k(k – 1) if the event is coalescence. (b) If the event is crossing over, the chance that a particular lineage will be picked for crossing over is multiplied by the chance that its breakpoint will be picked. (c) If the event is gene conversion, the chance that the particular lineage is picked for gene conversion is mul-tiplied by the chance that its initiation point is chosen multiplied by the chance that the tract length is chosen.
Propose a new breakpoint (and tract length) for a recombination node
In this move, we pick a crossing-over or gene-conversion node at random and propose a new breakpoint (and tract length)
for that node. We also randomly propose a new direction for how the products of recombination get distributed (i.e., which part goes to the left branch/right branch of the recombination node). We then update the ancestry vectors of the subsequent nodes in the graph on the basis of the modified node. The probability of acceptance as before is equal to
a¼min 1; lðXjG9S;uÞQðGSjG9SÞfðG9Sjr;g;mÞ lðXGS;uÞQðG9SGSÞfðGSr;g;mÞ
!
:
If the chosen node is a crossing-over node, we propose a new breakpoint uniformly between the start and the end of the ancestry vector positions and the proposal ratio for the node is equal to 1. The proposal ratio for a new breakpoint and tract length for a gene-conversion node is given by
QðGSjG9SÞ
QðG9SGSÞ
¼ pðgÞdðzÞ pðg9Þdðz9Þ:
Here,p(g) denotes the probability that a breakpoint loca-tion is proposed in a gene-conversion node. Letpjdenote the probability that a gene-conversion tract that initiates at thejth basepair along the sequence includes some but not all ances-try vector positions. Then, pðgÞ ¼pg=
Pj¼l2
j¼l1250mpj, wherel1
and l2denote the start and the end of the ancestry vector,
respectively.d(z) is the density of the truncated geometric distribution for tract length at the chosen gap location; i.e., P(Z = z| Tract includes some but not all MA vector positions.
Modify ancestral states, haplotype phases, and missing data
These steps are identical to those found in Wang and Ran-nala (2008) because the likelihood of the data given the genealogy trees and u, i.e., l(X|GS, u), is the same as de-scribed there.
Propose new values for the parametersr,g, m, andu
Newris proposed according to a sliding window with refl ect-ing boundary at 0. The acceptance probability is given by
a¼min
1; fðGSjr9;g;mÞfðr9Þ fðGSjr;g;mÞfðrÞ
:
New g is proposed according to a sliding window with reflecting boundary at 0. The acceptance probability is given by
a¼min
1; fðGSjr;g9;mÞfðg9Þ fðGSjr;g;mÞfðgÞ
:
New mis proposed according to a sliding window with reflecting boundaries at 1 and at 2000 or 3000 bp. The acceptance probability is given by
a¼min
1; fðGSjr;g;m9Þfðm9Þ fðGSjr;g;mÞfðmÞ
:
New u is proposed according to a sliding window with reflecting boundary at 0. The acceptance probability is given by
a¼min
1; lðXjGS;u9Þfðu9Þ lðXjGS;uÞfðuÞ
:
Variable recombination rate model
We also use a variable recombination rate model in our analysis that includes background rate variation and hot-spots. In this model, the background crossing-over rate follows a gamma distribution with shape and scale param-eters and recombination hotspots that arise according to a Markov process. The waiting distance until the occurrence or loss of a crossing-over hotspot is exponentially distrib-uted while the intensity of a hotspot follows a log-normal distribution. More details about this crossing-over model can be found in Wang and Rannala (2009). In our exten-sion of the Wang and Rannala model, we assume that gene-conversion and crossing-over rates vary in an identi-cal pattern such that their ratio (f) remains uniform along the sequence. Thus, all crossing-over hotspots are also gene-conversion hotspots.
Results
Checking the MCMC program
To check the correctness of our MCMC algorithm, we first examined the stationary distribution of several genealogy-based summary statistics when the chain is run with no data (i.e., with the likelihood ratio set to 1). Wefixed the values ofr,g, andmwhen running the chain and then compared the distribution of the number of crossing-over (CO) events, the number of conversion (GC) events, and the gene-alogy height (H) with coalescent simulations for the same parameters. As can be seen from Table 1, the expectations from the MCMC algorithm are in agreement with those obtained by straightforward Monte Carlo simulations under the coalescent.
Test runs on simulated data:Next, we tested our inference program on data sets simulated with gene conversion alone and compared the posterior distribution ofgas estimated by our program with the true value used in simulations. For this testing, we fixed the mean tract length anduto their true values andrwasfixed at 0. The results obtained are shown insupporting information,Figure S1. When gene-conversion rates are high, we expect that the power to detect gene conversion will be high and our posterior distribution will not include 0 most of the time (e.g.,g= 4000/Mb,Figure S1), which would tell us clearly that conversions have happened. On the other hand, when gene-conversion rates become lower it becomes difficult to infer whether a
conver-sion event has happened in a particular sample’s history (because the posterior will often include 0). This is because not every gene-conversion event is necessarily detectable in a sample and with only a few conversion events in a sample history, by chance, we could have samples that are also consistent with one or more binary trees.
In Figure S1ii we show results when we run our joint estimation program on data sets simulated with gene con-version alone with the tract lengthfixed at its true value. We can see that estimates of r are low but nonzero and the credible intervals contain values close to 0. Note that esti-mates ofgunder this joint estimation scenario can be con-siderably lower than the truth although the true value ofris 0 (which means that we interpret some of the gene conver-sions as crossing overs). InFigure S1iii we show results for the other boundary case,i.e., when data are simulated with crossing over alone with g set at 0. For this scenario, we attempted to estimate both crossing-over and gene-conver-sion rates with the tract length fixed at different values. In addition, we also estimated the recombination parameters and mean tract lengths jointly. We can see that estimates of
gcan be substantial although the true value is 0. When the mean conversion tract length becomes longer (e.g., 2000 bp, 8000 bp), we observe multiple peaks in the joint posterior distribution. This suggests that more than one combination of crossing-over and gene-conversion rates can explain the simulated data and there is difficulty in distinguishing be-tween the effects of these two processes.
For Figure S2, we assumed that both gene-conversion rates and mean tract lengths are unknown and estimated them jointly. Subsequently, we performed simulations with both crossing over and gene conversion and attempted to jointly estimate both g and r for these data sets with the mean tract length set to its true value. The corresponding results are shown inFigure S3. In all thefigures (i.e.,Figure S1,Figure S2,Figure S3), we can see that the modes of the posterior distribution are close to the true values of the re-combination parameters. In Figure S3 too, we sometimes see more than one peak in the posterior distribution.
In general, estimating gene-conversion rates from pop-ulation genomic data is a challenging problem. This is because the traces of this phenomenon in data are limited and subtle. Note that the ability to detect and quantify gene conversion in both experiments and population genetic analysis depends on the tract size. When tracts are short compared to the spacing between markers, a substantial fraction of gene-conversion events will not leave a trace in the sample, making it difficult to infer rates accurately. On the other hand, when tracts are long compared to the sequence of interest, some fraction of them will fall only partly inside the sequence and will be indistinguishable from crossing over. As Figure S1, ii and iii, and Figure S3 high-light, there can be substantial confounding when attempting to jointly estimate both these parameters and it is difficult to tease apart the effects of conversion and crossing over from one another.
Simulations with variable recombination rates:We tested an implementation of InferRho that incorporates variation in crossing-over and gene-conversion rates on data sets simu-lated with recombination hotspots. We simusimu-lated 20 sam-ples of 20-kb sequences with u = 20.0,m = 500 bp, and a single hotspot between 9 kb and 11 kb. Both randg= 50/Mb outside hotspots, whereas within the hotspot these numbers were 5000/Mb. The ratio of gene conversion to crossing over (f) was assumed to be uniform along the se-quence in these simulations withf= 1.0. Table 2 shows the results obtained from running our program on three inde-pendent replicates for these parameters.
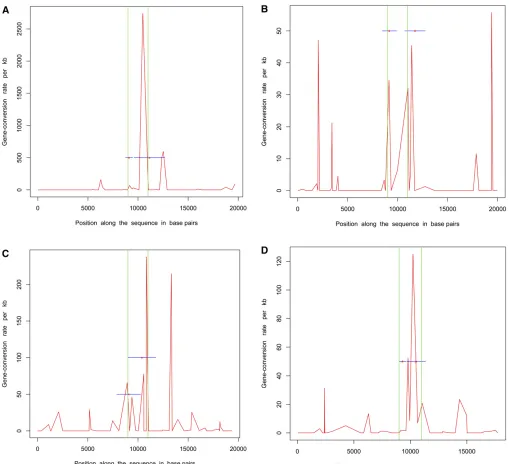
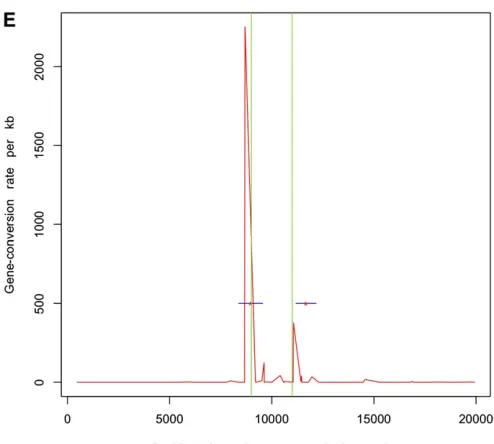
Next, we simulated 50 samples of 20-kb sequences withu = 20.0,m= 500 bp, a single hotspot between 9 kb and 11 kb, and uniform f = 10.0 (parameters used in Gay et al. 2007). r = 50/Mb and g = 500/Mb outside hotspots, whereas within the hotspot these numbers were 5000/Mb and 50,000/Mb, respectively. We estimated recombination rates for these data sets using the program of Gay et al. (2007), which implements a variable gene-conversion rate model. Note that this program does not try to identify hot-spots but estimates a different crossing-over and gene-con-version rate between adjacent SNPs. We also inferred the locations of hotspots using InferRho. Figure 1 plots the results obtained using these two different methods on five independent replicates for these parameters. In both Table 2 and Figure 1, we can see that the estimated locations of the starts and ends of hotspots are close to the true locations.
Comparison with other methods: We compared the per-formance of our method (implemented in the software package InferRho) with that of the methods described in Gayet al.(2007) and Yinet al.(2009). For this comparison, we simulated 100 data sets each for two different parameter
combinations and estimated all three recombination param-eters (i.e., the population crossing-over rate, the population gene-conversion rate, and the mean tract length) jointly for these data sets. Then, we calculated summaries of these estimates and compared them with those obtained from the other two methods. These comparisons are shown in Table 3. Note that the summaries for the methods of Gay et al.(2007) and Yinet al.(2009) are based on the same set of simulated data sets whereas those for our method are based on an independent sample of 100 data sets. When implementing all three methods, the starting values of the recombination parameters were set to the true value that was used in simulations.
For all the parameters tested, we find that the perfor-mance of the InferRho program and the method of Yinet al. (2009) are better than that of Gayet al.(2007). Presumably this is because the approach of Gay et al. (2007) ignores overlapping gene-conversion events while the other two methods do not assume this restriction. In theory, we would expect the Gay et al. (2007) method to perform worse if overlapping gene-conversion events are significantly fre-quent in the history of the sample. Compared to the method of Yinet al.(2009), InferRho appears to have higher mean squared error for tract length estimation but lower mean squared error for crossing-over and gene-conversion rate estimation. This may be due to confounding when attempt-ing to estimate both gene-conversion rates and tract lengths jointly from population genetic data.
Estimates in real data
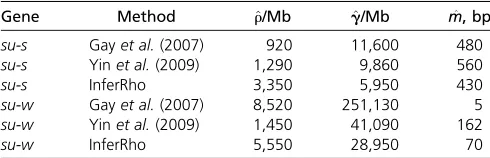
We applied our method to jointly estimate the crossing-over and gene-conversion rates in two genes, the su-w andsu-s genes ofD. melanogasterthat werefirst studied by Langley et al.(2000). These genes are located close to the telomeric Table 1 Comparison between the MCMC program and coalescent simulations
ra ga E(CO)b E(CO)c E(GC)b E(GC)c E(H)b E(H)c Mean tract Sample size Md Le
0.000 0.300 0.0000 0.0000 4.4084 4.4233 2.4454 2.4572 5 8 4 4
0.000 0.100 0.0000 0.0000 1.2583 1.2614 1.9721 1.9781 2 8 4 4
0.100 0.100 0.3163 0.3162 0.5782 0.5777 1.2694 1.2682 5 2 4 4
0.300 0.300 2.4264 2.4281 2.7716 2.7760 4.4577 4.4683 5 8 4 4
0.100 0.300 0.8060 0.8061 2.5602 2.5605 4.4287 4.4282 5 8 4 4
0.001 0.001 29.884 30.646 3.3402 3.4341 5.7887 5.9864 100 8 8 8000
aPopulation crossing-over and gene-conversion rates per base pair.
bAverage of crossing-over count, gene-conversion count, and height of genealogy from coalescent simulations. cAverage of crossing-over count, gene-conversion count, and height of genealogy from MCMC algorithm. dNumber of markers.
eSequence length in base pairs.
Table 2 Estimated locations of hotspots in three independent simulated data sets
Data set Hotspot start, bp Hotspot end, bp Hotspot intensity estimate ^f
Replicate 1 9,486 (8,746–10,226) 10,555 (8,911–12,199) 4,030.71 2.375 (0.375–6.125) Replicate 2 10,885 (5,240–16,530) 11,879 (6,969–16,789) 8,160.21 0.375 (0.125–7.375) Replicate 3 9,822 (8,087–11,557) 11,068 (9,240–12,896) 3,968.12 3.625 (1.125–4.625)
Each simulated data set consists of 20-kb sequences and 20 samples with a single hotspot of intensity 5000/Mb between 9 kb and 11 kb. The relative rate of gene conversion to crossing over (f) was uniform along the sequence and was equal to 1. The estimated locations for the start and end of hotspots andfare shown along with the 90% credible intervals in parentheses.
regions of the X chromosome and are 4.1 kb and 2.5 kb long, respectively. The su-sdata set contains 50 haplotypes and 41 SNPs whereas thesu-w data set that we used con-tains 50 haplotypes and 46 SNPs in an African-only sample. We did not try to estimate tract lengths in our initial analysis and fixed them to 352 bp (estimates from Hilliker et al. 1994). The value of u was set to be equal to Watterson’s estimate for each data set. Table 4 shows the results obtained for this analysis (see also Figure S5).
Subsequently, we implemented a version of our inference program where we estimated both mean tract lengths and
recombination rates jointly. These results are shown in Table 5. Figure S4 shows 95% credible intervals with maximum posterior density for the estimated parameter values. Note that the estimated rate of gene conversion depends on the mean tract length and for shorter tracts the inferred rates are expected to be higher (see alsoFigure S5).
We also compared our results with those obtained by the methods in Gayet al.(2007) and Yinet al.(2009) in Tables 4 and 5. We observe that there is some difference between the point estimates provided by the three different pro-grams. Presumably, this is because there is limited Figure 1 Estimated locations of hotspots in data sets simulated with a uniform ratio of gene conversion to crossing over (f)¼10. Simulations consisted of 20-kb sequences and 50 samples with a single hotspot between 9 kb and 11 kb. The red curve shows the gene-conversion rates as inferred by the program of Gayet al.2007 under a variable rate model. The red asterisks mark the posterior means of the starts and ends of hotspots as estimated by InferRho, the blue lines represent 90% credible intervals, and the green lines show the true locations of hotspots. Most of the posterior samples obtained from InferRho contained a single hotspot.
information in these data sets for joint estimation and there is difficulty in distinguishing between the effects of the dif-ferent recombination mechanisms in the short sequences of theDrosophilagenes.
Bayes factor in real data
We compared the posterior distribution of gene-conversion start points in thesu-wandsu-sgenes with the distribution under an uninformative prior. The prior distributions were obtained by running the chain without any data (i.e., with likelihood ratio = 1) for the same sample size and marker positions as in the real data sets and assuming uniform re-combination rates. Letp1denote the probability that a
con-version initiation point lies within a particular window for the prior sample of genealogies (This is the fraction of initi-ation points that lie within that window). Similarly, let p2
denote the corresponding probability for the posterior sam-ple of genealogies. The odds for the prior and posterior for a window are given by p1/(12 p1) and p2/(1 2 p2),
re-spectively. Formally, the Bayes factor (BF) is defined as the ratio of the posterior and prior odds;i.e.,
BF¼p2ð12p1Þ p1ð12p2Þ:
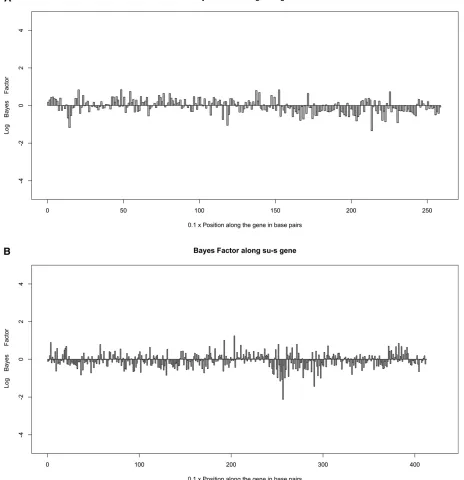
The log of the BF should be interpreted as the change in the evidence for gene-conversion initiation in a region due to the data. A large negative value indicates evidence against gene-conversion initiation and a large positive value indicates evidence for gene-conversion initiation. The BF for 10-bp windows is plotted along the genes, assuming the mean tract length = 352 bp (see Figure 2, A and B). Note that the Bayes factors for the windows were expected to indicate where gene-conversion events have occurred in the history of the sample but their values do not necessarily imply high or low rates. Thus, this analysis is unrelated to hotspot identification described in theSimulations with vari-able recombination rates section. For these Drosophiladata sets, it seems that there is little information concerning the location of gene-conversion start points because we do not see very large or very small BFs (|log(BF)|,2 generally).
Discussion
We have described a Bayesian MCMC method for jointly inferring the crossing-over and gene-conversion parameters from SNP data sets that extends the crossing-over estimation method originally proposed by Wang and Rannala (2008). In this method, we model the genealogy of a sample as a recombination graph and keep track of ancestral marker sites in the MA vectors of its nodes. Furthermore, we include only informative crossing-over and gene-conversion events that can potentially change the genealogy of the sample at the marker locations. These aspects of our algorithm make the full-likelihood estimation of recombination rates effi -cient in terms of both the running time and memory require-ments. Assuming an uninformative prior for the parameters of interest, we can estimate their joint posterior distribution using a reversible-jump MCMC scheme. In the Metropolis– Hastings step, we propose changes to various features of the Figure 1 Continued.
Table 3 Comparison between three different methods for recombination rate estimation
Method ra ga ma MSE(r^)b MSE(^g)b MSE(m^)b #(^r:2)c #(^g:2)c #(m^:2)c
Gayet al.(2007) 500 500 500 3.488 1,022,389 0.723 0.71 0.26 0.36
Yinet al.(2009) 500 500 500 0.079 0.661 0.105 0.71 0.55 0.88
InferRho 500 500 500 0.041 0.222 0.644 0.89 0.77 0.56
Gayet al.(2007) 500 1000 500 0.085 618,219 0.349 0.78 0.48 0.35
Yinet al.(2009) 500 1000 500 0.060 1.348 0.098 0.79 0.70 0.87
InferRho 500 1000 500 0.043 0.487 0.250 0.88 0.81 0.62
ardenotes population crossing-over rate,gdenotes the population gene-conversion rate, andmdenotes the mean conversion tract length for the 100 simulated data sets. Recombination rates and mean tract lengths are shown in units of per megabase and base pair, respectively.
bMSE, the mean square error of the parameter estimates for the 100 simulated data sets·1026. For InferRho, we calculated the marginal estimate of each recombination parameter from the joint posterior distribution. Numbers for the other methods are taken from Yin (2010).
c#(^r:2) represents the fraction of the 100 data sets for which estimates are within a factor of 2 of the true parameter value used in simulations (i.e.,r). #(g^:2) and #(m^:2) are defined similarly.
ancestral recombination graph such as the relative locations of the recombination or coalescence nodes, the number of crossing-over or gene-conversion nodes, the ancestral alleles, and the waiting times between consecutive events in the graph, etc. The method has been implemented in a new version of the software package InferRho (see Wang and Rannala 2008), which will become available online at
http://rannala.org. Currently, we are checking the soft-ware’s performance for larger values ofrandg($50.0).
The MCMC method described here attempts to generate a posterior sample of genealogies for the data under the coalescent. It uses all the information contained in the haplotypes or genotypes for this purpose (because we propose and accept only genealogies consistent with the observed data) and theoretically, after a very large number of iterations, we expect samples from essentially the correct posterior distribution. In contrast, PAC-based models (e.g., Hellenthal 2006; Gayet al. 2007; Yinet al.2009) evaluate likelihoods of the data assuming a heuristic model that is an approximation of the constant population size coalescent. The relationship between the PAC model and the coalescent process is not well understood theoretically although they appear to be analogous. Apart from the benefit of having a posterior sample of genealogies, the main advantage of our Bayesian approach compared to other alternatives is that we expect to obtain better confidence intervals for the estimated parameter values (if the coalescent is a closer ap-proximation to reality). It is also worth mentioning that the PAC model developed by Yin et al. (2009) considers only a restricted class of gene-conversion events (with regard to overlaps between events) whereas our method is more gen-eral and models all the conversion events that can
poten-tially affect the configuration of the sample. Finally, since the InferRho algorithm lies within the coalescent framework, it is flexible and in principle can be extended for estimation under demographic models other than constant sized ones (e.g., exponential growth, population bottlenecks, etc.).
We performed two different kinds of tests on simulated data to verify the correctness of our estimation program. First, we ran the program without any data using a likeli-hood ratio of 1 and compared the average of several genealogy-based summary statistics to those obtained by Monte Carlo simulations under the coalescent. Second, we simulated data sets for which the true parameter values are known and compared them with the mode of the posterior distributions as estimated by the program. From both these tests, it appears that the modified InferRho program is working correctly. In addition to these, we also compared the accuracy of our inference method with that of two other comparable methods (proposed in Gay et al.2007 and Yin et al. 2009) for samples of 100 simulated data sets. For estimating crossing-over and gene-conversion rates, Infer-Rho has smaller mean squared error compared to the meth-ods of Gay et al. (2007) and Yin et al. (2009) for the parameters tested in this study. For estimation of tract length, the mean squared error of InferRho is lower than the program of Gayet al.(2007) but higher than that of Yin et al.(2009).
We used the new version of InferRho to jointly estimate crossing-over and gene-conversion rates in thesu-wandsu-s genes of D. melanogaster. Our analysis with a fixed mean tract length of 352 bp suggests that gene conversion occurs more frequently than crossing over in these regions while the local estimates of crossing-over rate are not low. Further-more, we also attempted to jointly estimate recombination rates and gene-conversion tract lengths and from this analysis it appears that mean tract lengths are 70 bp and 430 bp for thesu-wandsu-sgenes, respectively. Finally, we compared the posterior distribution of gene-conversion ini-tiation points with an uninformative prior distribution, using the Bayes factor calculated for 10-bp windows along these genes. Plots of the logarithm of Bayes factors for gene-con-version start points do not indicate any strong deviations from a prior distribution expected under the uniform recom-bination rate model. This suggests that there is not sufficient information in the data to infer the locations of historical conversion breakpoints.
Table 4 Joint estimates of crossing over (r) and gene conversion (^ g) for^ m= 352 bp
Gene Method ^r/Mb per Mb ^g/Mb per Mb ^f¼g^/^r
su-s Gayet al.(2007) 1,700 12,000 7.10
su-s Yinet al.(2009) 2,240 11,510 5.14
su-s InferRho 1,500 (700–5,500) 6,900 (3,500–10,300) 4.60 (0.875–7.875)
su-w Gayet al.(2007) 570 28,000 48.0
su-w Yinet al.(2009) 33 27,040 819.4
su-w InferRho 4,300 (2,500–8,100) 11,700 (5,300–16,100) 2.72 (0.875–3.625)
The 95% maximum posterior density credible intervals for InferRho are shown in parentheses. For InferRho, MCMC chains were run for 40 million iterations and thefirst 10 million iterations were discarded as burn-in. For other methods, the numbers are taken from Yin (2010).
Table 5 Estimates of crossing over (^r), gene conversion (g),^ and mean tract length (m^)
Gene Method ^r/Mb g^/Mb m^, bp
su-s Gayet al.(2007) 920 11,600 480
su-s Yinet al.(2009) 1,290 9,860 560
su-s InferRho 3,350 5,950 430
su-w Gayet al.(2007) 8,520 251,130 5
su-w Yinet al.(2009) 1,450 41,090 162
su-w InferRho 5,550 28,950 70
For InferRho, MCMC chains were run for 41 million and 37 million iterations (for
su-sandsu-w, respectively) and thefirst 10 million iterations were discarded as burn-in. We show the marginal estimate of each parameter from the joint posterior distribution. For other methods, the numbers are taken from Yin (2010).
One area of concern with using full-likelihood methods is their high computational expense when data sets become large. Note that the execution time of the InferRho algorithm is much higher (orders of magnitude) than those of Gay et al. (2007) and Yin et al. (2009). Therefore, it would be desirable to make such inference methods as op-timal as possible in terms of run-time efficiency. To improve speed, we implemented several optimizations in the current version of our program. In our MA vectors, we keep track of marker locations that are ancestral to the sample and
ex-clude uninformative gene-conversion and crossing-over events in the ARGs. We use arrays of size equal to the num-ber of markers to represent the MA vectors. Operations on MA vectors (e.g., merging two MA vector arrays during co-alescence,finding which marker positions have coalesced in a node, etc.) take linear time in terms of the total number of markers. Second, we use lookup tables to keep track of the coalescent prior likelihood of a graph and the likelihood of observed data given a graph once they have been calculated. Since a majority of newly proposed genealogies do not get Figure 2 (A) Bayes factors along thesu-wgene for 10-bp windows. The logarithm of the ratio of posterior to prior odds for gene-conversion initiation points is plotted along the gene. Thesu-wgene is 2.5 kb long. (B) Bayes factors along thesu-sgene for 10-bp windows. The logarithm of the ratio of posterior to prior odds for gene-conversion initiation points is plotted along the gene. Thesu-sgene is 4.1 kb long.
accepted, these values are reused multiple times when cal-culating the acceptance probabilities in the algorithm. Fi-nally, modifying some part of the graph (e.g., adding, deleting, or moving a node) during a proposal entails that we update the MA vectors of the subsequent nodes in the graph. While implementing this step, we first mark all the nodes that are ancestral to the modified node and then update only the MA vectors of the marked nodes. This previous step as well as parallelization of the code when running multiple MCMC chains can lead to further improve-ments in run-time efficiency.
Acknowledgments
This research project was supported by National Human Genome Research Institute grant HG-01988 to B.R.
Literature Cited
Allers, T., and M. Lichten, 2001 Differential timing and control of noncrossover and crossover recombination during meiosis. Cell 106: 47–57.
Andolfatto, P., and J. D. Wall, 2003 Linkage disequilibrium pat-terns across a recombination gradient in African Drosophila mel-anogaster. Genetics 165: 1289–1305.
Carlson, C. S., M. A. Eberle, L. Kruglyak, and D. A. Nickerson, 2004 Mapping complex disease loci in whole-genome associ-ation studies. Nature 429: 446–452.
Coop, G. C., X. Wen, C. Ober, J. K. Pritchard, and M. Przeworski, 2008 High-resolution mapping of crossovers reveals extensive variation in fine-scale recombination patterns among humans. Science 319: 1395–1398.
Crawford, D. C., T. Bhangale, N. Li, G. Hellenthal, M. J. Riederet al., 2004 Evidence for substantialfine-scale variation in recombina-tion rates across the human genome. Nat. Genet. 36: 700–706. Dunham, I., N. Shimizu, B. A. Roe, S. Chissoe, A. R. Hunt et al.,
1999 The DNA sequence of human chromosome 22. Nature 402: 489–495.
Fearnhead, P., and N. G. Smith, 2005 A novel method with im-proved power to detect recombination hotspots from polymor-phism data reveals multiple hotspots in human genes. Am. J. Hum. Genet. 77: 781–794.
Fogel, S., R. K. Mortimer, and K. Lusnak, 1983 Meiotic gene con-version in yeast: molecular and experimental perspectives, pp. 67–107 inYeast Genetics, edited by J. F. T. Spencer, D. M. Spencer, and A. R. W. Smith. Springer-Verlag, New York. Frisse, L., R. R. Hudson, A. Bartoszewicz, J. D. Wall, J. Donfack
et al., 2001 Gene-conversion and different population histories may explain the contrast between polymorphism and linkage disequilibrium levels. Am. J. Hum. Genet. 69: 831–843. Fullerton, S. M., R. M. Harding, A. J. Boyce, and J. B. Clegg,
1994 Molecular and population genetic analysis of allelic se-quence diversity at the human-globin locus. Proc. Natl. Acad. Sci. USA 91: 1805–1809.
Gay, J., S. Myers, and G. McVean, 2007 Estimating meiotic gene con-version rates from population genetic data. Genetics 177: 881–894. Griffiths, R. C., and P. Marjoram, 1996 Ancestral inference from samples of DNA sequences with recombination. J. Comput. Biol. 3: 479–502.
Hellenthal, G., 2006 Exploring rates and patterns of variability in gene conversion and crossover in the human genome. Ph.D. Thesis, University of Washington, Seattle.
Hilliker, A. J., S. H. Clark, and A. Chovnick, 1991 The effect of DNA sequence polymorphisms on intragenic recombination in the rosy locus ofDrosophila melanogaster. Genetics 129: 779–781. Hilliker, A. J., G. Harauz, A. G. Reaume, M. Gray, S. H. Clarket al.,
1994 Meiotic gene conversion tract length distribution within the rosy locus ofDrosophila melanogaster. Genetics 137: 1019– 1026.
Hudson, R. R., 1983 Properties of a neutral allele model with intragenic recombination. Theor. Popul. Biol. 23: 183–201. Hudson, R. R., 2001 Two-locus sampling distributions and their
application. Genetics 159: 1805–1817.
Innan, H., B. Padhukasahasram, and M. Nordborg, 2003 The pat-tern of polymorphism on human chromosome 21. Genome Res. 13: 1158–1168.
International HapMap Consortium, 2005 A haplotype map of the human genome. Nature 437: 1299–1320.
Jeffreys, A. J., and C. A. May, 2004 Intense and highly localized gene-conversion activity in human meiotic crossover hotspots. Nat. Genet. 36: 151–156.
Jeffreys, A. J., L. Kauppi, and R. Neumann, 2001 Intensely punc-tuate meiotic recombination in the class II region of the major histocompatibilty complex. Nat. Genet. 29: 217–222.
Jeffreys, A. J., R. Neumann, M. Panayi, S. Myers, and P. Donnelly, 2005 Human recombination hotspots hidden in regions of strong marker associations. Nat. Genet. 37: 601–606.
Kingman, J. F. C., 1982 The coalescent. Stoch. Proc. Appl. 13: 235–248.
Langley, C. H., B. P. Lazzaro, W. Phillips, E. Heikkinen, and J. M. Braverman, 2000 Linkage disequilibrium and the site fre-quency spectra in the su(s) and su(wa) regions of theDrosophila
melanogasterX chromosome. Genetics 156: 1837–1852. Li, N., and M. Stephens, 2003 Modeling linkage disequilibrium,
and identifying recombination hotspots using single-nucleotide polymorphism data. Genetics 165: 2213–2233.
Liu, J. S., C. Sabatti, J. Teng, B. J. Keats, and N. Risch, 2001 Bayesian analysis of haplotypes for linkage disequilib-rium mapping. Genome Res. 11: 1716–1724.
Mancera, E., R. Bourgon, A. Brozzi, W. Huber, and L. M. Steinmetz, 2008 High-resolution mapping of meiotic crossovers and non-crossovers in yeast. Nature 454: 479–485.
McVean, G. A. T., S. R. Myers, S. Hunt, P. Deloukas, D. R. Bentley et al., 2004 Thefine-scale structure of recombination rate var-iation in the human genome. Science 304: 581–584.
Morris, A. P., J. C. Whittaker, and D. J. Balding, 2002 Fine-scale mapping of disease loci via shattered coalescent modeling of genealogies. Am. J. Hum. Genet. 70: 686–707.
Myers, S., L. Bottolo, C. Freeman, G. A. T. McVean, and P. Donnelly, 2005 A fine-scale map of recombination rates and hotspots across the human genome. Science 310: 321–324.
Niu, T., Z. S. Qin, X. Xu, and J. S. Liu, 2002 Bayesian haplotype inference for multiple linked single-nucleotide polymorphisms. Am. J. Hum. Genet. 70: 157–169.
Padhukasahasram, B., P. Marjoram, and M. Nordborg, 2004 Estimating the rate of gene-conversion on human chromosome 21. Am. J. Hum. Genet. 75: 386–397. Padhukasahasram, B., J. D. Wall, P. Marjoram, and M. Nordborg,
2006 Estimating recombination rates from single-nucleotide polymorphisms using summary statistics. Genetics 174: 1517– 1528.
Paques, F., and J. E. Haber, 1999 Multiple pathways of recombi-nation induced by double-strand breaks inSaccharomyces cere-visiae. Microbiol. Mol. Biol. Rev. 63: 349–404.
Ptak, S. E., K. Voelpel, and M. Przeworski, 2004 Insights into re-combination from patterns of linkage disequilibrium in humans. Genetics 167: 387–397.
Stahl, F. W., 1994 The Holliday junction on its thirtieth anniver-sary. Genetics 138: 241–246.
Szostak, J. W., T. L. Orr-Weaver, R. J. Rothstein, and F. W. Stahl, 1983 The double-strand-break repair model for recombina-tion. Cell 33: 25–35.
Tiemann-Boege, I., P. Calabrese, D. Cochran, R. Sokol, and N. Arnheim, 2006 High resolution recombination patterns in a region of human chromosome 21 measured by sperm typ-ing. PLoS Genet. 2: e70.
Voight, B. F., S. Kudaravalli, X. Wen, and J. K. Pritchard, 2006 A map of recent positive selection in the human genome. PLoS Biol. 4: e72.
Wall, J. D., 2004 Estimating recombination rates using three-site likelihoods. Genetics 167: 1461–1473.
Wall, J. D., and J. K. Pritchard, 2003 Haplotype blocks and linkage disequilibrium in the human genome. Nat. Rev. Genet. 4: 587–597. Wang, Y., and B. Rannala, 2008 Bayesian inference offine-scale recombination rates using population genomic data. Philos. Trans. R. Soc. B 363: 3921–3930.
Wang, Y., and B. Rannala, 2009 Population genomic inference of recombination rates and hotspots. Proc. Natl. Acad. Sci. USA 15: 6215–6219.
Wiuf, C., and J. Hein, 2000 The coalescent with gene-conversion. Genetics 155: 451–462.
Yin, J., 2010 Computational methods for meiotic recombination inference. Ph.D. Dissertation, University of California, Berkeley. Yin, J., M. I. Jordan, and Y. S. Song, 2009 Joint estimation of gene conversion rates and mean conversion tract lengths from pop-ulation SNP data. Bioinformatics 25: i231–i239.
Zangenberg, G., M. M. Huang, N. Arnheim, and H. Erlich, 1995 New HLA-DPB1 alleles generated by interallelic gene conversion detected by analysis of sperm. Nat. Genet. 10: 407–444.
Communicating editor: Y. S. Song
GENETICS
Supporting Information
http://www.genetics.org/content/suppl/2011/08/12/genetics.111.130195.DC1
Bayesian Population Genomic Inference of Crossing
Over and Gene Conversion
Badri Padhukasahasram and Bruce Rannala
#"
(#"" !(#""%'$'""
! !"
!
!(&"""('""($"!(&"""('""($"
!(&"""('""($"!($"""(#""($"
# #
& $(' $ 0('#'# ,+/ !# $ %& $ %&! #
&0('''"0*+)" 0)'
&0*'''"0*+)" 0)'
"" % '& #"
"#$%#
$% "$%
" "
%*'&&&"&!*(&!*'&"&!*'&&
%*'&&&"&!*(&!*'&"&!*)&&
##
$(' # $%& %& $%&!'# #
&,*'''",*+)",('#'",)'
!! !"#! "#
#)%$$$)%$$$)%$ $)'(&)&$%$
#)&$$$)&$$$)%$ $)'(&)&$%$
&$#$&"% &" &$ &$ "
&!$#$&"% &" &$ &$ "
#
""
#### " #$%#$%$ % '(& "
%#"
%! #"