INVESTIGATION
Quantifying the Variation in the Effective
Population Size Within a Genome
Toni I. Gossmann,* Megan Woolfit,†and Adam Eyre-Walker*,1
*School of Life Sciences, University of Sussex, Brighton, BN1 9QG, United Kingdom, and†School of Biological Sciences, University of Queensland, Brisbane, Queensland 4072, Australia
ABSTRACTThe effective population size (Ne) is one of the most fundamental parameters in population genetics. It is thought to vary across the genome as a consequence of differences in the rate of recombination and the density of selected sites due to the processes of genetic hitchhiking and background selection. Although it is known that there is intragenomic variation in the effective population size in some species, it is not known whether this is widespread or how much variation in the effective population size there is. Here, we test whether the effective population size varies across the genome, between protein-coding genes, in 10 eukaryotic species by considering whether there is significant variation in neutral diversity, taking into account differences in the mutation rate between loci by using the divergence between species. In most species we find significant evidence of variation. We investigate whether the variation inNeis correlated to recombination rate and the density of selected sites in four species, for which these data are available. Wefind thatNeis positively correlated to recombination rate in one species,Drosophila melanogaster, and negatively correlated to a measure of the density of selected sites in two others, humans andArabidopsis thaliana. However, much of the variation remains unexplained. We use a hierarchical Bayesian analysis to quantify the amount of variation in the effective population size and show that it is quite modest in all species—most genes have anNethat is within a few fold of all other genes. Nonetheless we show that this modest variation in Ne is sufficient to cause significant differences in the efficiency of natural selection across the genome, by demonstrating that the ratio of the number of nonsynonymous to synonymous polymorphisms is significantly correlated to synony-mous diversity and estimates ofNe, even taking into account the obvious nonindependence between these measures.
T
HE effective population size (Ne) is one of the mostfundamental quantities in population genetics, evolu-tionary biology, and molecular ecology, since it determines the effectiveness of natural selection and the level of neutral genetic diversity that a population contains (Charlesworth
2009). Populations and regions of the genome with smallNe
tend to have low levels of genetic diversity, to be susceptible to the accumulation of deleterious mutations through ge-netic drift, and to have potentially low rates of adaptive evolution (Charlesworth 2009).
The effective population size is expected to vary across the genome as a consequence of genetic hitchhiking (Smith
and Haigh 1974) and background selection (Charlesworth
et al.1993). The action of both positive and negative natural selection, particularly in regions of the genome with low rates of recombination, is expected to reduce the effective population size leading to lower levels of genetic diversity and reduced effectiveness of selection. Hence variation in the rate of recombination and the density of selected sites is expected to generate variation inNe.
The evidence that there is variation inNewithin a genome
comes from three sources. First, it has been shown that levels of neutral genetic diversity are correlated to rates of
recombination in Drosophila (Begun and Aquadro 1992),
humans (Hellmann et al. 2003), and some plant species
(Tenaillonet al.2004; Roselius et al.2005). This could be due to variation in the mutation rate since neutral genetic diversity is proportional to the effective population size mul-tiplied by the mutation rate. However, the level of neutral sequence divergence between species, which should be pro-portional to the mutation rate, is not correlated to the rate of Copyright © 2011 by the Genetics Society of America
doi: 10.1534/genetics.111.132654
Manuscript received July 12, 2011; accepted for publication September 23, 2011 Supporting information is available online at http://www.genetics.org/content/
suppl/2011/09/27/genetics.111.132654.DC1.
1Corresponding author: School of Biological Sciences, University of Sussex, Brighton,
recombination in Drosophila (Begun and Aquadro 1992)
and the plant species (Roseliuset al.2005) that have been
investigated. Furthermore, although there is a correlation between neutral sequence divergence and recombination rate in humans, this correlation is not sufficient to explain the correlation between diversity and the recombination
rate (Hellmannet al.2005). It is has also been shown that
the Y and W chromosomes, which have no recombination over most of their length, have substantially lower diversity than other chromosomes and that this cannot be attributed to differences in the mutation rate or the fact that there are
fewer Y and W chromosomes than autosomes (Filatovet al.
2001; Montellet al.2001; Bachtrog and Charlesworth 2002;
Hellborg and Ellegren 2004). It thus seems that the effective population size varies across genomes and is positively cor-related to the rate of recombination.
Second, under the neutral theory of molecular evolution it is expected that levels of diversity and divergence should be proportional to each other, since both depend on the neutral mutation rate. Deviations from this hypothesis, caused by variation inNe, can be tested using the HKA test
and derivatives of it (Hudson et al.1987; Ingvarsson 2004;
Wright and Charlesworth 2004; Innan 2006). Evidence for departures from the neutral hypothesis, based on the HKA test, comes from multiple multilocus surveys in plants
(Roselius et al. 2005; Schmid et al. 2005), the chicken
Z chromosome (Sundström et al. 2004), humans (Zhang
et al. 2002), and Drosophila(Moriyama and Powell 1996;
Machadoet al.2002).
Third, variation in the effective population size should manifest itself as variation in the effectiveness of selection
and this has also been observed. In Drosophilait has been
shown that codon usage bias is lower in the regions of the genome with very low rates of recombination (Hey and
Kliman 2002; Kliman and Hey 2003; Marais et al. 2003).
It has also been shown that the number of nonsynonymous
polymorphisms (Pn) relative to the number of synonymous
polymorphisms (Ps) is higher in the low-recombining parts
of the Drosophila melanogastergenome (Presgraves 2005),
that the rate of nonsynonymous (dN) relative to the rate of
synonymous (dS) substitution is positively correlated to the
frequency of recombination (Betancourt and Presgraves 2002), and that the overall efficiency of selection appears to be lower in the regions of the genome with low rates of
recombination (Presgraves 2005; Larracuenteet al. 2008).
Likewise it has been shown thatdN/dSis higher on the Y or
W chromosome than on the other chromosomes in humans
(Wyckoffet al.2002) and birds (Berlin and Ellegren 2006)
and on the fourth chromosome ofDrosophilaspecies (Arguello
et al. 2010). In contrast, Bullaughey et al. (2008) found no correlation between dN/dSand the rate of recombination in
primates.
It is thought that the correlation betweendN/dSorPn/Ps
and the rate of recombination is due to regions of the ge-nome with little or no recombination having low effective population size and hence reduced effectiveness of natural
selection (Betancourtet al.2009).Pn/Psis negatively
corre-lated to the rate of recombination because regions with low effective population size allow more slightly deleterious mutations to segregate for a longer time. In contrast, dN/ dS can be either positively or negatively correlated to the
rate of recombination depending on the prevalence of ad-vantageous mutations. If adad-vantageous mutations are com-mon, then regions of the genome with high rates of recombination are expected to evolve faster because they have a higher effective mutation rate and because selection is effective on a greater proportion of mutations. In contrast, if advantageous mutations are rare, then regions of the ge-nome with high rates of recombination may have low values ofdN/dSbecause selection against slightly deleterious
muta-tions is more effective.
Although it is well established that Nevaries across the
genome in a few species, it is unclear whether this is true of all species and, more importantly, how much variation inNe
there is and whether this variation results in differences in the effectiveness of selection. Here we test whether there is variation in the effective population size by considering whether there is significant variation in neutral diversity, taking into account that this might be due to variation in the mutation rate by using the divergence between species to control for differences in the mutation rate. We also quan-tify the variation inNe. We estimateNefrom the nucleotide
diversity at putatively neutral sites, since this is expected to
be equal to 4Nem in a diploid organism, where Ne is the
effective population size and m is the mutation rate per
generation. We use the divergence between two species at neutral sites as an estimate of the mutation rate per gener-ation. Note that since we are comparing loci within a ge-nome, they all share the same generation time (unless they are on the sex chromosomes or in the mitochondrial DNA) and so this does not have to be explicitly taken into account. We can therefore estimate the effective population size for each locus. However, although each individual estimate is unbiased, the distribution of these values has a variance that is greater than the true variance because of sampling error; a locus might have a particularly low diversity just by chance and not because its effective population size is particularly low. To get around this problem we use a hierachical
Bayes-ian framework to estimate the distribution of Ne across
genes, taking into account the sampling error associated with both the polymorphism and the divergence data.
We test for and investigate the variation in the effective population size in 10 eukaryotic species including humans,
D. melanogaster,A. thaliana, and Saccharomyces paradoxus
(Table 1). Wefind that there is statistically significant var-iation inNeacross genes, but that it is rather modest in most
of the organisms. We also investigate whether variation in
Newithin a genome leads to variation in the proportion of
between the two variables. We find overall evidence for a correlation between these two parameters and hence con-clude that even modest variation in the effective population size is sufficient to generate variation in the effectiveness of natural selection.
Materials and Methods
Sequence data
We obtained data from different plant species, mouse,
fruit-fly, and yeast using publicly available data from GenBank
(http://www.ncbi.nlm.nih.gov/Genbank). Polymorphism data for Homo sapiens were downloaded from Enivironmental Genome Project (egp.gs.washington.edu) and Seattle SNPs (pga.gs.washington.edu) Web sites and forArabidopsis thali-anafrom http://walnut.usc.edu/2010. The annotated
pro-tein-coding genome ofA. thalianawas obtained from TAIR 8
(ftp://ftp.arabidopsis.org), and the annotated A. lyrata
ge-nome was obtained from JGI http://genome.jgi-psf.org/.
The annotated protein-coding genomes of Pan troglodytes,
Macaca mulatta, and Rattus norvegicuswere obtained from Ensembl (http://www.ensembl.org/info/data/ftp/index.html). The S. cerevisae genome chromosome III was obtained from http://www.yeastgenome.org. We restricted our analysis ofD. melanogasterto data from the Zimbabwe population, of theS. paradoxus data set to the European population, and of the human data set to African populations, since all of these rep-resent the ancestral populations of the three species (Garrigan
and Hammer 2006; Stephan and Li 2007; Liti et al.2009).
Qualitatively similar results were obtained in the three cases when using global data.
Preparation of the data
The analysis was performed using protein-coding sequences. Coding regions were assigned using protein-coding genomic
data or, if given, were taken from the GenBank input files.
Sequences were aligned using Clustalw, using default
parameter values (Thompson et al. 1994). The outgroup
ortholog was assigned using the best BLAST (Altschul
et al. 1990) hit or, if given, was taken from the polymor-phism data set. We used only polymorpolymor-phism data for which we could assign an outgroup sequence. For all analyses the number of synonymous substitutions and polymorphisms served as the neutral standard. For computational reasons all sites had to have been sampled in the same number of chromosomes within each species; because some loci had been sampled in more individuals than others and other loci had missing data, we reduced the data set to a common number of chromosomes by randomly sampling the poly-morphisms at each site without replacement. The numbers of synonymous and nonsynonymous sites and substitutions were estimated by randomly selecting one allele from the polymorphism data and comparing it against the outgroup using the F3x4 model implemented in PAML (Yang 1997) in which codon frequencies are estimated from the nucleotide
frequencies at the three codon positions. The proportion of sites estimated by PAML was also used to compute the numbers of synonymous and nonsynonymous sites for the
polymor-phism data. Although how we choose to define a site can be
important in some circumstances (Bierne and Eyre-Walker 2003), this is not likely to be a problem in the current
con-text because we use the same definition for both the
di-vergence and the polymorphism data; as such, the number of sites effectively cancels out in most of our analyses (however, see discussion of selection on synonymous co-don bias below). Statistics concerning numbers of loci and numbers of sites as well as polymorphic sites are shown in Table 1.
Testing for variation in diversity and the effective population size
We investigated whether there was significant variation in
the level of diversity across the genome, using two tests. If we assume there is free recombination within and between loci (or no recombination within and between loci), then variation in diversity can be tested using a simple (2·k)x2
-test of independence across the kloci within each species,
where for each locus we have the number of sites with a polymorphism and the number of sites without a polymor-phism. Note that this test is valid only when the same num-bers of chromosomes have been sampled across all loci. However, some of the variation in diversity between loci might be due to variation in the genealogy if there is limited or no recombination between loci. We therefore applied a variant of the classic HKA test, but we removed the diver-gence information from the test. The test statisticX2is set up as
X2¼
PM i¼1ðPi2
^EðPiÞÞ2
^VarðPiÞ ; (1)
whereE^ðPiÞandVar^ ðPiÞare the expected value and variance
of the number of segregating polymorphisms,P, in genei,
^
EðPiÞ ¼Liu
Xn21
j¼1
1=j (2)
^
VarðPiÞ ¼E^ðPiÞ þ ðLiuÞ2
Xn21
j¼1
1=j2 (3)
with n being the number of alleles, Mthe number of loci,
u= 4Nem, andLithe number of sites in genei. Estimates ofu
were obtained by minimizing the value ofX2.X2is expected
to be x2-distributed with (L21) d.f.
Any variation that we detect in diversity might be due to variation in the mutation rate or variation in the local effective population size. We therefore performed two further analyses to investigate whether there was variation in diversity that could not be explained by variation in the mutation rate, as measured by synonymous divergence
(2·k)x2-test of independence, performed as follows. For
each locus we have the number of sites used to estimate the level of silent site divergence (Ld), the estimated number of
substitutions (D), the number of sites used to estimate silent site diversity (Lp), and the number of sites with a
polymor-phism (P). SinceLdandLpcan be different, we reduced the
divergence or polymorphism data set, whichever was larger, to the size of the other, resampling without replacement the numbers of substitutions or polymorphisms as appropriate; for example, ifLdwas halfLp, we sampledLpsites from the
divergence data to generate a subsample of the substitutions (D9) overLd9¼Lpsites. We can then perform a (2·k)x2-test
where the cells for each gene are the number of sites with a substitution (D9) and the number of sites with a polymor-phism (P9). Note that the data set will be reduced using this method, resulting in a loss of power. Furthermore, this test is only approximate because we assume that the number of substitutions is binomially distributed, whereas in fact it has a more complex distribution because of the correction for multiple hits. Some of the expected values can be very small in both x2-tests: we therefore checked the P-values
from the x2-tests by generating the null distribution for
the test. This was performed by randomly assigning poly-morphisms and substitutions across the contingency table preserving the marginal totals. We then recalculated the
statistic and performed this 1000 times. The P-value was
the proportion of such randomly generated values that exceeded the observed value. Generally we found that the
P-value from randomization and the P-value assuming our
test statistics were x2-distributed were similar (Supporting
Information, Table S1). We therefore present the results from the standardx2-test.
This test assumes free recombination between sites within loci and loci (or no recombination between sites and loci). A more conservative test is the classic HKA test that tests for heterogeneity in the ratio of diversity divided by divergence between loci assuming no recombination within loci, but free recombination between loci. We per-formed the multiple-locus HKA test using software provided by J. Hey (http://genfaculty.rutgers.edu/hey/software# HKA). To perform this test we had to exclude loci with zero divergence; for most species this constituted a small fraction of the total number of loci. However, we had to exclude
Sorghum bicolor from the analysis because too many loci showed zero divergence.
Recombination and density of selected sites
We obtained estimates of recombination rate variation along
chromosomes for A. thaliana(Singer et al.2006), D.
mela-nogaster (Hey and Kliman 2002), H. sapiens (Kong et al.
2002), andMus musculus(Dumontet al.2011). Gene
den-sity was estimated as the proportion of coding sites in win-dow sizes of 50 kb, 500 kb, and 5 Mb. Since results are qualitatively similar, we discuss only results for the window size of 500 kb. Conservation scores (Siepelet al.2005) were obtained from the UCSC genome browser (http://genome.
ucsc.edu/) forD. melanogasteracross 15 species,H. sapiens
across 17 species, andM. musculusacross 30 species.
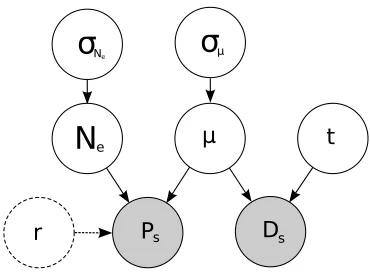
Bayesian analysis
To estimate the distribution of Ne we used a hierachical
Bayesian analysis in which we estimate the parameters of
the distribution of Ne (Figure S1). If we assume that the
population size is stationary, the expected number of
poly-morphisms segregating in a sample ofnsequences, P, and
the number of differences between the outgroup and a single sequence from the ingroup, Ds, are
Ps¼4mLpNe
Xn21
j¼1
1=j (4)
Ds¼2mtLd; (5)
where Lp and Ld are the numbers of sites that can have
a polymorphism or a substitution, respectively, mis the
nu-cleotide mutation rate per generation, andtis the time of
divergence. We are interested in the distribution of Ne. To
estimate this distribution we assume that Ne and m follow
a log-normal or a gamma distribution. Assuming free recom-bination and using Equations 4 and 5 above, we can write
the likelihood of observing ^Ps polymorphisms and D^s
substitutions,
L¼YXð^Ds;DsÞXð^Ps;PsÞMðNejsNeÞM
msm; (6)
whereX(S,S(x)) is the Poisson distribution andMðNejsNeÞ
is the probability density of the distribution of Ne, and
M(m|sm) is the probability density of the distribution of
the mutation rate; these distributions are parameterized such that the mean isfixed at unity, leaving us to estimate the shape parameter. If there is no recombination within a locus, then we can rewrite Equation 4 as
Ps¼4tmLpNe
Xn21
j¼1
1=j (7)
where t is the length of the genealogy scaled such that
E[t] = 1. We can rewrite Equation 6, and the likelihood
then becomes
L¼YXð^Ds;DsÞXð^Ps;PsÞMðNejsNeÞM
msmMðtjnÞ: (8)
To calculate the probability density distributionM(t|n) of genealogy lengths we randomly simulated 10,000 gene-alogies, scaling them such that the average total length was unity. In theory it is possible to accommodate ancestral poly-morphism into the method; however, we found that the method rarely gave stable estimates of sNe, particularly in
the no recombination model. We therefore concentrated on
data sets in which the influence of ancestral polymorphism
divergence was more thanfive times the average ofuW
(Ta-ble 1). If we assume that the ancestral Ne of a locus is
correlated to the currentNe, we expect ancestral
polymor-phism to decrease the apparent variation inNe.
To estimate the posterior distribution of the parameters
sNe and sm we used a Monte Carlo Markov chain running
the Metropolis–Hastings algorithm (Hastings 1970).
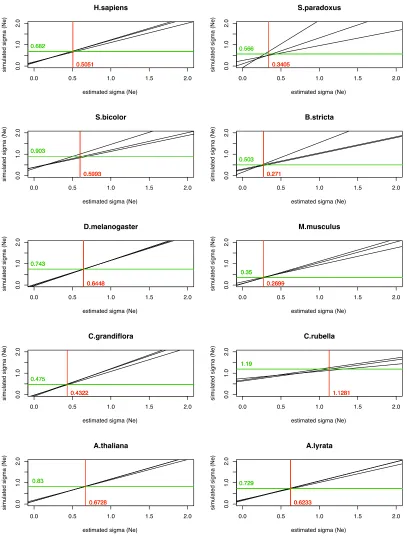
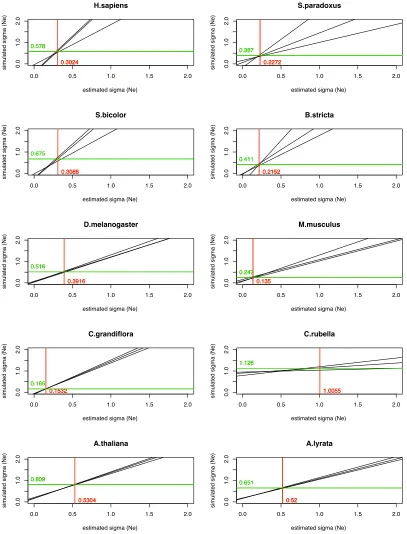
Unfor-tunately because we have very few synonymous polymor-phisms per gene, this method tends to underestimate the true value of sNe. For most data sets this underestimation
is small, but it can be large. We therefore estimated the extent of bias by simulating data under a range of parameter values, using the actual numbers of sites from the real data such that the expected numbers of polymorphisms and sub-stitutions were equal to the mean values. For example, if we estimatedsNeto be 0.5 andsmto be 0.1, we simulated data
forsm-values of 0.1, 0.2, and 0.3 and forsNe-values between
0.4 and 1.0 in steps of 0.05. For each simulated data set we
estimated sNe and using linear regression we inferred the
relationship betweensNe (estimated) andsNe (true). Using
this relationship we inferred the true value ofsNe from the
value estimated from the real data (Figure S2and Figure
S3). To obtain a corrected SE we multiplied the observed standard error by the ratio of the corrected estimate of sNe
divided by the observed estimate of sNe. This slightly
under-estimates the true SE since we have not taken into account the small amount of error associated with estimating the regres-sion line. To test for heterogeneity insNe between species we
assumed that the estimate of sNe was normally distributed;
under this assumptionðsNe2sN eÞ 2
=varðsNeÞisx
2-distributed
withk21 d.f. forkspecies.sN e was calculated as a weighted
average, where the weights were inversely proportional to the variance of the estimate (Eyre-Walker 1996).
Variation of efficiency of selection
We tested whether the strength of selection on nonsynon-ymous mutations was correlated to the effective population size, which can be seen as testing whether the fraction of
deleterious mutations varies with Ne. This can be done by
considering the correlation of Pn/PsandusorPn/PsandNe
(=us/(4m)), wherePnandPsare the numbers of
nonsynon-ymous and synonnonsynon-ymous mutations, respectively, andNe
val-ues are point estimates from the genetic diversity and
mutation rates taken from the literature. However, Ps and
usare not independent. We overcome this problem by
split-tingPsinto two independent values by generating a random
hypergeometric variable as follows:
Ps1¼HypergeometricðPs;Ls2Ps;0:5PsÞ (9)
Ps2¼Ps2Ps1 (10)
(Piganeau and Eyre-Walker 2009; Stoletzki and Eyre-Walker 2011). One of the Psvalues is used to estimate Pn/Ps (see
below) and the other one is used to estimate uS. There are
two further problems to consider with this method:first,Pn/
Ps can be an overestimate or an underestimate of the true
value of Pn/Ps and, second, the ratio Pn/Ps is undefined if
Ps= 0. Both of these problems can be overcome by
consid-ering the correlation betweencandus:
c¼ Pn
Psþ1
(11)
(Piganeau and Eyre-Walker 2009). Hence, using our method
to split Ps into independent values, we have two
indepen-dent pairs ofuSandc; we present results from only one pair.
Some of the data sets contain relatively little polymorphism, which results in substantial variance ofc. To overcome this problem we sum data across loci. For this we ranked loci
according to their neutral diversity obtained from us2 and
binned them into groups of sizen(e.g., 2, 4, 8, and 16). For
each group averageus2and correspondingNe2values were
calculated. Furthermore, for each group, the sums ofPnand Ps1 were calculated to calculate c1. Note that c2 can be
obtained in a similar manner; however, results were quali-tatively comparable and we therefore show only results for
c1vs.u2andNe2. Also we show only results for group size
4 because results for group sizes.2 were similar. The
cor-relations were performed by calculating Spearman’s rank
correlation and probabilities were combined using the
un-weightedZmethod (Whitlock 2005). For summary of
sym-bols seeFile S1.
Results
To investigate variation in the effective population size within genomes, we assembled protein-coding sequences from 10 species. The data sets are from 6 plant species, 3 animal species, and 1 fungus. The data sets range in size from 66 to 918 loci per species and from 8 to 40 sequences per gene (Table 1). In all analyses we assume that synony-mous mutations are neutral.
Variation of diversity and Newithin a genome using x2- and HKA tests
The level of genetic diversity appears to vary considerably within each genome (Figure 1); however, the number of polymorphisms per gene is generally quite low and hence this variation might be due to sampling error. To test whether the variation is significant we used two tests, which make different assumptions about the rate of recombination within loci: either free or no recombination. Both tests sug-gest that there is variation in the level of diversity in most species: all species are significant assuming free
recombina-tion and 6 of 10 are significant assuming no recombination
(Table 2). This variation in diversity between loci could be due to variation in the effective population size or to varia-tion in the mutavaria-tion rate. To investigate whether variavaria-tion in the mutation rate might be responsible, we estimated the
number of synonymous substitutions for each locus (DS),
In many species there is a significant positive correlation
between the numbers of synonymous substitutions ds and
polymorphisms ps per site (Table 3), suggesting that part
of the variation in diversity is due to variation in the muta-tion rate. However, if we test whether there is significant variation between loci, taking into account the mutation rate, as estimated from the divergence between species, us-ing either a x2-test of independence or the more
conserva-tive HKA test, then we find significant evidence in the
majority of species, whether or not we assume free or no recombination within loci: 9 of 10 loci for the free
recombi-nation test and 6 of 9 loci for the no recombirecombi-nation test (the
HKA test could not be performed on S. bicolor due to the
large number of genes in which the divergence was zero) (Table 2).
Correlates of Ne
The variation inNeacross the genome is likely to be due to
genetic hitchhiking and background selection. Both pro-cesses are expected to be stronger in regions of the genome with low rates of recombination and a high density of sites subject to natural selection. To investigate which or whether Table 1 Summary of data sets used for the analyses
Species Outgroup Loci Sites Alleles us ds Data set
Drosophila melanogaster D. simulans 302 40,920 8 0.019 0.13 Shapiroet al.(2007) Homo sapiens Macaca mulatta 434 170,441 32 0.001 0.08 EGP/PGAa
Mus musculus castaneus Rattus norvegicus 66 5,127 20 0.010 0.21 Halliganet al.(2010) Arabidopsis thaliana A. lyrata 918 64,927 24 0.008 0.14 Nordborget al.(2005) Capsella grandiflora Neslia paniculata 251 31,273 8 0.019 0.16 Slotteet al.(2010) Sorghum bicolor S. propinquum 134 6,799 14 0.004 0.02 Hamblinet al.(2006)
Boechera stricta A. thaliana 129 10,048 40 0.003 0.21 Songet al.(2009); Gossmannet al.(2010) Arabidopsis lyrata A. thaliana 66 5,260 24 0.018 0.15 Ross-Ibarraet al.(2008); Foxeet al.(2008) Capsella rubella A. thaliana 49 5,014 16 0.004 0.29 Foxeet al.(2009); Guoet al.(2009) Saccharomyces paradoxus S. cerevisiae 94 28,019 8 0.002 0.36 Tsaiet al.(2008)
Number of synonymous sites (Sites) and nucleotide diversity (us) are from the polymorphism data.ds, average divergence between the species pairs at silent sites.
aEGP,http://egp.gs.washington.edu; and PGA,http://pga.gs.washington.edu, August 2010.
either of these factors is responsible for the variation in
Ne, we investigated whether the variation in Newas
corre-lated to the rate of recombination and density of selected sites in four species for which these data were available:
D. melanogaster, human, mouse, andA. thaliana. We mea-sured the density of selected sites as either the number of nucleotides in annotated exons (genic density) or the num-ber of nucleotides in conserved regions (conserved site den-sity), as annotated in the UCSC conservation track, in windows of size 50 kb, 500 kb, and 5 Mb, where the window is centered on the gene from which the polymorphism data were taken (there is no conservation track forA. thaliana, so in this species we investigated just the density of genic sites). Results for the different window sizes were generally consistent, so we present the results from the 500-kb
win-dow size. We estimated Neas the synonymous diversity
di-vided by synonymous divergence.
InD. melanogasterwefind, as others have done, that our estimate ofNeis positively correlated to recombination rate
(Spearman’s correlation coefficientr= 0.45,P,0.01). It is, however, also positively correlated to the density of
con-served sites (r = 0.24, P , 0.01), which is unexpected,
although not genic sites (r= 0.03,P= 0.65). The positive correlation with conserved site density might be due to the positive correlation that exists between the density of
con-served sites and the rate of recombination (r= 0.56, P,
0.01), and indeed if we perform a multiple regression, we
find that the correlation betweenNeand the density of
con-served sites disappears (P= 0.74), while the positive
corre-lation between Ne and recombination rate remains (P ,
0.01).
In humans we find, as others have done, that both
diversity (r= 0.14,P= 0.02) and divergence (r= 0.18,P,
0.01) are positively correlated to the rate of recombination
(Lercher and Hurst 2002; Hellmannet al.2005), and there
is, as a consequence, no correlation between estimates ofNe
and the rate of recombination (r= 0.026,P= 0.69).Neis
significantly negatively correlated to the density of genic sites (r=20.19,P ,0.01), but not conserved sites (r=
20.085,P= 0.17). Using multiple regression does not alter
this picture: Ne is correlated only to the density of genic
sites.
In mouse we see no significant correlations between
estimates of Ne and the rate of recombination (r= 0.054,
P= 0.72) and the density of genic (r= 0.089,P= 0.53) or
conserved sites (r= 0.093, P = 0.51). This picture is
un-affected by the use of multiple regression.
InA. thalianawe see a pattern like that in humans: both diversity (r= 0.10,P= 0.04) and to a lesser extent
diver-gence (r = 0.064, P = 0.11) are positively correlated to
recombination rate, andNeis positively but not significantly
correlated to recombination rate (r= 0.080, P= 0.11).Ne
is significantly negatively correlated to genic density (r=
20.11,P= 0.02). Unfortunately there are no data on
con-served sites in this species.
Quantifying variation of Ne
Since we find evidence for variation inNe in many of our
species, we attempted to quantify the amount of variation using a hierarchical Bayesian model. We assume underlying distributions for Ne and m (e.g., log-normal distributions)
and estimate the shape parameters sNe and smand hence
the variances of these distributions; the mean of each Table 2 Results of thex2-tests of independence and HKA tests
Diversity Diversity and divergence
Species P-value (x2) P-value (HKA) P-value (x2) P-value (HKA)
D. melanogaster ,1·1023 0.015 ,1·1023 ,1·1023
H. sapiens ,1·1023 ,1·1023 ,1·1023 ,1·1023
M. castaneus ,1·1023 0.432* 0.066* 0.429*
A. thaliana ,1·1023 ,1·1023 ,1·1023 ,1·1023
C. grandiflora ,1·1023 0.462* ,1·1023 0.565*
S. bicolor ,1·1023 ,1·1023 5.3·1023 NA
B. stricta ,1·1023 0.434* 6·1023 0.01
A. lyrata ,1·1023 5.4·1023 ,1·1023 2.3·1023
C. rubella ,1·1023 ,1·1023 ,1·1023 ,1·1023
S. paradoxus 1.9·1023 0.94* ,1·1023 0.35*
Results of thex2-tests of independence and HKA tests for diversity and diversity/divergence data are shown. For details seeMaterials and Methods.
P-values are given for each species.*P.0.05 (not significant).
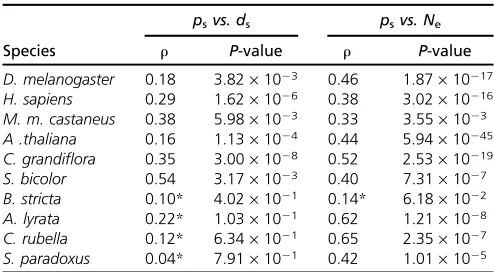
Table 3 Results of correlates ofPs
psvs. ds psvs. Ne
Species r P-value r P-value
D. melanogaster 0.18 3.82·1023 0.46 1.87·10217
H. sapiens 0.29 1.62·1026 0.38 3.02·10216
M. m. castaneus 0.38 5.98·1023 0.33 3.55·1023
A .thaliana 0.16 1.13·1024 0.44 5.94·10245
C. grandiflora 0.35 3.00·1028 0.52 2.53·10219
S. bicolor 0.54 3.17·1023 0.40 7.31·1027
B. stricta 0.10* 4.02·1021 0.14* 6.18·1022
A. lyrata 0.22* 1.03·1021 0.62 1.21·1028
C. rubella 0.12* 6.34·1021 0.65 2.35·1027
S. paradoxus 0.04* 7.91·1021 0.42 1.01·1025 Results of Spearman’s rank correlates ofpsare shown.The nonindependence ofps andNeis taken into account by splitting the data set into independent halves (see
distribution is constrained to be equal to one (seeMaterials and Methods). We investigate two different models: in the
first we assume free recombination and in the second we
assume no recombination within loci, but free recombination between loci. These two models are likely to set the upper and lower bounds on the true level of variation inNe. Under
the free recombination model all the variation in diversity is attributed to variation inNe, variation in the mutation rate,
and sampling error. In the model with no recombination, variation in diversity may additionally be due to variation in the coalescent process. Hence, the free recombination
model gives an upper estimate on the variation in Ne and
the no recombination model gives a lower bound.
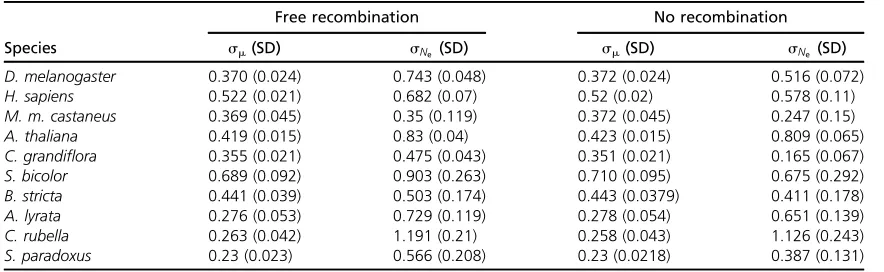
We applied our method to the polymorphism data from each of the 10 eukaryotic species to estimate the variation of
Newithin each genome along with the variation in the
mu-tation rate,sm(Table 4). As expected, in all cases the
esti-mate ofsNe is larger when free recombination is assumed,
but the estimates from the two models are highly correlated (r= 0.95). The estimate ofsmis unaffected by the model of
recombination assumed. Wefind evidence that the value of
sNe varies between species for both the free and the no
re-combination models (P= 2.5·1029andP= 4.2·1028,
respectively). Wefind that the level of variation ofNeis the
lowest for M. musculusand highest forCapsella rubella for
both recombination models. The estimates of sNe and sm
were of similar magnitude for each taxon, suggesting that overall variation in the mutation rate and variation in the effective population size contribute a similar amount to the variation in diversity.
The level of variation inNewe estimate using our method
is quite modest. For example, C. rubella has the highest
estimate of sNe, but under this distribution the genes in
the 90th percentile have anNethat is only 7.2-fold greater
than that of those in the 10th percentile;i.e., 80% of genes have an effective population size within 7.2-fold of each
other. Four species have estimates of sNe , 0.6, meaning
that the difference between the 90th and the 10th percentile is ,4-fold.
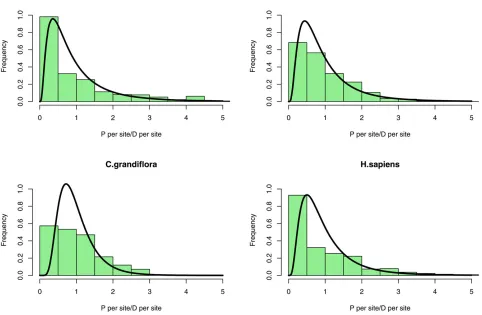
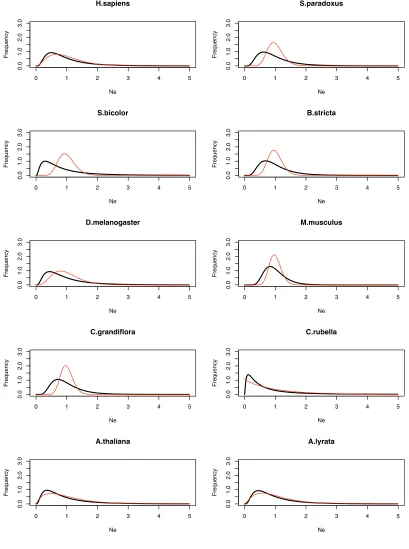
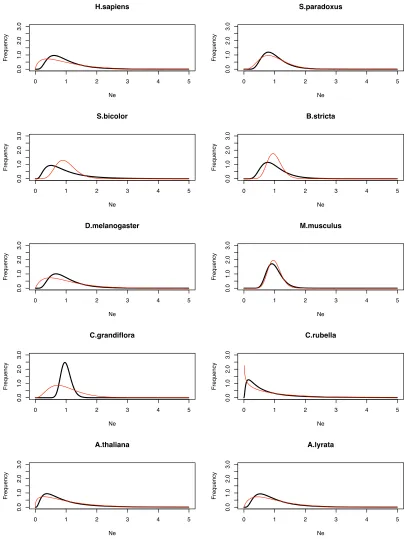
The estimated distribution appears to fit the data
reasonably well (Figure 2). We would not expect thefit to
be perfect, particularly at the lower end of the distribution, since this is where sampling error is a major issue;e.g., many genes have no polymorphism because of sampling error, not because they have an effective population size of zero. It is possible that assuming a log-normal distribution places some unwanted constraints on the estimation procedure; in particular, the probability density tends to zero for low
Ne.We therefore alsofitted a gamma distribution to the data
(Table S3); with this distribution the probability density does not necessarily decline to zero near the origin. How-ever, the estimated distributions are very similar to those obtained assuming a log-normal distribution (Figure S4 and Figure S5). The species that show low variation inNe
are also those that tend to show little evidence of variation inNe, as judged by thex2- and HKA tests. This implies that
failure to detect variation in Ne is largely because there is
limited variation inNerather issues with statistical power.
Variation in the efficiency of selection
Although we estimate the variation in the effective popula-tion size to be modest, it is of interest to investigate whether this translates into significant differences in the efficiency of natural selection across the genome. To investigate
this we tested whether there was a correlation betweenc=
Pn/(Ps+ 1) and eitherusorNefor each locus in a manner
that controls for the obvious nonindependence of the two
variables (see Materials and Methods). We remove the
non-independence by splittingPsinto two independent parts and
we usecbecause it reduces the bias inherent in the estima-tion ofPn/Ps; furthermore it allowsPn/Psto be calculated for
all genes (Piganeau and Eyre-Walker 2009). This test is not very powerful sincechas a large variance; furthermore, it is statistically biased in a manner that tends to generate a pos-itive correlation betweencandusorNe. We therefore follow
the approach suggested by Piganeau and Eyre-Walker
(2009) and grouped genes according to theiruorNevalue.
The results are qualitatively similar for groupings of 4, 8, Table 4 Estimates of the variation ofNein 10 eukaryotic species
Free recombination No recombination
Species sm(SD) sNe (SD) sm(SD) sNe (SD)
D. melanogaster 0.370 (0.024) 0.743 (0.048) 0.372 (0.024) 0.516 (0.072) H. sapiens 0.522 (0.021) 0.682 (0.07) 0.52 (0.02) 0.578 (0.11) M. m. castaneus 0.369 (0.045) 0.35 (0.119) 0.372 (0.045) 0.247 (0.15) A. thaliana 0.419 (0.015) 0.83 (0.04) 0.423 (0.015) 0.809 (0.065) C. grandiflora 0.355 (0.021) 0.475 (0.043) 0.351 (0.021) 0.165 (0.067) S. bicolor 0.689 (0.092) 0.903 (0.263) 0.710 (0.095) 0.675 (0.292) B. stricta 0.441 (0.039) 0.503 (0.174) 0.443 (0.0379) 0.411 (0.178) A. lyrata 0.276 (0.053) 0.729 (0.119) 0.278 (0.054) 0.651 (0.139) C. rubella 0.263 (0.042) 1.191 (0.21) 0.258 (0.043) 1.126 (0.243) S. paradoxus 0.23 (0.023) 0.566 (0.208) 0.23 (0.0218) 0.387 (0.131)
and 16 genes, so we present the results for groups of 4. There is a significant negative correlation between bothus
and c and Ne and c in A. lyrata and C. grandiflora, and
a marginally significant correlation between c and us in
D. melanogaster, although only the correlations in Cryptoste-gia grandiflora are significant after correction for multiple tests; otherwise the correlations are generally weak and nonsignificant. However, overall wefind significant evidence
for a negative correlation between c and us or Ne if we
combine probabilities: between c and us P = 0.043 and
betweencandNeP= 0.021.
The relationship betweencandNecan potentially yield
information about the distribution of fitness effects (DFE)
(Loewe and Charlesworth 2006; Loeweet al.2006; Woolfit
2006; Elyashiv et al.2010). If we assume that the DFE for
nonsynonymous mutations is a gamma distribution and that synonymous mutations are neutral, thenPn/Psis expected to
be proportional toNe2b, wherebis the shape parameter of the
gamma distribution (Welch et al.2008). Hence we can
esti-matebby considering the slope of the regression line between log(c) and log(Ne). Since the log of zero is undefined, we
grouped genes in groups of size n such that no group had
a zero estimate of c orNe. We attempted to estimate bin
the species that individually showed a significant correlation
betweencandNe. However, we could not perform the
anal-ysis of A. lyrata because the diversity is so low that it was impossible to define groups that did not have zero values for bothcandNe. The estimates ofbusing this method are 0.41
(SE = 0.15) in C. grandifloraand 0.23 (0.15) in D.
mela-nogaster; these are similar to those obtained using an inde-pendent method that uses the site frequency spectrum
(Keightley and Eyre-Walker 2007): 0.27 (0.08) forC.
gran-difloraand 0.29 (0.07) forD. melanogaster(Table S2). This suggests that the gamma distribution is a reasonable approx-imation to the DFE, at least for mutations of weak effect.
Discussion
The effective population size (Ne) is one of the most
impor-tant parameters in population genetics and evolutionary biology. It has been shown thatNevaries across the genome
ofD. melanogasterand some plant species, and it is thought that it might vary across the human genome (Hellmann
et al. 2005). Here we have shown that it varies in most species that we have considered. However, the variation inNeis not consistently correlated to either the rate of
re-combination or the density of selected sites. This might in
part be because the variation in Ne is quite limited: most
genes in a genome have an Nethat is within a few fold of
sufficient to cause differences in the effectiveness of natural selection on segregating nonsynonymous polymorphisms.
There are a number of factors that might have led us to over- or underestimate the variation in Ne. First, we have
assumed that there is either free recombination or no re-combination within loci to estimate the variation in the ef-fective population size. This is unsatisfactory since we know that recombination is one of the factors that generates var-iation in the effective population size, at least in species like
Drosophila, in which there is a correlation between diversity and the rate of recombination. Unfortunately it is not easy to get around this problem. However, as we have noted earlier, the estimate assuming free recombination should give an upper estimate on the amount of variation, because under this method all variation in the diversity is assumed to arise from sampling error and variation in the mutation rate and
Ne. In reality, some of the variation between genes is a
con-sequence of variation in the length of the genealogy in genes with little or no recombination.
Second, we have used the divergence between species as an estimate of the mutation rate, but if the mutation rate at a locus changes through time, for which there is evidence
(Aguileta et al.2006; Hodgkinson and Eyre-Walker 2011),
then we will tend to overestimate the variation inNe: this is
most easily seen by assuming there is variation in the mu-tation rate, but no variation in Ne; if the mutation rate has
changed through time, then the divergence will not be a per-fect measure of the recent mutation rate and there will ap-pear to be variation inNe.
Third, we have assumed that synonymous mutations are neutral, but there is evidence of selection in humans (Iida and Akashi 2000) and other species (Duret 2002; Pond and Muse 2005); although it is clear that selection has acted
upon synonymous mutations in the past inD. melanogaster,
the evidence of selection currently acting is contradictory (Akashi 1996; McVean and Vieira 2001; Zeng and Charles-worth 2010) and biased gene conversion may be acting
(Galtier et al. 2006; Zeng and Charlesworth 2010). Most
of the other species we have analyzed have not been inves-tigated in any detail. We need to consider two models. In the first model, let us assume that there is no variation in
Nebut that there is variation in the strength of selection on
synonymous codons. Such a model would generate apparent variation inNewith the genes subject to the strongest
selec-tion apparently having the highest Ne, because negative
selection affects divergence to a greater extent than poly-morphism (Kimura 1983). However, this would lead to the regions of the genome with the lowest diversity apparently having the highest effective population size. This is clearly
not the case. If we split Ps into two independent samples,
using a hypergeometric distribution, then wefind a positive correlation between our estimate ofNeandPs(Table 3). In
the second model, let us imagine that there is variation in
Neand variation in the strength of selection on codon usage
bias, but that they are uncorrelated to each other. In this case selection on codon usage bias will tend to generate an
overestimate of the variation inNe: asNeincreases, selection
becomes more effective, but this reduces the divergence more than the level of polymorphism, yielding a higher ap-parent effective population size. So genes in regions of high
Ne will tend to have an exaggeratedNe. There is also
an-other effect that needs to be considered. We have estimated the level of synonymous divergence using the method of Goldman and Yang (1994; Yang and Nielsen 1998), which assumes that codon bias is due to mutation bias; however, this method will tend to overestimate the synonymous sub-stitution rate if codon bias is due to selection, because it will incorrectly infer that genes with high bias have a small num-ber of synonymous sites and hence a relatively large numnum-ber of substitutions (Bierne and Eyre-Walker 2003; Yang 2006). As a consequence, the divergence in high-biased genes will be overestimated, but at the same time the mutation rate will tend to be underestimated because of the action of selection. These two factors may cancel each other out.
Fourth, we have applied our method only to protein-coding sequences, so we are estimating the variation in the effective population size that applies to the proteome. There might be further variation inNein regions that are relatively
devoid of protein-coding sequences, such as heterochroma-tin. Whether this is important depends on whether there are functional sequences within these regions. We have also considered genes only on the autosomes and occasionally
the homogametic sex chromosome (14 loci in H. sapiens).
We have not considered genes on the heterogametic sex chromosome, which often appear to have much lower effec-tive population sizes. However, the heterogametic sex chro-mosome usually has very few genes (Graves 2006).
Fifth, in estimating the variation inNewe have assumed
that there is either free recombination or no recombination and the population size has been stationary. Variation in population size can generate variation in diversity between loci, which may for example be mistaken for the signature of
genetic hitchhiking (Tajima 1989; Pluzhnikov et al.2002).
In principle we could take this into account by estimating a demographic model from the polymorphism data while simultaneously estimating the variation in Ne. This is diffi
-cult and is beyond the scope of the current work.
Finally, we have not taken into account ancestral poly-morphism within our method. Ignoring ancestral
polymor-phism will lead us to underestimate the variation in Ne
because loci with large Ne will tend to have higher
diver-gences than loci with smallNeand this will appear as though
these loci have higher mutation rates; variation in Ne will
therefore be underestimated because the mutation rate has been overestimated. In principle it is possible to include ancestral polymorphism within the method, but we observe a lack of convergence, probably because the number of poly-morphisms for each gene was so low. However, we have chosen data sets in which divergence is generally consider-ably larger than diversity; for example, we chose macaque as
to generate variation in the divergence between human and
chimpanzee (McVickeret al.2009).
Despitefinding variation inNein many of the species we
tested, wefind no consistent evidence thatNeis correlated
to either the rate of recombination or the density of selected sites, the two factors that we would have expected variation inNeto depend upon. This is probably in part due to the fact
that we are using synonymous diversity; as such, our esti-mates of diversity are subject to considerable error. The lack
of a strong correlation between recombination rate andNe
may also be due to the fact that the genetic maps in A.
thaliana and mouse are relatively crude. Furthermore, for
our mouse species we are using an F2genetic linkage map
constructed from intercrosses betweenM. m. domesticusand
M. m. castaneusto infer recombination rates forM. m. cas-taneus. In humans it has previously been shown that diver-sity over divergence is correlated positively to recombination rate (Hellmann et al.2005) and thatdn/dsis correlated to
gene density (Bullaughey et al.2008). In contrast to
Hell-mannet al.(2005), we do notfind a significant correlation
betweenNeand recombination rate, but they used long
non-coding sequences to investigate diversity over divergence; their estimates were therefore subject to much less error than ours. It is surprising that there is a correlation between genic density but not conserved site density in humans. This might be due to the fact that there is approximately twice as much variation in genic density as in conserved site density (coefficient of variation: 0.79vs.0.30). It might also be due to differences in the DFE between the two types of sites: back-ground selection is most effective when the strength of selec-tion acting upon deleterious mutaselec-tions is similar in magnitude to the rate of recombination (Nordborget al.1996).
In contrast, genetic hitchhiking depends upon the rate of advantageous mutation and sequences undergoing consider-able adaptive evolution may not appear as conserved. The
correlation between Ne and the density of genic sites may
therefore suggest that hitchhiking is more important in gen-erating variation inNethan background selection. The lack
of a correlation betweenNeand the density of selected sites
inDrosophila, once correlations to the rate of recombination
have been taken into account, may reflect the fact that the variation inNeis generated by genetic hitchhiking and a lot
of adaptive evolution goes on outside coding sequences (Andolfatto 2005).
Across species wefind evidence that variation inNeleads
to variation in the effectiveness of natural selection on non-synonymous mutations across the genome (Table 5). How-ever, this is individually significant for just two genomes:C. grandiflora and A. lyrata. A lack of a correlation in other genomes may be due to the fact that we have little power to detect the correlation since (i) some of the data sets are quite small, (ii) there is limited variation in Ne, and (iii) in
most of these species the DFE is very leptokurtic. The kur-tosis of the DFE is such that changes in effective population size do not greatly change the proportion of mutations that are effectively neutral. It can be shown that under a gamma DFE the proportion of effectively neutral mutations is
pro-portional to Ne2b (Ohta 1977; Kimura 1979, 1983; Welch
et al. 2008). Since b-values are typically between 0.1 and 0.3 in most species (Table S2), changes inNetend to cause
small changes in the proportion of effectively neutral muta-tions; for example, a 10-fold increase in effective population size will reduce the proportion of effectively neutral
muta-tions by only 37% ifb= 0.2. Wefind no evidence of a
sig-nificant negative correlation betweencand eitheruSorNe
in humans, in agreement with the work of Bullaugheyet al.
(2008). They found no evidence that the ratio of the non-synonymous (dN) to the synonymous (dS) substitution rate
between human, chimpanzee, and macaque was correlated to the rate of recombination.
We find evidence that the amount of variation in Ne
varies between species; however, there are no obvious cor-relates of this variation. Both plants and animals have spe-cies with high and low levels of variation. Surprisingly we
find no obvious effect of self-fertilization as suggested
by previous studies (Cutter and Payseur 2003; Roselius
et al. 2005). A. thaliana, C. rubella, and Boechera stricta
are all self-fertile with selfing rates of 0.95, 1, and 0.94,
respectively (Charlesworth and Vekemans 2005; Songet al.
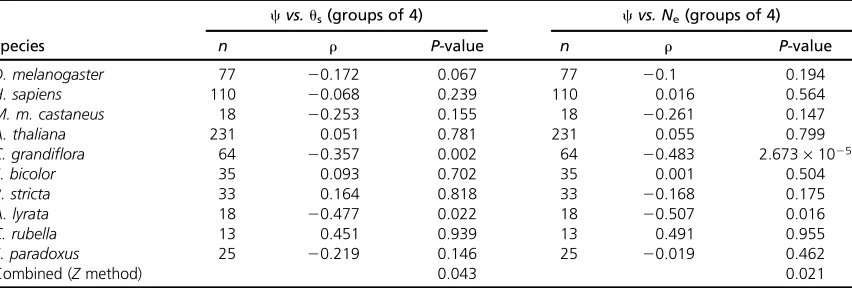
2006; Foxeet al.2009), whereas the closely related species Table 5 The correlation ofPn/(Ps11) =candusandNe, respectively, in 10 eukaryotic species
cvs.us(groups of 4) cvs. Ne(groups of 4)
Species n r P-value n r P-value
D. melanogaster 77 20.172 0.067 77 20.1 0.194
H. sapiens 110 20.068 0.239 110 0.016 0.564
M. m. castaneus 18 20.253 0.155 18 20.261 0.147
A. thaliana 231 0.051 0.781 231 0.055 0.799
C. grandiflora 64 20.357 0.002 64 20.483 2.673·1025
S. bicolor 35 0.093 0.702 35 0.001 0.504
B. stricta 33 0.164 0.818 33 20.168 0.175
A. lyrata 18 20.477 0.022 18 20.507 0.016
C. rubella 13 0.451 0.939 13 0.491 0.955
S. paradoxus 25 20.219 0.146 25 20.019 0.462
Combined (Zmethod) 0.043 0.021
A. lyrataandC. grandifloraare obligate outcrossing species. However, the variation inNeseems to be relatively low forC. grandifloraandB. strictaand similar for the twoArabidopsis
species. It also should be noted that the confidence intervals on the estimate ofNeinC. rubellaare very large and a
sub-stantial amount of variation is still shared betweenC. gran-difloraandC. rubellaso these estimates are not independent. Moreover, the lack of an effect for self-compatibility in our estimates ofNeforArabidopsismay be not surprising as
self-compatibility might evolved relatively recently inArabidopsis
(Bechsgaardet al.2006; Tanget al.2007). Furthermore, both
Arabidopsis species have high sequence diversity in
pericen-tromeric regions (Borevitz et al.2007; Kawabeet al. 2008)
that is not caused by varying mutation rates. Therefore this
could be a major determinant of variation in Ne in those
species and interfere with the effects of the breeding system. Although the variation we observe in the effective population size appears to be modest, it does appear to influence both the level of neutral genetic diversity and the effectiveness of selection. This potentially has important implications. If slightly deleterious mutations contribute substantially to phenotypic traits, then variation in the effective population size may affect where the genetic variation underlying fitness and other traits is distributed.
For example, Rockman et al. (2010) have recently shown
that expression QTL (eQTL) tend to be present in regions of theCaenorhabditis elegansgenome with the highest rates of
recombination and lowest density of genes, where Ne is
expected to be largest. However, population genetic theory also suggests that such weakly selected mutations are un-likely to contribute much to the overall genetic variance in
fitness unless the proportion of mutations under such weak
selection is large (Eyre-Walker 2010). Variation in the effec-tive population might also affect the rate of adapeffec-tive evolution, as appears to be the case inDrosophila(Betancourt and Pre-sgraves 2002). Advantageous mutations can potentially come from three sources. They can be generatedde novo, in which case we expect regions of the genome with largeNeto adapt
faster because the number of chromosomes an advanta-geous mutation can occur in is larger, and selection will be more effective on a greater proportion of the advantageous mutations. Advantageous mutations can also arise from standing genetic variation (Pritchard and Rienzo 2010;
Pritchard et al. 2010). If these mutations were previously
strongly deleterious, the genetic variation is not expected
to depend uponNe, unless the mutations are highly
reces-sive. If, however, the advantageous mutations were previ-ously neutral or weakly selected, regions of the genome with
high Ne are expected to have more genetic variation and
hence adapt more rapidly.
Acknowledgments
We are grateful to several anonymous referees for
com-ments. T.I.G. was financially supported by the John
May-nard Smith studentship.
Literature Cited
Aguileta, G., J. P. Bielawski, and Z. Yang, 2006 Evolutionary rate variation among vertebrate beta globin genes: implications for dating gene family duplication events. Gene 380: 21–29. Akashi, H., 1996 Molecular evolution between Drosophila
mela-nogaster andD. simulans: reduced codon bias, faster rates of
amino acid substitution, and larger proteins inD. melanogaster. Genetics 144: 1297–1307.
Altschul, S. F., W. Gish, W. Miller, E. W. Myers, and D. J. Lipman, 1990 Basic local alignment search tool. J. Mol. Biol. 215: 403–410. Andolfatto, P., 2005 Adaptive evolution of non-coding DNA in
Drosophila. Nature 437: 1149–1152.
Arguello, J. R., Y. Zhang, T. Kado, C. Fan, R. Zhao et al., 2010 Recombination yet inefficient selection along the Dro-sophila melanogaster subgroup’s fourth chromosome. Mol. Biol. Evol. 27: 848–861.
Bachtrog, D., and B. Charlesworth, 2002 Reduced adaptation of a non-recombining neo-Y chromosome. Nature 416: 323–326. Bechsgaard, J. S., V. Castric, D. Charlesworth, X. Vekemans, and M.
H. Schierup, 2006 The transition to self-compatibility in Ara-bidopsis thaliana and evolution within S-haplotypes over 10 Myr. Mol. Biol. Evol. 23: 1741–1750.
Begun, D. J., and C. F. Aquadro, 1992 Levels of naturally occur-ring DNA polymorphism correlate with recombination rates in D. melanogaster. Nature 356: 519–520.
Berlin, S., and H. Ellegren, 2006 Fast accumulation of nonsynon-ymous mutations on the female-specific W chromosome in birds. J. Mol. Evol. 62: 66–72.
Betancourt, A. J., and D. C. Presgraves, 2002 Linkage limits the power of natural selection in Drosophila. Proc. Natl. Acad. Sci. USA 99: 13616–13620.
Betancourt, A. J., J. J. Welch, and B. Charlesworth, 2009 Reduced effectiveness of selection caused by a lack of recombination. Curr. Biol. 19: 655–660.
Bierne, N., and A. Eyre-Walker, 2003 The problem of counting sites in the estimation of the synonymous and nonsynonymous substitution rates: implications for the correlation between the synonymous substitution rate and codon usage bias. Genetics 165: 1587–1597.
Borevitz, J. O., S. P. Hazen, T. P. Michael, G. P. Morris, I. R. Baxter
et al., 2007 Genome-wide patterns of single-feature
polymor-phism in Arabidopsis thaliana. Proc. Natl. Acad. Sci. USA 104: 12057–12062.
Bullaughey, K., M. Przeworski, and G. Coop, 2008 No effect of recombination on the efficacy of natural selection in primates. Genome Res. 18: 544–554.
Charlesworth, B., 2009 Fundamental concepts in genetics: effec-tive population size and patterns of molecular evolution and variation. Nat. Rev. Genet. 10: 195–205.
Charlesworth, B., M. T. Morgan, and D. Charlesworth, 1993 The effect of deleterious mutations on neutral molecular variation. Genetics 134: 1289–1303.
Charlesworth, D., and X. Vekemans, 2005 How and when did Arabidopsis thaliana become highly self-fertilising. BioEssays 27: 472–476.
Cutter, A. D., and B. A. Payseur, 2003 Selection at linked sites in the partial selfer Caenorhabditis elegans. Mol. Biol. Evol. 20: 665–673.
Dumont, B. L., M. A. White, B. Steffy, T. Wiltshire, and B. A. Payseur, 2011 Extensive recombination rate variation in the house mouse species complex inferred from genetic linkage maps. Ge-nome Res. 21: 114–125.
Duret, L., 2002 Evolution of synonymous codon usage in meta-zoans. Curr. Opin. Genet. Dev. 12: 640–649.
Elyashiv, E., K. Bullaughey, S. Sattath, Y. Rinott, M. Przeworski
analysis of genome-wide polymorphism data from two closely related yeast species. Genome Res. 20: 1558–1573.
Eyre-Walker, A., 1996 Synonymous codon bias is related to gene length in Escherichia coli: Selection for translational accuracy? Mol. Biol. Evol. 13: 864–872.
Eyre-Walker, A., 2010 Evolution in health and medicine Sackler colloquium: Genetic architecture of a complex trait and its im-plications forfitness and genome-wide association studies. Proc. Natl. Acad. Sci. USA 107(Suppl. 1): 1752–1756.
Filatov, D. A., V. Laporte, C. Vitte, and D. Charlesworth, 2001 DNA diversity in sex-linked and autosomal genes of the plant species Silene latifolia and Silene dioica. Mol. Biol. Evol. 18: 1442–1454.
Foxe, J. P., V.-u.-N. Dar, H. Zheng, M. Nordborg, B. S. Gautet al., 2008 Selection on amino acid substitutions in Arabidopsis. Mol. Biol. Evol. 25: 1375–1383.
Foxe, J. P., T. Slotte, E. A. Stahl, B. Neuffer, H. Hurka et al., 2009 Recent speciation associated with the evolution of self-ing in Capsella. Proc. Natl. Acad. Sci. USA 106: 5241–5245. Galtier, N., E. Bazin, and N. Bierne, 2006 GC-biased segregation
of noncoding polymorphisms in Drosophila. Genetics 172: 221– 228.
Garrigan, D., and M. F. Hammer, 2006 Reconstructing human origins in the genomic era. Nat. Rev. Genet. 7: 669–680. Goldman, N., and Z. Yang, 1994 A codon-based model of
nucle-otide substitution for protein-coding dna sequences. Mol. Biol. Evol. 11: 725–736.
Gossmann, T. I., B.-H. Song, A. J. Windsor, T. Mitchell-Olds, C. J. Dixonet al., 2010 Genome wide analyses reveal little evidence for adaptive evolution in many plant species. Mol. Biol. Evol. 27: 1822–1832.
Graves, J. A. M., 2006 Sex chromosome specialization and degen-eration in mammals. Cell 124: 901–914.
Guo, Y.-L., J. S. Bechsgaard, T. Slotte, B. Neuffer, M. Lascouxet al., 2009 Recent speciation ofCapsella rubellafromCapsella gran-diflora, associated with loss of self-incompatibility and an ex-treme bottleneck. Proc. Natl. Acad. Sci. USA 106: 5246–5251. Halligan, D. L., F. Oliver, A. Eyre-Walker, B. Harr, and P. D.
Keight-ley, 2010 Evidence for pervasive adaptive protein evolution in wild mice. PLoS Genet. 6: e1000825.
Hamblin, M. T., A. M. Casa, H. Sun, S. C. Murray, A. H. Paterson
et al., 2006 Challenges of detecting directional selection after
a bottleneck: lessons fromSorghum bicolor. Genetics 173: 953– 964.
Hastings, W. K., 1970 Monte Carlo sampling methods using Markov chains and their applications. Biometrika 57: 97–109.
Hellborg, L., and H. Ellegren, 2004 Low levels of nucleotide di-versity in mammalian Y chromosomes. Mol. Biol. Evol. 21: 158– 163.
Hellmann, I., I. Ebersberger, S. E. Ptak, S. Pääbo, and M. Przeworski, 2003 A neutral explanation for the correlation of diversity with recombination rates in humans. Am. J. Hum. Genet. 72: 1527– 1535.
Hellmann, I., K. Prüfer, H. Ji, M. C. Zody, S. Pääbo et al., 2005 Why do human diversity levels vary at a megabase scale? Genome Res. 15: 1222–1231.
Hey, J., and R. M. Kliman, 2002 Interactions between natural selection, recombination and gene density in the genes of Dro-sophila. Genetics 160: 595–608.
Hodgkinson, A., and A. Eyre-Walker, 2011 Variation in the mutation rate across the mammalian genome. Nat. Rev. Genet. 12: 756–766. Hudson, R. R., M. Kreitman, and M. Aguadé, 1987 A test of neu-tral molecular evolution based on nucleotide data. Genetics 116: 153–159.
Iida, K., and H. Akashi, 2000 A test of translational selection at
‘silent’sites in the human genome: base composition compari-sons in alternatively spliced genes. Gene 261: 93–105.
Ingvarsson, P. K., 2004 Population subdivision and the Hudson-Kreitman-Aguade test: testing for deviations from the neutral model in organelle genomes. Genet. Res. 83: 31–39.
Innan, H., 2006 Modified Hudson-Kreitman-Aguade test and two-dimensional evaluation of neutrality tests. Genetics 173: 1725– 1733.
Kawabe, A., A. Forrest, S. I. Wright, and D. Charlesworth, 2008 High DNA sequence diversity in pericentromeric genes of the plant Arabidopsis lyrata. Genetics 179: 985–995. Keightley, P. D., and A. Eyre-Walker, 2007 Joint inference of the
distribution offitness effects of deleterious mutations and pop-ulation demography based on nucleotide polymorphism fre-quencies. Genetics 177: 2251–2261.
Kimura, M., 1979 Model of effectively neutral mutations in which selective constraint is incorporated. Proc. Natl. Acad. Sci. USA 76: 3440–3444.
Kimura, M., 1983 The Neutral Theory of Molecular Evolution. Cam-bridge University Press, CamCam-bridge/London/New York. Kliman, R. M., and J. Hey, 2003 Hill-Robertson interference in
Drosophila melanogaster: reply to Marais, Mouchiroud and Du-ret. Genet. Res. 81: 89–90.
Kong, A., D. F. Gudbjartsson, J. Sainz, G. M. Jonsdottir, S. A. Gud-jonsson et al., 2002 A high-resolution recombination map of the human genome. Nat. Genet. 31: 241–247.
Larracuente, A. M., T. B. Sackton, A. J. Greenberg, A. Wong, N. D. Singh et al., 2008 Evolution of protein-coding genes in Dro-sophila. Trends Genet. 24: 114–123.
Lercher, M. J., and L. D. Hurst, 2002 Human SNP variability and mutation rate are higher in regions of high recombination. Trends Genet. 18: 337–340.
Liti, G., D. M. Carter, A. M. Moses, J. Warringer, L. Parts et al., 2009 Population genomics of domestic and wild yeasts. Na-ture 458: 337–341.
Loewe, L., and B. Charlesworth, 2006 Inferring the distribution of mutational effects onfitness in Drosophila. Biol. Lett. 2: 426–430. Loewe, L., B. Charlesworth, C. Bartolomé, and V. Nöel, 2006 Estimating selection on nonsynonymous mutations. Ge-netics 172: 1079–1092.
Machado, C. A., R. M. Kliman, J. A. Markert, and J. Hey, 2002 Inferring the history of speciation from multilocus DNA sequence data: the case of Drosophila pseudoobscura and close relatives. Mol. Biol. Evol. 19: 472–488.
Marais, G., D. Mouchiroud, and L. Duret, 2003 Neutral effect of recombination on base composition in Drosophila. Genet. Res. 81: 79–87.
McVean, G. A., and J. Vieira, 2001 Inferring parameters of muta-tion, selection and demography from patterns of synonymous site evolution in Drosophila. Genetics 157: 245–257.
McVicker, G., D. Gordon, C. Davis, and P. Green, 2009 Widespread genomic signatures of natural selection in hominid evolution. PLoS Genet. 5: e1000471.
Montell, H., A. K. Fridolfsson, and H. Ellegren, 2001 Contrasting levels of nucleotide diversity on the avian Z and W sex chromo-somes. Mol. Biol. Evol. 18: 2010–2016.
Moriyama, E. N., and J. R. Powell, 1996 Intraspecific nuclear DNA variation in Drosophila. Mol. Biol. Evol. 13: 261–277.
Nordborg, M., B. Charlesworth, and D. Charlesworth, 1996 The effect of recombination on background selection. Genet. Res. 67: 159–174.
Nordborg, M., T. T. Hu, Y. Ishino, J. Jhaveri, C. Toomajianet al., 2005 The pattern of polymorphism in Arabidopsis thaliana. PLoS Biol. 3: e196.