version 3.0
&RQWHQWV
Chapter 1 prairieFyre Contact Center Solutions suite
Features and benefits . . . 2
Licencing. . . 2
About the 6110 CCM User Guide. . . 2
User guide layout . . . 2
Chapter 1: prairieFyre suite. . . 2
Chapter 2: Call center concepts . . . 2
Chapter 3: Planning and managing your call center . . . 3
Chapter 4: Management Console . . . 3
Chapter 5: YourSite . . . 3
Chapter 6: Real-time Monitors . . . 3
Chapter 7: Reporter and Scheduled Reports . . . 4
Chapter 8: Data-mining . . . 4
Chapter 9: The Enterprise Node (CEN) . . . 5
Chapter 10: Network and Collector Monitors . . . 5
Chapter 11: WallBoarder . . . 5
Chapter 12: 6115 Interactive Contact Center . . . 5
Chapter 13: 6120 Contact Center Scheduling . . . 5
Chapter 14: 6150 Multimedia Contact Center . . . 6
User guide conventions. . . 6
User Interface (UI) syntax . . . 6
The word NOTE: designates essential user information.. . . 7
Client downloads from the 6110 CCM Web site . . . 7
Client Downloads . . . 7
Navigating 6110 CCM. . . 8
Viewing multiple sessions of 6110 CCM . . . 8
Chapter 2 Call center concepts
The ACD process . . . 12
ACD call flow . . . 12
Call routing . . . 13
Understanding the inbound call environment . . . 15
Random and predicted call arrival . . . 15
Caller tolerance . . . 15
Chapter 3 Planning and managing your call center
Step #1 establish a corporate service level objective . . . 19
Service defined . . . 19
Why is service level more meaningful than other metrics? . . . 20
Calculating the service level . . . 21
How do I choose a service level goal? . . . 21
Quality of service . . . 22
Silent monitoring systems . . . 23
IT support systems . . . 23
Step #2 collect data . . . 25
Collecting data on call handling . . . 25
Step #3 forecast the call load . . . 26
The importance of forecasting . . . 26
Conducting a forecast . . . 26
Step #4 calculate required resources. . . 27
Predicting the agent requirement. . . 27
Erlang C . . . 28
Service Level . . . 29
Determining the agent requirement . . . 29
Performing what-if scenarios . . . 29
The relationship between agents and trunks . . . 29
Predicting the trunk requirement . . . 30
Erlang B . . . 30
Determining trunk requirements . . . 31
Step #5 schedule agents . . . 32
The shrinkage factor . . . 32
Creative scheduling . . . 33
Call routing to optimize coverage . . . 35
Scheduling considerations . . . 35
How accurate is your scheduling?. . . 35
Step #6 determine call center costs . . . 36
A breakdown of expenses. . . 36
Cost of delay. . . 36
Cost per call . . . 36
Average call value . . . 37
Anticipating growth . . . 37
Chapter 4 Management Console
Using Management Console . . . 40
Enabling the Real-time Demo Simulation on the 6110 CCM Server . . . 43
Gaining access to database menu options . . . 44
System Settings tab . . . 45
Editing registry settings . . . 45
Setting alarms . . . 46
Database tab . . . 48
Quick Configuration Tool for the SX-2000. . . 48
Backing up the YourSite Database. . . 51
Restoring the YourSite Database . . . 51
Backing up the 6110 CCM Database . . . 52
Restoring the 6110 CCM Database. . . 52
Enterprise tab . . . 52
Chapter 5 YourSite
Configuration . . . 58
Agent tab. . . 61
Adding elements to YourSite . . . 64
Editing YourSite elements. . . 64
Deleting YourSite elements. . . 65
Agent Group tab . . . 65
Dialable Number . . . 68
Adding groups to YourSite . . . 68
Editing YourSite groups . . . 69
Deleting YourSite groups . . . 69
Adding elements to YourSite groups . . . 69
Deleting elements from YourSite groups. . . 70
Team tab . . . 70
Queue tab . . . 71
Queues . . . 71
AnsBy . . . 71
Queue Number . . . 72
Dialable Number . . . 72
Service Level . . . 72
Calls Abandoned Parameter . . . 73
Properties . . . 73
Queue Group tab . . . 73
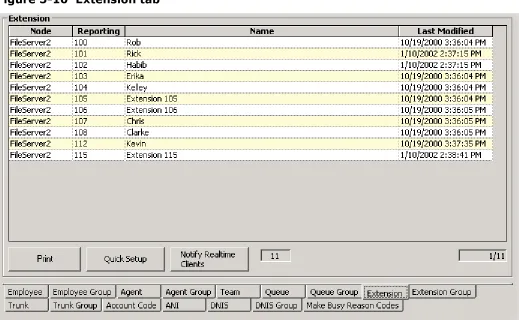
Extension tab . . . 74
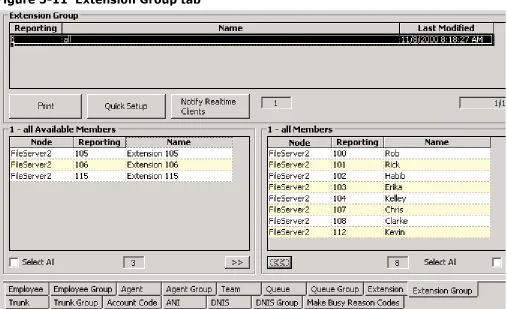
Extension Group tab . . . 75
Trunk tab . . . 76
Trunk Group tab . . . 77
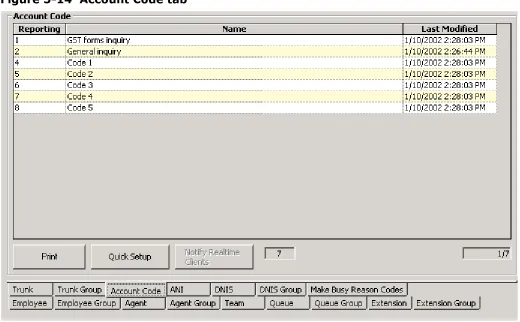
Account Code tab. . . 78
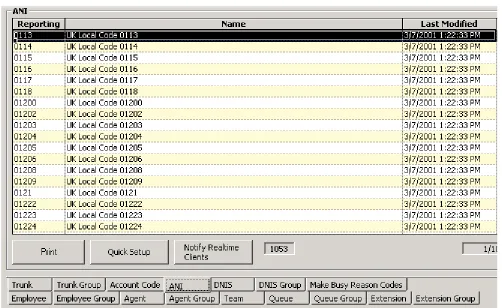
ANI tab. . . 79
DNIS tab . . . 80
DNIS Group tab. . . 81
Employee tab . . . 82
Employee Group tab . . . 83
Make Busy Reason Codes tab . . . 84
Automatic Synchronization with 6115 ICC. . . 85
The effects of Automatic Synchronization . . . 85
Employee IDs/Agent IDs . . . 85
Reporting numbers/Dialable numbers . . . 85
New Queues . . . 85
Changing Device names . . . 85
Setting the MiTAI Node . . . 86
Entering the Queue dialable and reporting numbers . . . 87
Security . . . 91
Creating a Security Role . . . 91
Granting or restricting access to 6110 CCM . . . 93
Creating lists . . . 94
Creating an Advanced Security Role . . . 98
Viewing My Security Role . . . 100
Chapter 6 Real-time monitors
SuperAdvisor . . . 103
Grid properties . . . 104
SuperAdvisor monitors . . . 105
Agent State by Position and Employee State by Position grids . . . 105
Agent State by Time and Employee State by Time grids . . . 109
Agent Shift grid . . . 110
Queue by Period grid. . . 111
Queue Now and Queue Group Now grids . . . 113
Call Count by Queue chart . . . 115
Queue Service Level Percent chart . . . 115
Queue Status chart . . . 116
Viewing real-time statistics . . . 116
Adding, rearranging, resizing, and sorting devices . . . 118
Hiding grid fields . . . 119
Defining grid styles . . . 119
Defining chart styles . . . 120
Defining performance thresholds . . . 123
Creating profiles . . . 126
Loading profiles . . . 127
Chatting online in SuperAdvisor. . . 128
AgentAdvisor . . . 130
Installing AgentAdvisor . . . 130
Grid properties . . . 131
AgentAdvisor monitors . . . 132
Agent State by Position and Employee State by Position grids . . . 132
Queue Now grid . . . 134
My Shift grid . . . 135
Viewing real-time statistics . . . 137
Adding, rearranging, resizing, and sorting devices . . . 139
Hiding grid fields . . . 141
Defining grid styles . . . 141
Defining performance thresholds . . . 142
Creating profiles . . . 144
Loading profiles . . . 145
Chatting online in AgentAdvisor. . . 145
Configuring Make Busy Reason Codes . . . 148
Adding a Make Busy Reason Code . . . 149
Editing a Make Busy Reason Code . . . 150
Deleting a Make Busy Reason Code . . . 150
Agent controls . . . 151
Logging on . . . 151
Logging off . . . 151
Placing agents or yourself in make busy with reason, or do not disturb . . . 152
Removing agents or yourself from make busy with reason, or do not disturb . . . 152
Agent grid controls . . . 153
Logging off . . . 154
Placing all agents or yourself in make busy with reason, or do not disturb . . . 154
Removing all agents or yourself from make busy or do not disturb . . . 155
Queue controls . . . 155
Placing queues in do not disturb . . . 155
Removing queues from do not disturb . . . 155
Queue grid controls . . . 156
Placing all queues in do not disturb. . . 156
Removing all queues from do not disturb . . . 156
CyberTerminal. . . 157
SX-200 connectivity to the 6110 CCM Server . . . 157
Data streams and prairieFyre real-time displays . . . 157
Viewing real-time SX-200 statistics . . . 158
ACD Monitor sessions . . . 160
System Activity monitor . . . 160
Path Summary monitors . . . 162
Agent Group Summary monitors . . . 164
Agent Information monitors . . . 166
Chapter 7 Reporter and Scheduled Reports
Run-on-demand reports . . . 171
Generating run-on-demand reports . . . 171
Viewing run-on-demand reports . . . 173
What to do if data is missing from the reports . . . 177
Deleting reports . . . 178
Scheduled Reports . . . 179
Generating a schedule. . . 180
Associating reports to the schedule . . . 181
Generating scheduled reports immediately . . . 184
Viewing scheduled reports . . . 185
What to do if data is missing from the reports . . . 187
Deleting reports . . . 188
licence violations . . . 189
Report Distributor . . . 190
Report types . . . 194
Report parameters . . . 194
Queue Reports . . . 196
Performance Reports. . . 197
Internal External Reports . . . 202
Spectrum by Period Reports. . . 203
Spectrum by Day of the Week Reports . . . 207
Spectrum by Queue Reports. . . 210
ANI Reports . . . 211
Queue Group by Queue with Agent Information. . . 212
Agent Reports. . . 213
Performance Reports. . . 214
Internal/External Reports . . . 219
Event by Period Reports . . . 221
. . . .In-bound/Outbound Trace Reports. . . 225
Answering Agent Reports . . . 226
Agent Shift Reports . . . 228
Employee Reports . . . 229
Performance Reports. . . 230
Internal/External Reports . . . 234
Event by Period Reports . . . 236
Team Reports . . . 237
Performance Reports. . . 237
Event by Period Reports . . . 239
Trunk Reports . . . 240
Performance Reports. . . 240
Busy Minutes Reports . . . 241
Extension Reports . . . 241
Performance Reports. . . 241
4Sight Reports . . . 242
DNIS Reports . . . 243
Performance Reports. . . 243
Chapter 8 Data-mining tools
ACD Inspector . . . 248
ACD search criteria . . . 249
ACD search criteria - agent events. . . 249
ACD search criteria - queue events . . . 250
ACD search criteria - option events . . . 251
ACD search criteria - download status . . . 253
ACD search criteria - advanced . . . 254
Wildcard Searches . . . 255
Interpreting ACD search results . . . 257
Agent Events tab . . . 257
Queue Events tab . . . 261
Option Events tab. . . 263
Exception Events tab . . . 264
Advanced Search tab . . . 265
Examples of ACD records . . . 266
SMDR Inspector . . . 267
SMDR search criteria . . . 267
SMDR search criteria - call parties . . . 267
SMDR search criteria - call types . . . 269
SMDR search criteria - options . . . 271
SMDR search criteria - advanced . . . 273
SMDR search criteria - agent shift . . . 275
SMDR search criteria - download status . . . 276
Running searches in SMDR Inspector . . . 276
Wildcard Searches . . . 276
Interpreting SMDR search results . . . 278
SMDR Search Results tab . . . 278
Advanced Search Results tab . . . 282
Agent Shift Results tab . . . 283
Exception Records tab . . . 285
SMDR record fields . . . 286
Examples of external SMDR records . . . 289
Advanced Inspector . . . 291
Switch related questions . . . 296
Queue related questions . . . 296
Agent related questions . . . 298
SuperAuditor. . . 299
SuperAuditor icons . . . 300
Viewing historical real-time events . . . 302
Chapter 9 6110 CCM Enterprise Node
Local and remote collectors . . . 307
Enterprise communications . . . 307
Viewing real-time data collection on the 6110 CCM Enterprise Server. . . 307
Viewing data and system alarms . . . 309
Enabling and disabling the alarm beep . . . 309
Enabling pop-up alerts . . . 310
Re-Initializing the Collector Service . . . 310
Managing call center operations . . . 311
Setting up enterprise services . . . 312
Configuring 6110 CCM enterprise nodes . . . 315
Configuring local and remote collectors on the 6110 CCM Enterprise Server (Los Angeles in this exam-ple) . . . 315
Chapter 10 6110 CCM Network and Collector Monitors
Network Monitor overview. . . 322
Menu functions. . . 322
Setting the data alarms in the Management Console. . . 323
Enabling pop-up alerts . . . 325
What to do if data is not streaming . . . 325
Re-Initializing the Collector Service . . . 325
Collector Monitor overview . . . 326
Menu functions. . . 326
Starting the Collector Monitor . . . 328
Chapter 11 WallBoarder
Spectrum wall sign setup . . . 331
Specifying wall sign comport settings. . . 332
Configuring wall sign messages. . . 332
Maintenance screen. . . 332
Resetting wall signs . . . 333
Variables screen. . . 333
Defining sign variables . . . 335
Messages screen . . . 336
Defining sign messages . . . 338
Groups screen . . . 338
Defining sign groups . . . 340
Priority Messages screen . . . 340
Defining priority messages . . . 342
Chapter 12 4Sight
Forecast parameters . . . 346
Generating forecast reports . . . 347
Viewing forecast reports . . . 348
Performing what-if scenarios . . . 351
What to do if data is missing from the reports . . . 351
Deleting reports . . . 351
licence violations . . . 353
Report Distributor . . . 354
6120 CCS. . . 358
Exporting, forecasting, and scheduling agents . . . 360
Chapter 13 Mitel Networks 6150 MCC
Configuring 6150 MCC. . . 360
To configure employees . . . 361
Editing Employees . . . 363
Deleting Employees . . . 363
To configure agents . . . 364
Adding Agents . . . 364
Editing Agents . . . 366
Deleting Agents . . . 366
To configure agent groups . . . 367
Adding Agent Groups . . . 367
Editing Agent Groups . . . 368
Deleting Agent Groups . . . 369
To configure members of an agent group . . . 370
Adding an agent to an agent group . . . 370
Removing an agent from an agent group . . . 370
To configure queues . . . 371
Adding Queues . . . 371
Editing Queues . . . 373
Deleting Queues . . . 373
To configure responses. . . 375
Adding Responses . . . 376
Editing Responses . . . 377
Deleting Responses . . . 377
Configuring 6110 CCM . . . 378
To configure Account Codes . . . 378
Adding an Account Code . . . 378
Editing an Account Code. . . 380
Deleting an Account Code. . . 381
To configure Make Busy Reason Codes . . . 382
Adding a Make Busy Reason Code . . . 382
Editing a Make Busy Reason Code . . . 383
Deleting a Make Busy Reason Code . . . 383
Changing 6150 MCC options . . . 384
To change the IP address and port number . . . 385
To open Outlook 2000 . . . 386
Opening Outlook 2000 . . . 386
Manually loading the 6150 MCC plug-in. . . 386
To view the 6150 MCC inbox when Outlook starts up . . . 387
To display 6150 MCC shortcuts . . . 390
To display the log on window when Outlook 2000 opens . . . 391
To make Outlook your top window when an e-mail arrives . . . 392
To direct e-mail to the 6150 MCC inbox . . . 393
To change the 6150 MCC e-mail arrival sound file . . . 394
Setting agent actions . . . 395
To log off from 6150 MCC . . . 396
To set a Make Busy Reason Code . . . 397
To remove Make Busy . . . 398
Responding to an e-mail . . . 399
To set an Account Code . . . 400
To hold an e-mail . . . 401
To transfer an e-mail . . . 402
To set No Reply Needed . . . 403
To send a reply . . . 403
Viewing e-mail history . . . 404
To view e-mail history . . . 404
To view Current Case . . . 406
To view Entire History . . . 407
To view a Specific E-mail . . . 408
To view the Current E-mail . . . 410
Creating and using a 6150 MCC template . . . 411
To create a template. . . 411
To use a 6150 MCC template . . . 413
Viewing Mini Queue Now Stats . . . 414
To view Mini Queue Now Stats . . . 414
To view the repository . . . 415
To view the original e-mails . . . 415
To view the e-mail replies . . . 415
Appendix A . . . 416
6150 MCC Terminology . . . 416
&KDSWHUSUDLULH)\UH&RQWDFW&HQWHU0DQDJHPHQWVXLWH
SUDLULH)\UH&RQWDFW&HQWHU6ROXWLRQVVXLWH
)HDWXUHVDQGEHQHILWV
The prairieFyre suite provides the following functionality:
• The browser-based user interface works across all 32-bit Windows platforms. • It operates in conjunction with familiar office productivity tools.
• It is installed on the server only and can be accessed by an unlimited number of users.
• Configuration changes instantly deploy from the server to authorized intranet and Internet-based clients. • You can remotely manage call center operations and restrict user access to program functions and
individual call center elements — log on to any PC and monitor call center operations and program system features.
The prairieFyre Contact Center Solutions suite is designed for the SX-2000, SX-200, and SX-200 with real-time (SX-200 EL/ML LIGHTWARE Release 4.0 and greater) telephone systems. With the prairieFyre suite, you can manage your call center from anywhere, at any time. The suite provides data collection, analysis and storage, forecasting, real-time monitoring, online messaging, historical reporting, data mining, and wall sign messaging.
/LFHQFLQJ
NOTE: An employee is a physical person being tracked in your call center. Employees can have multiple
agent IDs. The number of employees you program in the YourSite Database must be consistent with your software licence. If you have more employees programmed than your licence permits, “[licence Is In Violation of Max Agents Allowed]” will appear in place of your company name on the 6110 CCM user interface (UI) and on any reports you generate.
$ERXWWKH&&08VHU*XLGH
The 6110 Contact Center Manager User Guide provides information on the basics of ACD call center management and the use of 6110 CCM programs. The topics covered require the user to have a working knowledge of the Microsoft Windows operating environment and Microsoft Excel 97 or 2000. The tutorials that accompany Windows and Excel provide the information necessary for basic use.
8VHUJXLGHOD\RXW
&KDSWHUSUDLULH)\UHVXLWH
Chapter 1 describes the features and benefits of the prairieFyre suite, the layout of the document, and basic information about client downloads from our Web site.
&KDSWHU&DOOFHQWHUFRQFHSWV
Call centers process a high volume of calls to meet marketing, sales, customer service, technical support, and other business objectives. A fine-tuned call center distributes calls efficiently and optimizes the use of agents and other resources.
&KDSWHU3ODQQLQJDQGPDQDJLQJ\RXUFDOOFHQWHU
Chapter 3 instructs you on how to plan and manage your call center.
&KDSWHU0DQDJHPHQW&RQVROH
Chapter 4 instructs you on how to configure the 6110 CCM server.
Management Console is located on the 6110 CCM Enterprise server. With Management Console, you can troubleshoot 6110 problems, manage the SQL database, inspect the SQL database object and back up and restore the database, or critical portions of the database.
&KDSWHU<RXU6LWH
Chapter 5 instructs you on how to configure your database and security. You add elements and groups to the database in the Configuration module. You program and enforce security in the Security module.
When you configure the YourSite Database, it must reflect the trunks, lines, routing and timing options, and agent positions in use on the telephone system. You can register account codes in YourSite for individual departments, projects, and services to generate reports. For example, an agent who receives calls for three catalog companies enters account code 1 for calls to company X, account code 2 for calls to company Y, and account code 3 for calls to company Z.
You enter resource information in YourSite so that you can generate reports with 6110 CCM. If you register the aforementioned catalog companies in YourSite, 6110 CCM generates reports on the number, origin, and handling of calls to the three companies.
You implement security to restrict the database teams and groups that individual users view when generating reports and monitoring real-time activities. If you do not implement security, then 6110 CCM users will see all of the devices, reports, and users listed in YourSite when running reports and monitoring real-time activities.
&KDSWHU5HDOWLPH0RQLWRUV
Chapter 6 instructs you on how to configure and use SuperAdvisor and AgentAdvisor. With SuperAdvisor, supervisors can view agent states and statistics in real-time. With AgentAdvisor, agents can view their own states and statistics.
6XSHU$GYLVRU
&KDSWHUSUDLULH)\UH&RQWDFW&HQWHU0DQDJHPHQWVXLWH
$JHQW$GYLVRU
The AgentAdvisor program provides real-time agent statistics. It displays the agent state, agent name, agent number, extension number (or queue number for On ACD and on ACD Hold agents), and time in state for each agent. AgentAdvisor also provides real-time and over-the-business-day queue statistics. The displays change color when pre-defined performance thresholds are exceeded to keep agents informed of significant changes in the service provided to callers. AgentAdvisor includes a chat feature agents use to send online messages to supervisors.
&KDSWHU5HSRUWHUDQG6FKHGXOHG5HSRUWV
Chapter 7 instructs you on how to create reports and scheduled reports. You use Reporter to produce run-on-demand reports, and Scheduled Reports to set up timetables for generating reports.
The Reporter and Scheduled Reports programs provide detailed statistics on the performance of your call center resources. You can generate load activity, resource activity, ACD queue activity, and forecast reports for 15, 30, or 60-minute intervals across any series of days you specify.
The reporting programs provide presentation quality reports and graphs in a Microsoft Excel spreadsheet. You can customize the content and style of report grids and graphs directly in your browser.
5HSRUW'LVWULEXWRU
The Report Distributor application prints and e-mails your reports and displays the status of your printing and mailing jobs. It runs in the system tray on your computer and must be running at all times in order to print and e-mail reports automatically.
&KDSWHU'DWDPLQLQJ
Chapter 8 instructs you on various data-mining tools: Inspector, Advanced Inspector, and SuperAuditor. ,QVSHFWRU
Inspector finds specific call center events, such as the exact time an agent logs off at lunch, the duration of time agents spend in Do Not Disturb from 1:00 P.M. to 2:00 P.M. on Monday, or the maximum number of callers that waited in queue for the day. In a single session you can search through the data from multiple days to find a specific event. The search follows a wild-card format; your specifications do not have to be exact. You can make the search as inclusive or exclusive as you wish. Inspector displays the results in an easy-to-interpret grid that you can print or save to file.
$GYDQFHG,QVSHFWRU
Using Advanced Inspector, you can determine why there are discrepancies between reports, verify the programming of the telephone system and the YourSite Database, and compare the data output by the ACD and SMDR data streams. The results are displayed in a table. The search output also provides a written explanation for the results.
6XSHU$XGLWRU
&KDSWHU7KH(QWHUSULVH1RGH&(1
Chapter 9 instructs you on how to configure both local and remote nodes.
The Enterprise Node permits supervisors to access data from remote sites with a PC using Internet Explorer. A node is also known as a collector.
&KDSWHU1HWZRUNDQG&ROOHFWRU0RQLWRUV
Chapter 10 instructs you on how to use the Network and Collector Monitors. 1HWZRUN0RQLWRU
With the Network Monitor, you can connect to a node (collector), view real-time data collection for all nodes, enable a popup alarm that notifies you of any data and system alarms, re-initialize the server, and view the Collector Monitor, which provides detailed node information.
&ROOHFWRU0RQLWRU
The Collector Monitor verifies that the Collector Service is collecting real-time data from your telephone system. It forwards the real-time data to connected clients and to the Structured Query Language (SQL) database. With the Collector Monitor, you can view detailed node information.
&KDSWHU:DOO%RDUGHU
Chapter 11 instructs you on how to configure and use WallBoarder.
WallBoarder uses one or more Spectrum Light Emitting Diode (LED) wall signs (reader boards) to provide real-time ACD statistics to agents and supervisors, such as the number of calls in queue, the wait time of the longest waiting caller, and the number of available agents. You can customize the size and color of the displayed statistics and the way they move across the wall sign.
&KDSWHU,QWHUDFWLYH&RQWDFW&HQWHU
6115 CCM is a purchasable option that complements the SX-2000 and 3200 ICP/3300 ICP (Integrated Communications Platform) telephone systems.
Chapter 12 instructs you on how to configure and use SuperAdvisor and AgentAdvisor when used in conjunction with 6115 Interactive Contact Center.
With SuperAdvisor and 6115 CCM, supervisors can interact with agent states in real-time. Supervisors can control the availability of agents and ACD queues. They can log an agent out of one queue and into a busier queue, or place the agent in make busy or do not disturb. In addition, they can log a queue in and out, or place the queue in make busy or do not disturb.
With AgentAdvisor and 6115, agents have more control over their own states.
&KDSWHU&RQWDFW&HQWHU6FKHGXOLQJ
Chapter 13 instructs you on how to produce a 4Sight report. The 4Sight report can be imported into 6120 CCS to predict future workforce scheduling demands. For more information on 6120 CCS, please read the 6120
&KDSWHUSUDLULH)\UH&RQWDFW&HQWHU0DQDJHPHQWVXLWH
Reporter and Scheduled Reports include a 4Sight report. You can accurately predict resource requirements using the Erlang C formula. Erlang C uses your historical call load data, average talk time data, service level percent, service level time, and wrap up time you specify to predict the agent requirement for the time interval and date range in the forecast.
&KDSWHU0XOWLPHGLD&RQWDFW&HQWHU
Chapter 14 instructs you on how to use 6150 CCM.
8VHUJXLGHFRQYHQWLRQV
This user guide uses the following document conventions.
8VHU,QWHUIDFH8,V\QWD[
The following terms apply to actions you perform on user interface (UI) screens:
• Click precedes items you select with the mouse, such as buttons and items in list boxes. • Press precedes items you select on the keyboard.
• Select or clear precedes items you turn on or turn off, such as check boxes.
• Select precedes items you select in combo boxes (text boxes with attached list boxes).
• Using a drag-and-drop operation means clicking an object on the screen with the left mouse button, and pressing the mouse button while you drag the object to a different position on the screen.
For example: click OK; press ENTER; select the PFDatabase check box. ,WDOLF
Italic typeface is used to set off words, letters, and numbers referred to as themselves in the text, and for characters or words you type in the user interface. For example: overflow is the routing of calls to more than one queue; the program saves text files as MMDDYYYY.sql.
4XRWDWLRQPDUNV
Quotation marks are used for memorable or well known information. For example: perform “what-if” scenarios on the resultant data.
%ROG
Bold designates paths you select in your root directory and items you click, press, or select. For example: Click OK; delete 50 and insert 60; select the Check database integrity check box.
0HQXLWHPV
1RWH
The word NOTE: designates essential user information.
&OLHQWGRZQORDGVIURPWKH&&0:HEVLWH
&OLHQW'RZQORDGV
Client Downloads consists of the Critical Component Pack, the Client Component Pack, and Optional Component Pack.
&ULWLFDO&RPSRQHQW3DFN
The following Supervisor Desktop applications are included in the Critical Component Pack: MS Visual Basic version 6 Runtimes, MS MFC 6.2 version 6 Runtimes, MS MDAC 2.6 Runtimes, MS Standard OCX and DLL Redistributables, and Third Party licenced Redistributables Required by 6110 CCM/6150 MCC Programs.
&OLHQW&RPSRQHQW3DFN
The following Supervisor Desktop applications are included in the Client Component Pack:
AgentAdvisor
AgentAdvisor is an Agent Desktop applications for agent computers.
This is a download for 6110 CCM that provides a subset of the functionality of SuperAdvisor. It runs as an executable program instead of from within the Internet Explorer environment.
Excel Report Templates
These are the templates for all 6110 CCM performance reports. You must install these on your TEMP directory before you can run any reports. If you change or customize your report templates, please ensure you back up your files before re-running this installation.
Report Distributor
With this download you can print your scheduled reports from your computer. When installed, the Report Distributor resides in your system tray.
Network Monitor
The Network Monitor indicates if your ACD and SMRD data streams are running. If the data streams are not running, you can easily clear the alarms that indicate the data streams are not running and reset the ACD and SMRD links.
Auto Update
If you upgrade your server the Auto Update download will notify you when you open Outlook that a new version of the 6150 Mulitmedia Contact Center is available.
6150 MCC Outlook Extensions
&KDSWHUSUDLULH)\UH&RQWDFW&HQWHU0DQDJHPHQWVXLWH
2SWLRQDO&RPSRQHQWV
Microsoft Data Access Components (MDAC) 2.6
This is a Microsoft installation that provides access to your structured data across a network connection. It is required for all prairieFyre clients.
Adobe Acrobat Reader
This is the Adobe Acrobat Reader installation for version 5.5. You require Acrobat Reader to view the online user guide and user tutorial.
prairieFyre provides the following additional supporting applications.
Microsoft Internet Explorer 6.0
6110 CCM requires at least IE 6.0 to function.
CyberTerminal
This is an optional installation required if you are running a call center with a Mitel SX-200 Digital PBX, and you have not purchased the ACD real-time event option from Mitel or your Interconnect. This is the server component that provides a networked-based VT-100 session for clients on the 6110 CCM network. Please refer to the online Help or Chapter 7 of this guide for a more detailed description.
CEN
CEN software implements mulit-site call center capabilities with a single server configuration. The CEN software is designed for geographically dispersed call centers requiring consolidated management reporting and real-time capabilities. CEN software can be installed on a remote Windows NT/2000 Server or Window 2000 Professional computers. Please do not install CEN on the Enterprise 6110 CCM Server computer.
1DYLJDWLQJ&&0
The following tips will help you navigate efficiently in 6110 CCM.
9LHZLQJPXOWLSOHVHVVLRQVRI&&0
Sometimes you will need to view two or more 6110 CCM programs simultaneously. For example, you open two or more sessions to perform multiple searches for event records, and to compare report data to SMDR search results.
To run multiple 6110 CCM sessions:
1. In the browser, type in the 6110 CCM Server IP address http://[your 6110 CCM Server address]/
6110 CCM/. Alternatively, double-click the 6110 CCM desktop icon.
2. If you do not see the 6110 CCM desktop icon, to create a shortcut to 6110 CCM, drag-and-drop the 6110 CCM Web address to your desktop.
3. Click Add to Favorites to add the 6110 CCM Server IP address to your list of favorite addresses and click OK.
4. Click Favorites, locate the prairieFyre 6110 CCM entry (at the bottom of the list) and move it to the top of the list using a drag-and-drop operation.
5. Optionally click Make Home Page to set the 6110 CCM Server IP address as your home page. 6. Enter your username and password and click Submit.
You can start additional 6110 CCM sessions by clicking the Internet Explorer icon on the Windows Taskbar and selecting 6110 CCM from your list of favorites.
Alternatively, you can click Tools=>Internet Options and set your Home Page to the 6110 CCM program (your 6110 CCM Server IP address) to run multiple sessions. You start the first instance of 6110 CCM by clicking the 6110 CCM desktop icon, and the second (and subsequent) 6110 CCM sessions by clicking the Internet Explorer icon on the Windows Taskbar.
You can open multiple browser sessions of the SuperAdvisor, YourSite Configuration, ACD Inspector, SMDR Inspector, and ACDLink applications from their respective menus.
For example, to open a new session of SMDR Inspector:
1. Click the 6110 CCM desktop icon and log on to 6110 CCM. 2. On the Tools menu, right-click SMDR Inspector.
3. Click Open in New Window to start SMDR Inspector in a new browser session.
6110 CCM displays the new SMDR Inspector session in addition to your original 6110 CCM session.
NOTE: You can switch between 6110 CCM sessions by holding down the Alt key and pressing the Tab key
&KDSWHU&DOOFHQWHUFRQFHSWV
&KDSWHU&DOOFHQWHUFRQFHSWV
&DOOFHQWHUFRQFHSWV
Call centers process a high volume of calls to meet marketing, sales, customer service, technical support, and other business objectives. A fine-tuned call center distributes calls efficiently and optimizes the use of agents and other resources. This chapter describes the inbound call center environment and how resources interact to process calls.
7KH$&'SURFHVV
An Automatic Call Distributor (ACD) is a specialized telephone system program for distributing incoming calls. The primary goal of an ACD is to ration calls to agents in a cost-effective manner that provides acceptable service to callers.
To optimize the use of agents, you cross-train them so they can handle a variety of inquiries. Rather than distributing calls to a number of small, specialized agent or extension groups, the ACD distributes them efficiently among the entire pool of available agents. When you consolidate resources (use the Pooling Principle), the same number of call center agents handle more calls while maintaining service levels.
Typically, you program the ACD to ensure the first call to arrive reaches the first available agent or the agent who has been idle the longest. However, you can vary the order of calls and agents to provide superior service to preferred customers, and skills-based routing.
$&'FDOOIORZ
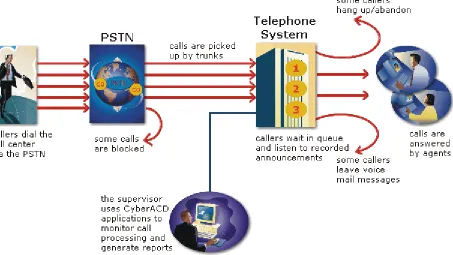
The path of an incoming call is as follows. A caller telephones your call center via the Public Switched Telephone Network (PSTN). (The PSTN is a global collection of Central Offices (COs) interconnected by long-distance telephone switching systems.) The local CO directs the call to one of your trunk groups. An available trunk picks up the call. Typically, calls from the PSTN arrive to the call center over incoming trunks and calls from the call center to the PSTN travel over outgoing trunks. If no trunks are available, the call does not get through to the system (is blocked) and the caller receives a busy signal.
When a trunk picks up a call, it forwards it through to a group of agents answering calls, or to some other answering point. The call arrives at the ACD queue of an agent group. The queue delays the call rather than blocking the call from entering the system. The length of time the caller waits in queue is the queue time. While waiting in queue, the caller listens to product features, announcements, or other messages provided by a Recorded Announcement Device (RAD). The caller can wait patiently in queue for an available agent, leave a voice mail message, or hang up (abandon) the call.
An agent answers the call. The time the caller spends talking to the agent is the talk time. When the call is completed, the agent may need to perform additional work associated with the call. The time taken to perform this work is the wrap up time.
0RQLWRULQJWKHFDOOIORZSURFHVV
Second-by-second (real-time) statistics presented on wall signs and desktop monitors enable you to monitor the service provided to callers. You can monitor the number of incoming calls, the time it takes to process them, the queue load, and the availability of agents using a Management Information System (MIS). The term MIS refers to the processing of data produced by the telephone system. The MIS uses telephone system records to provide forecasting, real-time monitoring, and reporting functions.
(QVXULQJWUDIILFFDUU\LQJHIILFLHQF\ To optimize traffic-carrying efficiency ensure
• Sufficient trunks are available to carry incoming calls. • Callers experience a delay in queue.
• There is a random distribution of calls among available agents. 6FKHGXOLQJWRRSWLPL]HFDOOIORZ
You schedule agents so the number of incoming calls at any given time typically exceeds the number of agents currently available. The intent is that callers experience a slight delay before agents answer their calls. The expected number of incoming calls forecasted for the time of day, and day of the week influence scheduling decisions.
&DOOURXWLQJ
&KDSWHU&DOOFHQWHUFRQFHSWV
)LJXUH&DOOURXWLQJ
'LDOLQJDQDJHQW¶VH[WHQVLRQ
In the simplest call scenario, a single trunk picks up an incoming call to your call center. The telephone system presents the caller with options to dial various answering points. The caller dials an individual agent at an extension through a queue number. A queue number is an address mechanism for a queue or other answering point. The programming associated with the queue number defines the routing and timing features of the call. The telephone system collects data on the agent and trunk involved in the call. The ACD management reporting program produces reports on agent and trunk activity.
'LDOLQJDTXHXH
In the next call scenario a trunk group picks up an incoming call to your call center. The system presents the caller with options to dial various answering points. The caller dials queue number 1 to reach queue 1 (Customer Service). The system forwards the call to the first available agent in the agent or extension group associated with queue 1. The call is an ACD call because one dialable number represents all agents in the group. The telephone system collects data records for the call. The ACD management software produces Queue Reports on queue 1.
&DOORYHUIORZ
)LJXUH0XOWLSOHTXHXHURXWLQJ
&DOOLQWHUIORZ
You can program the telephone system to direct a queue delayed call to voice mail or to another answering point. The interflow timer runs independently of the overflow timer. If the interflow timer expires, the system removes the call from the queue and re-directs it to another answering point, such as a trunk or voice mail.
8QGHUVWDQGLQJWKHLQERXQGFDOOHQYLURQPHQW
The inbound call center environment has unique characteristics that must be considered in effective planning and management.
5DQGRPDQGSUHGLFWHGFDOODUULYDO
Calls arrive randomly to call centers. You cannot predict the minute-to-minute arrival of calls. This results in unanticipated increases in workload, and impacts staffing calculations and the load carried by system and network resources.
You can predict the pattern of call arrivals for 15-minute or longer intervals. For example, you can predict that next Monday between 1:00 P.M. and 1:30 P.M. you will receive 60 phone calls. However, you cannot predict how many calls will arrive in the first five minutes, the second five minutes, and so on.
&DOOHUWROHUDQFH
Several factors influence a caller’s tolerance to queue delays: • The immediacy of the caller’s requirement
• The availability of similar products or services • The caller’s expectations for service
• The time available to make the call
&KDSWHU3ODQQLQJDQGPDQDJLQJ
\RXUFDOOFHQWHU
(QVXUH\RXKDYHWKHULJKW
UHVRXUFHVLQSODFHDWWKHULJKW
WLPHVWRKDQGOHDQDFFXUDWHO\
&KDSWHU3ODQQLQJDQGPDQDJLQJ\RXUFDOOFHQWHU
3ODQQLQJDQGPDQDJLQJ\RXUFDOOFHQWHU
Effective call center management involves having the right resources in place at the right times to handle an accurately forecasted workload at the desired level of service. Commitment to a systematic planning and management strategy is essential; the strategy is based on corporate objectives that you continually access and refine.
Whether you are managing a start-up call center or refining the performance of an existing operation, the process illustrated in Figure 3-1 applies. It is the basic framework for achieving and maintaining your service objectives.
)LJXUH3ODQQLQJF\FOH
6WHSHVWDEOLVKDFRUSRUDWHVHUYLFHOHYHOREMHFWLYH
Defining and adequately funding a service level should be closely tied to your corporate mission. The service level identifies the average length of time a caller who has obtained a trunk waits for an available agent. It is the basis for planning and budgeting and links the resources you require to your service objectives. Choosing a service objective is the first step in a comprehensive planning and management solution. Once you set a service objective, you should routinely access it to see how consistently you are meeting it, on a 15-minute or half-hour basis.
Call centers in different industries use different criteria for measuring service. Your service level objective should reflect the type of service being provided and the expectations of callers seeking the service. For example, a company that sells magazine subscriptions has less to lose in the outcome of any one call than a car dealership does. A caller to a credit card “lost or stolen” line might expect different service than a caller to a customer service department at a bank. Call center metrics across industries are designed to reflect this.
Performance targets must suit the primary function of a call center. In revenue-based call centers where agents sell products or services, the net revenue per call is considered when defining a service objective. Revenue-based call centers strive to provide a high level of service with minimal blocking and delays.
In cost-based call centers where agents provide customer service, call handling incurs costs but does not provide additional revenues. The level of service in cost-based call centers is typically not as high as the level of service in revenue-based centers. Although the chance of blocking is minimal, an almost certain delay in the ACD queue is to be expected.
6HUYLFHGHILQHG
Service level is expressed as X percent of calls answered in Y seconds, such as 80 percent of calls answered in
20 seconds. Why is service level the standard measurement of service? The answer is service level provides the most accurate representation of the callers’ experience; it is ultimately the caller who decides what constitutes good service, and whether or not to end a call. The service level is sometimes called the telephone service factor (TSF). It applies to inbound transactions that must be addressed as they arrive.
6HUYLFH/HYHO
The term service level is total number of calls which are answered, abandoned, and interflowed before a
defined threshold time (Service Level Time), compared to the total number of calls answered, abandoned, and
interflowed. It’s the average length of time a caller who has obtained a trunk waits for an available agent. The service level = (Calls Answered + Long Calls Abandoned + Long Interflow) within the Service Level Time ÷ (Calls Answered + Long Calls Abandoned + Long Interflow).
6HUYLFH/HYHO3HUFHQW
The service level percent is the proportion of calls, expressed as a percentage, which are answered,
abandoned, and interflowed within a defined threshold time compared to the total number of calls answered or abandoned (after the short abandon time).
6HUYLFH/HYHO7LPH
&KDSWHU3ODQQLQJDQGPDQDJLQJ\RXUFDOOFHQWHU
:K\LVVHUYLFHOHYHOPRUHPHDQLQJIXOWKDQRWKHUPHWULFV"
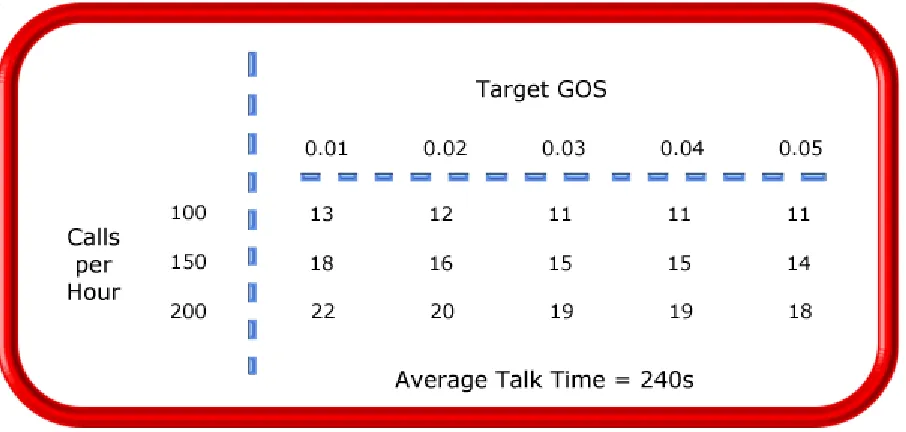
Service level is one of many ACD statistics used to measure performance. Each statistic has its purpose. For example, the grade of service (GOS) statistic relates the number of trunks to the level of traffic and indicates the likelihood an attempted call will receive a busy signal. It is expressed as a decimal fraction. For example, a GOS of P.02 means a caller will have a two percent chance of receiving a busy signal. Since trunk costs are insignificant compared to agent costs call centers are well advised to schedule sufficient trunks; abandons should be minimal.
A delayed call is a call placed in the ACD queue because it can not be answered immediately by an agent. The probability of delay statistic relates the number of agents or extensions to the level of traffic carried by the trunks and indicates the likelihood and amount of delay experienced. The GOS, probability of delay, and quality of service rendered by agents provide vital information about the callers’ experience, as illustrated in Figure 3-2.
)LJXUH6HUYLFHFULWHULD
The GOS and probability of delay contribute to our understanding of what happens to the calls not answered in Y seconds, and give meaning to service level. Service level is the primary statistic used in planning and budgeting because it is the most stable measurement of queue activity.
$6$
The average speed of answer (ASA) is an ACD statistic that measures how long the average caller waits on
$EDQGRQPHQW
ACDs collect statistics on how long callers wait before abandoning calls, and what percentage of calls are abandoned. Unfortunately, abandonment is difficult to forecast because it is impossible to predict caller behavior with any reliability. Sometimes when the service level is high more callers abandon than expected. There are no industry standards for abandonment; it is a somewhat unreliable measure of call center
performance. However, abandonment statistics assist in planning service levels, and provide valuable information used to create in-queue and message-on-hold announcements.
&DOOV$EDQGRQHG3DUDPHWHU
The Calls Abandoned Parameter specifies the value which determines whether a call is a Short Abandoned Call or a Long Abandoned Call. If the abandon time is less than the Call Abandoned Parameter, then it is a Short Abandoned Call. If the abandon time is more than the Call Abandoned Parameter, then it is a Long Abandoned Call.
You assign the Calls Abandoned Parameter (called the Queue Short Abandon Time) values to ACD queues in the YourSite Database.
Callers can abandon after they reach a trunk (before they reach the ACD queue) or while they are in queue waiting for an available agent (either before or after the short abandon time you specify).
&DOFXODWLQJWKHVHUYLFHOHYHO
The service level is the total number of calls which are answered, abandoned, and interflowed before a defined
threshold time (Service Level Time), compared to the total number of calls answered, abandoned, and
interflowed. It’s the average length of time a caller who has obtained a trunk waits for an available agent. The service level = (Calls Answered + Long Calls Abandoned + Long Interflow) within the Service Level Time ÷ (Calls Answered + Long Calls Abandoned + Long Interflow).
+RZGR,FKRRVHDVHUYLFHOHYHOJRDO"
Contrary to popular belief, there is no industry standard service level. Some call centers base their service level goal on the targets of same-industry companies. In doing so, they assume these companies are actually meeting their intended targets. Companies are setting increasingly rigorous service level targets in sectors where outstanding customer service is the norm. In a survey of over 100 UK call centers Opta Consulting was surprised to find an average performance target of 90 percent of calls answered in 15 seconds. They found that companies setting extremely rigorous targets did not necessarily meet them, and the investment required to achieve “best in class” targets was difficult to justify.
Setting an appropriate service level goal for your call center is not easy. The motivation and expectations of your customers, the availability of similar goods or services, the service level targets of same-industry companies, and the value of calls are things to consider. It may be useful to run some calculations to determine the trade-offs in service level associated with adding or removing an agent, and implement customer
satisfaction surveys. When defining your corporate service level, consider several factors and rate their relative importance.
An appropriate service level is one that • Satisfies callers’ expectations for service
• Keeps abandonment in check (at less than five percent) • Minimizes expenses and maximizes revenue
&KDSWHU3ODQQLQJDQGPDQDJLQJ\RXUFDOOFHQWHU
Consider this modest objective. For a service level of 80 percent of calls answered in 20 seconds, callers receive the following service:
• Approximately 30 percent of callers experience a delay in queue. • The longest wait time is approximately three minutes.
• The average speed of answer is approximately 12 seconds.
Is this acceptable service for you and for your callers?
4XDOLW\RIVHUYLFH
Agent statistics reflect the time agents spend in various states and are used to assess agent performance; the average time an agent spends in talk time, make busy, unavailable, and wrap up states directly affects his or her availability and the service level provided to callers.
Service level alone does not ensure customer satisfaction. The quality of the interaction between the caller and agent leaves a lasting impression. The quality of service reflects an agent’s ability to provide excellent service to each customer. The knowledge of the agent, the accuracy and completeness of the information provided, and the courtesy extended to the caller contribute to the caller’s experience.
6LOHQWPRQLWRULQJ
Silent monitoring systems complement ACD statistics by providing a snapshot of quality and productivity in your call center. You can track call handling techniques and determine where improvements can be made in individual performance. Advanced systems capture the voice conversations between agents and callers and record agent data screens for a complete picture of call handling. They provide online evaluation forms so you can annotate recordings with feedback.
Silent monitoring takes the bias out of performance evaluation; it provides a systematic process for
monitoring and grading agent calls. You can schedule sessions across different times of the day, days of the week, and evaluators promoting fairness and consistency. Showing agents where improvement is needed is more effective than just telling them. Silent monitoring can contribute to a reduction in call time, a reduction in monitoring time and personnel, and increased training efficiency.
You can use pre-recorded conversations between agents and customers to train agents and for ongoing evaluation. You can use the information to
• Provide recorded examples of exceptional service and unacceptable service to agents in training. • Record, review, annotate with feedback, and forward call records to agents who then review your
comments within the context of the actual call.
• Calibrate and routinely access the scoring consistency of call monitors. • Assess the effectiveness of current training programs.
'HILQLQJVFRULQJSDUDPHWHUV
The parameters used to evaluate how well agents handle calls are based on the purpose of the calls. Goals vary across calls for inbound and outbound services. For example, in an outbound sales environment quality may be based on whether or not the agent made the sale, took advantage of cross-sell opportunities, and adhered to a pre-defined script. In an inbound environment quality may be based on the completeness and accuracy of the information and whether or not the caller’s questions were answered satisfactorily. Agents are also evaluated on “soft skills”, such as voice quality, pausing at regular intervals, rate of speech, use of positive language, and other listening and communication skills.
6HWWLQJSHUIRUPDQFHVWDQGDUGVDQGJRDOV
Once you determine appropriate scoring parameters, you define standards for exceptional and acceptable levels of performance. Assessment standards are based on consensus and must be clearly defined and communicated to monitors and agents. Collaborate with agents in setting performance goals and clearly define exceptional service and interim performance steps. Determine a baseline of current performance and set performance steps for an agent group. Provide agents in the group who meet or exceed the interim target with rewards and recognition commensurate with their performance. When systematically used in training and coaching recorded sessions positively impact productivity. Fair assessment is good for moral and motivation, and contributes to an environment in which agents can learn and grow.
)UHTXHQF\RIPRQLWRULQJVHVVLRQV
The frequency of monitoring sessions is determined by individual companies and ranges from once a month to 15 or 20 sessions a month. Implementing five to 10 monitoring sessions per month is common practice. Trainees and agents with consistently low scores are monitored more frequently than other agents. Resource limitations typically influence the frequency of monitoring.
6LOHQWPRQLWRULQJV\VWHPV
Silent monitoring systems range from tape recorders to client/server based recording systems. Advanced systems schedule, record, and store voice files in a compressed digital format using a real-time link to your telephone system. They capture any data screens accessed by the agent in addition to voice data. Silences are eliminated to optimize monitoring efficiency. Recording sessions can be played back from any telephone, anywhere, at anytime. You can customize agent evaluation forms and define parameters for quality with advanced systems. They provide activity, status, and management reports for evaluating agents and observation practices.
,7VXSSRUWV\VWHPV
Information Technology (IT) support systems are commonplace in call centers. Call center agents divide their
time between listening to customer requests, entering and updating customer information and other entries, searching for required information, and providing feedback to customers. In order to provide prompt and complete information, agents must have immediate online access to information including customer records and case histories, products and services, and company policies and procedures.
&KDSWHU3ODQQLQJDQGPDQDJLQJ\RXUFDOOFHQWHU
&7,
Computer telephony integration (CTI) is the merging of computers and telephone systems. Today’s
computer-based telephone systems deliver synchronized voice and data, voice and data conferencing, automatic information retrieval for calls, caller-based messaging and routing, and desktop productivity tools. You can use customer databases in call handling to enhance customer service and agent productivity. When databases are shared between call center departments each agent can access a caller’s contact information, purchasing records, call history, and preferences by a caller ID number.
$1,
Automatic Number Identification (ANI) identifies the telephone numbers of callers to your call center, so
agents can receive screen pops with calls. You can connect a database to your telephone system to simultaneously send calls and caller information. The telephone system forwards the caller’s telephone number to a software program that relays database records on the caller to the agent. Alternately, the caller enters an ID number that the database associates with a set of records for the caller and the agent is sent the information.
ANI saves agents time since they do not have to ask for and enter a name for a caller, and wait for the database to respond. This time savings significantly impacts staffing requirements and telephone service charges. ANI also identifies telephone numbers of callers who abandon calls so they can be contacted later for potential business.
Reports can identify the volume of usage and costs of internal line numbers, and help you track the long distance distribution per line number and maximize long distance efficiency.
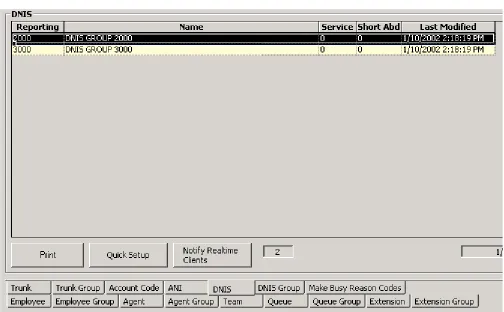
'1,6
Dialed Number Identification Service (DNIS) is a feature of toll-free lines that identifies the telephone
number the caller dials. This assists agents who answer calls for more than one business or product line. Each business or product line has its own toll-free number. When a caller dials a toll-free number, the telephone system forwards information to the agent so the agent can identify who the caller dialed. For example, a caller dials a tool-free number for a cruise line. The telephone system sends a script to the agent along with the call. The agent then knows to answer “Good morning. Thank you for calling Southern Cruises,” instead of the name of another cruise line serviced by the center.
$XWRPDWHG+HOSGHVNZRUNIORZ
Agents at IT help desks require quick access to customer information and call history, and the ability to rapidly log all support calls and incidents. Advanced help desk packages offer automated desk help workflow systems. They assist agents in logging service requests (tickets), dispatching them to prioritized queues or agents, tracking them, and documenting activities.
External programs, help desk operators, or end users (in Web-based programs) generate tickets. The system generates them manually, or in some cases automatically, in response to system events. It can correlate multiple incidents with single tickets, and multiple problems with a single call.
6WHSFROOHFWGDWD
Telephone systems generate an enormous amount of real-time and historical data used in planning and management. You use real-time data to monitor the current call load and agent availability so minute-to-minute adjustments can be made. You use historical information in forecasting, staffing, and scheduling. Other critical management information comes from customer surveys, market studies, employees, external departments, telephone networks, workforce management systems, competitors, and the media. Data collection is a continuous process you implement as soon as your telephone system is up and running.
Telephone systems provide detailed report data on every aspect of call transactions. You can program
computer-based telephone systems connected to a Local Area Network (LAN). Users on the LAN can view or print real-time and historical reports. With Web-enabled telephone systems, you can view and generate reports in a Web browser. You can monitor call center activities remotely, and distribute reports to people on different networks.
&ROOHFWLQJGDWDRQFDOOKDQGOLQJ
Call center reporting software displays real-time telephone system data on desktop monitors and wall signs. With real-time data, you can manage current conditions and ensure agents respond to changing call center events. The telephone system provides information on call activity, agent activity, and queue activity.
You can use historical data in forecasting and in assessing the performance of your resources. Historical reports provide vital information on load activity, resource activity, and queue activity. For example, resource activity reports on trunks can tell you the highest number of trunks used during peak traffic periods, and the total duration of calls handled by each trunk for the reporting period. You can determine how busy your trunks are, and whether or not you have the right number of trunks scheduled. You can produce reports categorized by the requirement for call center resources, the reporting period, and by time interval.
CTI provides in-depth information on call transactions. Detailed information on keystroke sequences, databases searched on, and on-screen assistance provides a clear picture of agent activities. With ANI data, you can identify callers by area code and collate information on demographic trends in caller behavior.
Workforce management systems use telephone system data to forecast and schedule agents. Some packages monitor the real-time adherence of agents to scheduled activities, so you know the number of agents currently logged on and available to answer calls. Workforce management systems collect and store real-time
adherence data. This data provides a historical account of adherence used in agent assessment.
Customer surveys provide valuable supporting information on callers’ tolerance to delay, and expectations for service. They address some of the following questions: Was the agent accessible? Was the caller put on hold for too long? Was the agent courteous and responsive to my request? Was the agent well informed? Did the agent provide the correct information and keep commitments? Call centers use this information to estimate the repercussions of poor service: escalated costs, duplication of work, lost customers.
&KDSWHU3ODQQLQJDQGPDQDJLQJ\RXUFDOOFHQWHU
6WHSIRUHFDVWWKHFDOOORDG
Finding the right balance between resources and traffic volumes is a critical step in effective call center management. Estimating resource requirements is particularly challenging as the number of calls and the total duration of calls expected for a given time interval is difficult to predict. Forecasting involves taking historical data generated by your telephone system and using it to predict future traffic volumes and patterns.
7KHLPSRUWDQFHRIIRUHFDVWLQJ
The importance of accurate forecasting can not be overstated. Forecasting is the basis for estimating required resources, such as agents, trunks, and workstations, and impacts call center operations and performance in the following ways:
• The number of blocked and abandoned calls
• The level of service provided to callers and callers’ perception of service • Agent workload, call behavior, and retention
• The accuracy and usefulness of schedules • The success of periodic sales campaigns
Forecasting is an imprecise science. It involves taking a year (or preferably two or three years) of queue traffic data and performing the following steps:
1. Examine trends in call load patterns.
2. Break the information down into monthly, weekly, daily, half-hour, and 15-minute intervals that reflect call load patterns.
3. Determine the handling times of calls.
4. Modify the forecast based on current call center activities and other considerations, such as absenteeism, agent breaks, holidays, and training.
The range of forecast dates you specify depends on the purpose of the forecast. With long-term forecasts, you can estimate future budgets and expansion opportunities, and establish corporate objectives. With short-term forecasts (of one to three months) you can determine seasonal staffing requirements, plan for short-term sales campaigns, and assess upcoming hiring needs. You can use weekly, daily, hourly and half-hour forecasts to tweak agent schedules and adjust for absenteeism.
&RQGXFWLQJDIRUHFDVW
Conducting a forecast involves accurately estimating the three components of call load: talk time, wrap up time, and calls offered. The accuracy of your forecast increases markedly with the size of your data sample. For example, the call load estimate derived from data on 30 agents who receive 950 calls will be more accurate than the call load estimate on 10 agents who receive 280 calls during the same period. Extraneous values for talk time and transient changes in agent availability become less significant as the data sample increases.