132 | P a g e
IMAGE FUSION USING LP AND MR METHODS
C. Rama Mohan
1, Dr S. Kiran
21
Research Scholar, Department of CSE, VTU , Belgaum, (India)
2Assistant Professor Computer Science and Engineering, YSR Engineering College of YVU, (India)
ABSTRACT
One of the important factors in digital image processing is visualization. In visualization information is
transformed into compact form. Laplacian Pyramid methods combine information of images from different
sources. The objective of multiresolution study is to compare different techniques. Multiresolution produces
most accurate efficient information of image. The present paper concentrates on combining the Laplacian
pyramid and multiresolution. The final fused image consist efficient visualization information and technically
giving the better results with performance metrics such as Mean, RMSE, PSNR, and PFE.
Keywords: Fusion, Laplacian pyramid, Multi-Resolution, Visualization, Image Efficiency
I INTRODUCTION
The main aim of image fusion is that to collect relevant information from two or more sources and represent it
in single form. The final form of image always consist relevant information regarding with all sources. To
analyze the information in image fusion is a technique which acquires the data from different sources. In fusion
different sensors are used with different physical features to extract more accurate information. Further seen of
the image analyzed by machine or human visualization perception.
There are so many approaches are available in image fusion but they are basically classified into four categories.
They are
1. Pixel Level
2. Feature Level
3. Decision Level
4. Symbol Level
With respect to studies synthesis approaches also classified into spatial and transform domain methods. In
spatial domain features extracted from the image itself whereas in transform domain coefficients are calculated
for the source on some basis further features are extracted. Multi-Scale techniques are used in most of the fusion
approaches with weighted, scale, average scale methods.
It is essential to consider two factors. Such as reduction of error and improving the clarity in image fusion
algorithms. Optimization algorithms are used to improve the clarity in glow resolution reasons. The main
133 | P a g e
METHODOLOGY
To define image with multiresolution in 1983 Adelson and Burt proposed decomposition method which peaces
the image into multiple sub images with different resolution by executing mathematical functionalities.
Gaussian pyramid is base for Laplacian pyramid, where Multiscale is obtained from iterative low pass filtering
and decimation. Laplacian pyramid is separated into two steps [4]. They are
1. Gaussian pyramid decomposition
2. Laplacian pyramid decomposition
In order to detect huge amount of surplus information generated as of Gaussian pyramid decomposition,
Laplacian pyramid decomposition is applied. Band pass filtering is applied in Laplacian pyramid to get
difference between two adjacent images.
Let G*l is image obtained by Gl-1, where G*l is having same size has Gl-1. The expanding function is
calculated as
G*l = Expand (Gl) Eq - 1
Further the expand operator has been
Eq – 2
Eq – 3
Set
Eq – 4
2.1. Fusion Approach
Laplacian pyramid determines edge of the image at each levels, it is to possible to generate a fused image with
different Laplacian levels by merging outstanding details of each level. Further all the levels information is
integrated has single image which retains information as rich as possible.
Choosing of integration factor by applying fusion rule always reflects on final image of fused image. Generally
to say, there are two methods available in image fusion.
1. Pixel based
2. Region based
In pixel based, there is less computation and visually poor, because local characteristics of image are not each
other, it is essential to design new fusion operator with a neighboring technology is possible in only region
134 | P a g e
Figure.1. Fusion Strategy based on region
2.2. Basic steps in image fusion
1. Generally Laplacian pyramid for each image.
2. Different decomposed pyramid layers are considered separately to fuse the image.
3. To reconstruct the image inverse pyramid transform method is applied for fused image.
2.3. Psedocode
A necessary steps for the algorithm as follows.
For i=1 to n do // every source images
LP decomposition & establish LP for each image.
Endfor
For the Nth level Laplacian pyramid do
If ( DA(m, n) >= DB(m, n) and (EA(m, n) >= EB(m, n)) then
LPFN (m, n) = LPAN (m, n)
Else if(DA(m, n) < DB(m, n)) and (EA(m, n)<EB(m, n) then
LPFN(m, n) = LPBN(m, n)
Else
LPFN(m, n) = (LP A
N(m, n) + LP B
N(m, n))/2
Endif
Endfor
For the further levels Laplacian pyramid do
If ( | REAl(i, j) | >= | REBl(i, j) | ) then
LPFl(m, n) = LPAl(m, n)
Else
LPFl(m, n) =LPBl(m, n)
Endif
Endfor
135 | P a g e
To enhance the feature extraction of the fused image multi-resolution method [3] [1] is applied for Laplacian
pyramid fused image. The below Fig. 2 depict a flow graph of proposed algorithm.
2.4. Steps
1. Read the image of Laplacian pyramid output
2. Find rows and columns
3. Compute the total size
4. Apply DCT for step 3
5. Apply multi-resolution method for step 4
6. Repeat the process until desired ratio is reached.
Figure . 2 Flow Graph Of Proposed Algorithm
III IMAGE SYNTHESIS QUALITY METRICS
It measures the quality of the fused image by taking the set of pre-defined quality indicators for evaluating the
spectral and spatial similarities between the fused image and raw input images. The following quality metrics
such as RMSE, PFE, PSNR, and Mean are used to evaluate the quality of the fused image [2].
3.1. Root Mean Square Error (RMSE)
Eq - 5
It is normally used to comparison the difference between the reference and fused image by directly computing
the variation in pixel values. The combined image is close to the reference image when RMSE value is zero.
RMSE is a good indicator of the spectral quality of fused image. A lower value indicator is superior fusion.
3.2. Peak to Signal Noise Ratio (PSNR)
136 | P a g e
It is widely used metric; it is computed by the number of gray levels in the image divided by the corresponding
pixels in the reference and the fused images. When the value is high, the fused and reference images are similar.
A higher value indicator is superior fusion.
3.3. Percentage Fit Error (PFE):
Eq – 7
It computes the norm of the difference between the corresponding pixels of the reference and fused image to the
norm of the reference image. When the calculated value is zero, it points that both the reference and fused
images are similar and value will be increased when the merged image is not similar to the reference image. A
lower value indicator is superior fusion.
TABLE
1:
PERFORMANCE
EVALUATION
METRICS
TO
EVALUATE
IMAGE
SYNTHESIS
ALGORITHMS
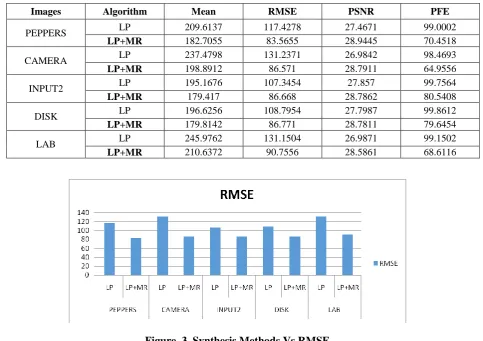
Images Algorithm Mean RMSE PSNR PFE
PEPPERS LP 209.6137 117.4278 27.4671 99.0002
LP+MR 182.7055 83.5655 28.9445 70.4518
CAMERA LP 237.4798 131.2371 26.9842 98.4693
LP+MR 198.8912 86.571 28.7911 64.9556
INPUT2 LP 195.1676 107.3454 27.857 99.7564
LP+MR 179.417 86.668 28.7862 80.5408
DISK LP 196.6256 108.7954 27.7987 99.8612
LP+MR 179.8142 86.771 28.7811 79.6454
LAB LP 245.9762 131.1504 26.9871 99.1502
LP+MR 210.6372 90.7556 28.5861 68.6116
137 | P a g e
Figure. 4. Synthesis Methods Vs Mean
Figure. 5. Synthesis Methods Vs PSNR
Figure. 6. Synthesis Methods Vs PFE
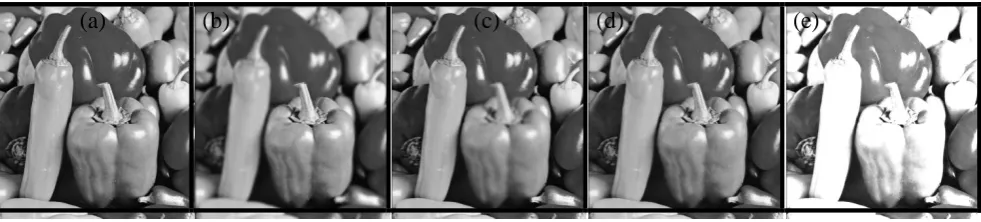
(a)
(b)
(c)
(d)
(e)
Figure .7. Peppers: (a) Ground Truth Image (b) Input Source Image 1 (c) Input Source Image 2
138 | P a g e
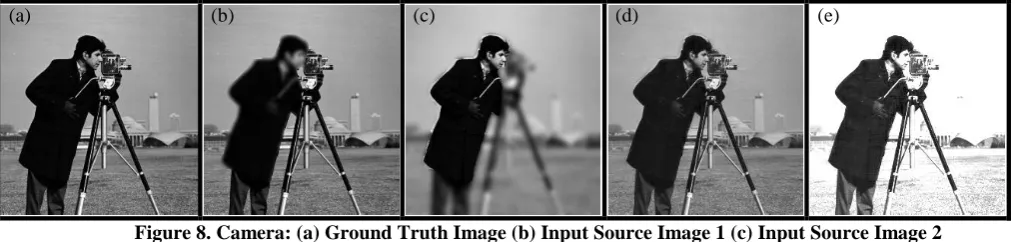
(a) (b) (c) (d) (e)
Figure 8. Camera: (a) Ground Truth Image (b) Input Source Image 1 (c) Input Source Image 2
(d) Fused Image by LP (e) Fused Image by LP +MR
(a)
(b)
(c)
(d)
(e)
Figure .9. Input2: (a) Ground Truth Image (b) Input Source Image 1 (c) Input Source Image 2
(d) Fused Image by LP (e) Fused Image by LP +MR
(a)
(b)
(c)
(d)
(e)
Figure .10. Disk: (a) Ground Truth Image (b) Input Source Image 1 (c) Input Source Image 2
(d) Fused Image by LP (e) Fused Image by LP +MR
(a)
(b)
(c)
(d)
(e)
Figure .11. Lab: (a) Ground Truth Image (b) Input Source Image 1 (c) Input Source Image 2
139 | P a g e
IV CONCLUSION
The advantage of Laplacian pyramid is that it extracts more information related with edges at each level. The
proposed fusion method assures the better quality with the help of multi-resolution method. Analysis part has
been done to validate quality with metrics such as Mean, RMSE, PSNR, PFE, etc. further work may be extended
with DWT or Hybrid DWT methods to achieve better quality.
REFERENCES
[1] V.P.S. Naidu, “Discrete Cosine Transform-based Image Fusion,” Defence Science Journal, Vol. 60,
No. 1, January 2010, PP. 48-54.
[2] Jagalingam P, Arkal Vittal Hegde, “A review of Quality Metrics for Fused Images,” Elsevier
transaction, Aquatic Procedia 4 (2015) 133 – 142.
[3] Safdar Ali Syed Abedi, “Exploring Discrete Cosine Transform for Multi-resolution Analysis”, Georgia
State University, 2005.
[4] Wencheng Wang and Faliang Chang, “A Multi-focus Image Fusion Method Based on Laplacian