209 | P a g e
NON-LINEAR ANALYSIS AND PERFORMANCE BASED
RETROFIT USING SHEAR WALLS OF FRAME
STRUCTURE
Ms. Subhashini S. Ramteke
Assistant Professor
Department of Civil Engineering, D.Y.Patil College of Engineering
Savitribai Phule Pune University, Pune, (India)
ABSTRACT
The Buildings, which appeared to be strong enough, may crumble like houses of cards during earthquake and
deficiencies may be exposed. In last decade, four devastating earthquakes of world have been occurred in India, and
low to mild intensities earthquakes are shaking our land frequently. Experience gain from the recent earthquake of
Bhuj, 2001 demonstrates that the most of buildings collapsed were found deficient to meet out the requirements of
the present day codes. Under such circumstances, seismic qualification of existing buildings has become extremely
important. Seismic qualification eventually leads to retrofitting of the deficient structures. In this paper a seismic
retrofit using shear wall based on the pushover analysis will be proposed for the life-safety target performance of
the existing building. A nonlinear static pushover analysis using the displacement coefficient method, as described
in FEMA 356, is used to evaluate the seismic performance of the existing building. The traditional methods of
seismic retrofitting are reviewed and their weak points are identified. Repairs can lead to increased stiffness,
strength, and failure-deformation. Finally, general concluding remarks are made along with possible future
direction of research.
Keywords: A Nonlinear Static Pushover Analysis, Performance Factor, Shear Walls, RC Building, Seismic
Retrofitting
1. INTRODUCTION
210 | P a g e
building. Hence evaluation of existing RC buildings in India is a growing concern. It is important to estimate the response of buildings under earthquakes from the viewpoint of life reservation and risk management. The adequacy and the performance of the building are checked with the codal provisions of IS 1893:2002. A procedure for evaluating the seismic performance of existing building in India is proposed. The procedure is based on the capacity spectrum method (ATC 40) and is intended to provide practicing engineers with a methodology for determining the performance level of the building. The distribution of lateral forces used in pushover analysis is as given in FEMA 356 [6]. The approach has been developed by many researchers with minor variation in computation procedure. Since the behavior of reinforced concrete structures may be highly inelastic under seismic loads, the global inelastic performance of RC structures will be dominated by plastic yielding effects and consequently the accuracy of the pushover analysis will be influenced by the ability of the analytical models to capture these effects.[1]
II PUSHOVER METHODOLOGY
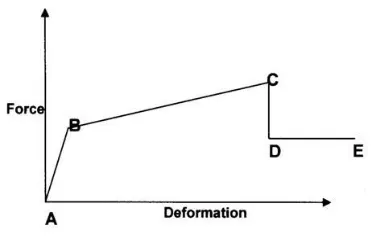
The analysis is performed using the tool SAP2000. The pushover analysis follows the nonlinear static procedure. It essentially adopts the capacity spectrum method proposed by ATC-40 [5]. This method of evaluation considers two aspects, the performance of a structure during seismic event, and the capacity of the structure. The structure has been idealized as a 3D finite element model constructed with elastic frame elements having point plasticity at the possible plastic hinge locations. A lateral force distribution in accordance with IS 1893:2002 is applied to the analytical model. The force deformation relationship is defined as per the ATC-40 guidelines which follows the convention below [2].
Figure 2.1. Typical Force Deformation relationship
III ELEMENT DESCRIPTION OF SAP 2000
211 | P a g e
element. The ordinate at C corresponds to nominal strength and abscissa at C corresponds to the deformation at which significant strength degradation begins. The drop from C to D represents the initial failure of the element and resistance to lateral loads beyond point C is usually unreliable. The residual resistance from D to E allows the frame elements to sustain gravity loads. Beyond point E, the maximum deformation capacity, gravity load can no longer be Sustained. Hinges can be assigned at any number of locations along the span of the frame element as well as element ends. The built-in default hinge properties for steel and concrete members are based on ATC-40 [5] and FEMA-273 [6] criteria. User-defined hinge properties can be based on default properties or they can be fully user-defined.
3.1 Capacity
The overall capacity of a structure depends on the strengthand deformation capacities of the individual components of the structure. A Pushover analysis procedure uses a series of sequential elastic analysis, superimposed to approximate a force displacement capacity diagram of the overall structure. The mathematical model of the structure is modified to account for reduced resistance of yielding components. A lateral force distribution is again applied until a predetermined limit is reached. Pushover capacity curves approximate how structure behaves after exceeding the elastic limits.
3.2 Demand (Displacement)
Ground motions during an earthquake produce complexhorizontal displacement patterns in structure that may vary with time. Tracking this motion at every time step to determine structural design requirements is judged impractical. For nonlinear method it is easier and more direct to use a set of lateral displacement as a design condition for a given structure and ground motion, the displacement is an estimate of the maximum expected response of the building during ground motion.
3.3 Performance
Once a capacity curve and demand displacement is defined, a performance check can be done. A performance verifies that structural & non-structural components are not damaged beyond the acceptable limits of performance objectives for the forces and displacement implied by the displacement demand.
IV SEISMIC RETROFITTING
212 | P a g e
where low or repairable structural and non-structural damage is expected for moderate earthquake excitations, and (iii) Collapse Prevention (CP) PL where irreparable or hardly repairable structural and nonstructural damage but no collapse is expected for major earthquake excitations [10]
Existing building can become seismically deficient When, a) Seismic design code requirements are up graded since the design of these buildings is with an older version of the code, b) Seismic design codes used in their design are deficient, c) Engineering knowledge makes advances rendering insufficient the previous understanding used in their design, and d) Designers lack understanding of the seismic behavior of the structures. Indian buildings built over the past two decades are deficient because of items (b), (c) and (d) above. The last revision of the Indian seismic code in 1987 IS 1893 (1984) [7] is deficient from many points of view, and engineering knowledge has advanced significantly from what was used.
V PROBLEM FORMULATION
The 6 storey existing building is considered in this study. This structure is designed according to Indian Code IS1893:2002 and is located in Zone V and Imposed load taken as 3.5. The material properties are M20Grade concrete, Fe 415 steel for the yield strength of the longitudinal and transverse reinforcement. The plan layout is shown in Figure 5.1.The typical floor height is 3.2m and the details of beams and columns are shown in table1.
Figure 5.1 Plan of Building
Table 1. Specification
SIZE OF BEAMS (mm) SIZE OF COLUMN (mm)
230 X 450 230 X 380
230 X 350 230 X 400
230 X 300 230 X 450
150 X 450 230 X 500
213 | P a g e
5.1 Modelling Approach
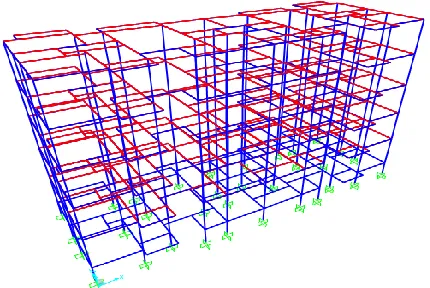
The general finite element package SAP 2000 has been used for the analyses. A three-dimensional model of each structure has been created to undertake the non-linear analysis. The existing model shown in figure 5.1.1. Beams and columns are modeled as nonlinear frame elements with lumped plasticity at the start and the end of each element. SAP 2000 provides default-hinge properties and recommends PMM hinges for columns and M3 hinges for beams as described in FEMA-356.
Figure 5.1.1 Isometric View of Building
Pushover case: Building analyze by Static Nonlinear analysis without shear wall.
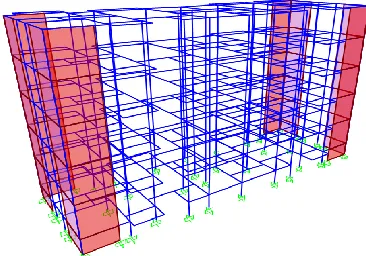
Case 1: The structure having shear wall at the lift duct of the building by using Pushover Analysis Shown in Fig a.
Case 2: The structure having shear wall at the corners of the building by using Pushover Analysis Shown in Fig. b.
Case 3: The structure having shear wall at the intermediate side of the building by using Pushover Analysis Shown in Fig. c.
Figure a. Building with Shear Wall at Lift duct
Figure b. Building with Shear Wall at
214 | P a g e
Figure c. Building with Shear Wall at Corners
VI ANALYSIS RESULT
In the present study, non-linear response of existing RC frame building using SAP 2000 under the loading has been carried out. The objective of this study is to see the variation of load-displacement graph and check the maximum base shear and displacement of the frame. After running the analysis, the pushover curve is obtained which gives the performance point of the structure in both X and Y direction as shown in figures 6.1, 6.2, 6.3 & 6.4.
Figure 6.1 Capacity Spectrum Curve of an Existing Building in X direction
215 | P a g e
Figure 6.3 Capacity Spectrum Curve of an Existing Building in Y direction
Figure 6.4 Pushover Curve of an Existing Building in Y direction
After Pushover analysis hinges formation in each stage of a building are calculated, also from figure 6.1 and figure 6.3 it is obvious that the demand curve tend to intersect the capacity curve near the event point, which means an elastic response and the security margin is greatly enhanced. Therefore, it can be concluded that the margin safety against collapse is high and there are sufficient strength and displacement reserves seen to exhibit abrupt changes in storey drifts, which is highly undesirable. To improve the seismic performance of existing building, shear walls are proposed and the analysis is carried out for existing building with shear walls at various directions. The analysis results are demonstrated with the help of figures and charts. After running the analysis of building with shear walls at different location gives the coordinates of each step of the pushover curve as shown in tables and graphs.
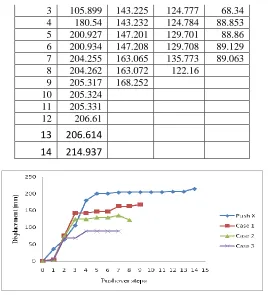
Table 2 :Tabular data for pushover curve of building using shear walls at various location in X direction.
Steps Push X Case 1 Case 2 Case 3
0 0 0 0 0
216 | P a g e
3 105.899 143.225 124.777 68.34 4 180.54 143.232 124.784 88.853 5 200.927 147.201 129.701 88.86 6 200.934 147.208 129.708 89.129 7 204.255 163.065 135.773 89.063 8 204.262 163.072 122.16 9 205.317 168.252 10 205.324 11 205.331 12 206.61
13
206.614
14
214.937
Displacement of Floor at Various Steps in X Direction
Table :Tabular data for pushover curve of building using shear walls at various location in Y
direction.
Steps Push Y Case 1 Case 2 Case 3 0 6.99 2.45 0.02 0.68 1 9.73 4.43 3.13 3.35 2 74.42 48.01 74.68 57.01 3 145.94 111.72 118.45
4 218.75 185.01 118.46 5 281.55 202.67 118.46
6 122.91
217 | P a g e
Displacement of Floor at Various Steps in Y Directions
VII DISCUSSION AND CONCLUSION
For buildings that needed to be rehabilitated, it is easy to investigate the effect of different strengthening and retrofitting schemes. By using pushover analysis we can select the suitable strengthening and retrofitting schemes by changing member properties of weaker sections and carrying out the analysis again. For retrofitting pushover analysis provides better and economical solution as compared to other methods. In that case, we can restrengthen the structure by providing shear walls which provides an excellent mechanism for energy dissipation.
In this paper, building having shear walls at different location have been analyzed by pushover analysis to study their behavior when subjected to lateral loads. The behavior of properly detailed reinforced concrete frame building is adequate as indicated by the intersection of the demand and capacity curves and the distribution of hinges in the beams and the columns. Most of the hinges developed in the beams and few in the columns. The floor displacement is maximum for building frame without Shear wall as compared to building frame with shear wall. In the building frame, floor displacement is minimum for shear wall placed at corner then at intermediate and compare to maximum when shear wall at lift duct. From above discussion it is concluded that in shear wall system deflection is less compare to without shear wall and the base shear is also reduced in considering the shear wall. So from economic point of view we can provide shear walls at corners of building to the structure to resist the seismic forces without compromising with strength and stiffness of the structure.
REFERENCES
1)
V.S.R. Pavan Kumar. Rayaprolu, P. Polu Raju, Incorporation of Various Seismic Retrofitting Techniques218 | P a g e
2)
P. Poluraju, Pushover Analysis Of Reinforced Concrete Frame Structure Using SAP 2000, InternationalJournal of Earth Sciences and Engineering ISSN 0974-5904, Volume 04, No 06 SPL, October 2011, pp.
684-690
3)
Joseph M. Bracci, Sashi K. Kunnath, and Andrei M. Reinhorn, Asce, Seismic performance and retrofitevaluation of reinforced concrete structures, Journal of structural engineering, Vol. 123, No. 1, January 1997
4)
Vijayakumar. A, Venkatesh Babu. D.L, A survey of methods and techniques used for Seismic retrofittingof RC buildings, International Journal of Civil and Structural Engineering volume 2, no 1, 2011
5)
ATC (1996). Seismic Evaluation and Retrofit of Concrete Buildings, Volume 1, ATC – 40 Report, AppliedTechnology Council, Redwood City, California.
6)
FEMA (1997). NEHRP Guidelines for the Seismic Rehabilitation of Buildings, Developed by the BuildingSeismic Safety Council for the Federal Emergency Management Agency (Report No. FEMA 273), Washington, D.C)
7)
IS: 1893 (Part1): 2002. “Criteria for earthquake resistant design of structure” Bureau of Indian Standards,New Delhi.
8)
IS: 456 (2000) “Indian standard code of practice for plain reinforced concrete” Bureau of Indianstandards, New Delhi.
9)
Giuseppe Oliveto and Massimo Marletta, Seismic Retrofitting Of Reinforced Concrete Buildings UsingTraditional And Innovative Techniques ,ISET Journal of Earthquake Technology, Paper No. 454, Vol. 42, No. 2-3, June-September 2005, pp. 21-46
10)
N. Lakshmanan, Seismic Evaluation And Retrofitting Of Buildings And Structures ,ISET Journal ofEarthquake Technology, Paper No. 469, Vol. 43, No. 1-2, March-June 2006, pp. 31-48
11)
R.S. Londhe* and A.P. Chavan, Behaviour Of Building Frames With Steel Plate shear Walls, AsianJournal Of Civil Engineering (Building And Housing) Vol. 11, No. 1 (2010) Pages 95-102
12)
T. Mahdi and A. Mahdi, Reconstruction and Retrofitting of Buildings after Recent Earthquakes in Iran, The2nd International Conference on Rehabilitation and Maintenance in Civil Engineering,
www.sciencedirect.com