http://dx.doi.org/10.4236/am.2014.58119
A Fixed Suppressed Rate Selection Method
for Suppressed Fuzzy C-Means Clustering
Algorithm
Jiulun Fan1, Jing Li1,2
1School of Communication and Information Engineering, Xi’an University of Posts and Telecommunications,
Xi’an, China
2School of Electronic Engineering, Xidian University, Xi’an, China
Email: [email protected], [email protected]
Received 9 March 2014; revised 9 April 2014; accepted 16 April 2014 Copyright © 2014 by authors and Scientific Research Publishing Inc.
This work is licensed under the Creative Commons Attribution International License (CC BY). http://creativecommons.org/licenses/by/4.0/
Abstract
Suppressed fuzzy c-means (S-FCM) clustering algorithm with the intention of combining the higher speed of hard c-means clustering algorithm and the better classification performance of fuzzy c-means clustering algorithm had been studied by many researchers and applied in many fields. In the algorithm, how to select the suppressed rate is a key step. In this paper, we give a method to select the fixed suppressed rate by the structure of the data itself. The experimental results show that the proposed method is a suitable way to select the suppressed rate in suppressed fuzzy c-means clustering algorithm.
Keywords
Hard C-Means Clustering Algorithm, Fuzzy C-Means Clustering Algorithm, Suppressed Fuzzy C-Means Clustering Algorithm, Suppressed Rate
1. Introduction
HCM in the terms of partition quality, at the cost of a slower convergence. In spite of this drawback, FCM is one of the most popular clustering algorithms. Many researchers have studied the convergence speed and parameter selection of FCM and elaborated various solutions to reduce the execution time [4]-[8].
As another way to speed up the FCM calculations, we proposed an algorithm, named as suppressed fuzzy c-means clustering (S-FCM) algorithm [9], to reduce the execution time of FCM by improving the convergence speed, while preserving its good classification accuracy. S-FCM established a relationship between the HCM and FCM with the suppressed rate α
(
0≤ ≤α 1)
: S-FCM becomes HCM when α =0 and FCM when α =1. The S-FCM algorithm is not optimal from a rigorous mathematical point of view, as it does not minimize the objective function. In order to study this problem, Szilágyi et al. defined a new objective function with parameterα
and named it optimally suppressed fuzzy c-means (Os-FCM) clustering algorithm [10]-[12]. Os-FCM cluster- ing algorithm is converged. By numerical tests, they claimed: we cannot take for granted the optimality or non-optimality of S-FCM, but we can assert that it behaves very similar to an optimal clustering model (Os-FCM).The problem of selecting a suitable parameter
α
in S-FCM constitutes an important part of implementing the S-FCM algorithm for real applications. The implementation performance of S-FCM may be significantly de-graded if the parameterα
is not properly selected. It is therefore important to select a suitable parameterα
such that the S-FCM algorithm can take on the advantages of the fast convergence speed of the HCM as well as the superior partition performance of the FCM. Huang et al. proposed a modified S-FCM, named as MS-FCM, to determine the parameterα
with type-driven learning.α
is updated each iteration and successful used in MRI segmentation [13]. And then there are many researchers pay close attention to parameter selection, just like Huang et al. gave Cauchy formula [14], Nyma et al. gave exponent formula [15], Li et al. gave fuzzy deviation exponent formula [16], and Saad et al. gave the clarity formula [17]. However, these selection strategy made the parameterα
is changed in each iteration. For the fixed selection case, we simple set α=0.5 in the original paper. In this paper, we are further interesting on the fixed selection ofα
based on the data structure.The remainder of the paper is organized as follows: Section 2 and Section 3 introduce FCM clustering algo-rithm and S-FCM clustering algoalgo-rithm respectively. In Section 4, a method to select the parameter
α
based on the data structure is stated. Section 5 reports experimental analysis on the performances of the new selection method with some related algorithms and the conclusions are presented in Section 6.2. Fuzzy C-Means Clustering Algorithm
FCM is one of the most widely used fuzzy clustering algorithms. It can be presented by the following mathe-matics programming.
The traditional FCM partitions a set of object data into a number of c clusters based on the minimization of a quadratic objective function. The objective function to be minimized is:
2 2
1 1 1 1
c n c n
m m
FCM ij j i ij ij
i j i j
J u x v u d
= = = =
=
∑∑
− =∑∑
(1)where xj represents the input data
(
j=1,,n)
, vi represents the prototype of center value or representa-tive element of cluster(
i=1,,c)
, uij∈[ ]
0,1 is the fuzzy membership function showing the degree to which vector xj belongs to cluster i, m>1 is the fuzzy factor parameter, and dij represents the distance between vector xj and cluster prototype vi. According to the definition of fuzzy sets, the fuzzy memberships of any input vector xj satisfy the probability constraint1 1 c
ij i
u
=
=
∑
(2)The minimization of the objective function JFCM is achieved by alternately applying the optimization of
FCM
J over
{ }
uij with vi fixed(
i=1,,c)
and the optimization of JFCM over{ }
vi with uij fixed(
i=1,, ,c j=1,,n)
. During each cycle, the optimal values are deduced from the zero gradient conditions, and obtained as follows:(
)
2 1
2 1
1
1, , , 1, , m
ij ij c
m kj k
d
u i c j n
d
− −
− − =
= = =
(
)
1 1 1, , n m ij j j i n m ij j u xv i c
u
=
=
=
∑
=∑
(4)According to the AO scheme of the FCM clustering algorithm, Equations (3) and (4) are alternately applied, until cluster prototypes stabilize. This stopping criterion compares the sum of norms of the variations of the prototype vectors vi within the latest iteration T, with a predefined small threshold value
ε
.FCM clustering algorithm:
Sept 1. Fix m>1, 1< < −c n 1 and initialize the c cluster centers vi randomly. REPEAT.
Sept 2. Update U=
{ }
uij by Equation (3).Sept 3. Update V =
{ }
vi by Equation (4). UNTIL (cluster centers stablized).3. Suppressed Fuzzy C-Means Clustering Algorithm
The suppressed fuzzy c-means algorithm was introduced in [9], having the declared goal of improving the con- vergence speed of FCM, while keeping its good classification accuracy. The algorithm modified the AO scheme of FCM, by inserting an extra computational step between the application of formulae (3) and (4). Considering
j
x , if the degree of membership of xj belongs to pth cluster is the biggest of all the clusters, the value is noted as upj. After modified, the memberships are:
1 1 ,
,
ij pj
i p ij
ij
u u i p
u
u i p
α α α
α ≠ − = − + = = ≠
∑
(5)The fuzzy memberships are then modified such a way that all nonwinner values are decreased via multiplying by a so-called suppression rate α
(
0≤ ≤α 1)
; and the winner membership is increased accordingly, so that the probability constraint given in Equation (5) is fulfilled by the modified memberships.S-FCM clustering algorithm:
Sept 1. Fix 0≤ ≤α 1, m>1, 1< < −c n 1 and initialize the c cluster centers vi randomly. REPEAT.
Sept 2. Update U=
{ }
uij by Equation (3).Sept 3. Modify U =
{ }
uij by Equation (5).Sept 4. Update V =
{ }
vi by Equation (4). UNTIL (cluster centers stablized).4. The Fixed Selection of Suppression Rate
α
In the original S-FCM, the suppression rate
α
is set the middle of interval, i.e., α=0.5, it can be consider a compromise with FCM and HCM. So we think that the better method to selectα
is based on the data distribu-tion structure.For the data set X =
{
x x1, 2,,xn}
, think of1 1 n j j x x n = −
∑
(where 1n j j x x n =
=
∑
reflects the averagedis-tance of all the data points to the mean of data, 2
1 1
1 n n j r j r
x x
n = =
−
∑∑
reflects the average distance of all the datapoints. We have
2 1 1 1 1 1 2 1 n n j r j r n j j x x n x x n = = = − ≤ ≤ −
∑∑
∑
, so we can set2 1 1 1 1 1 1 n n j r j r n j j x x n x x n
α = =
=
−
= −
−
∑∑
proof is written in Appendix.
5. Experimental Studies
We make experimental studies in this section to show the performances of the new fixed selection method for
α
. The S-FCM with2 1 1
1
1
1 1
n n
j r j r
n
j j
x x
n
x x
n
α = =
=
−
= −
−
∑∑
∑
is noted as S-FCM*. We make a comparison of the new ap-proach with some algorithms: FCM, S-FCM. We work with Matlab version 8.0, a computer with 2 processors Genuine Intel of 3.0 GHz frequency, memory 1.0 G and hard disk of 500 G capacity. The parameters we used for these algorithms are: maximal number of iterations T = 200, ε = −1e 5.
5.1. Synthetic Datasets
In this section, we perform some experiments to compare the performances of these algorithms with synthetic datasets. In order to examine and compare the performance of FCM, S-FCM, S-FCM*, the following criterias are used. These are the number of iterations, iteration time until convergence and classification rate. These algo-rithms are started with the same initial values and stopped under the same condition.
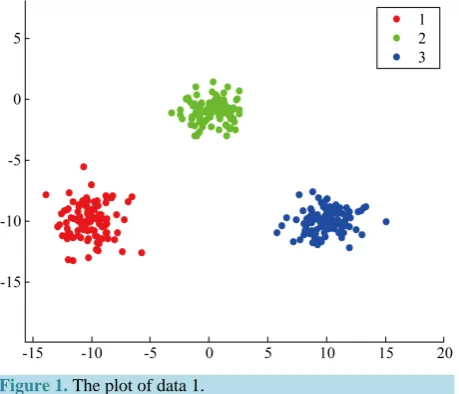
The three artificial datas involves three clusters each with 100 points under multivariate normal distribution are named as data 1, data 2 and data 3 respectively. The parameters used for generating data 1 is: µ1 = −
[
10, 10−]
,1
2, 0.2 0.2, 2
=
∑
; µ2 =
[
0, 1−]
, 22, 0 0,1
=
∑
and µ3=
[
10, 10−]
, 33, 0 0,1
=
∑
, and is showed in Figure 1. And
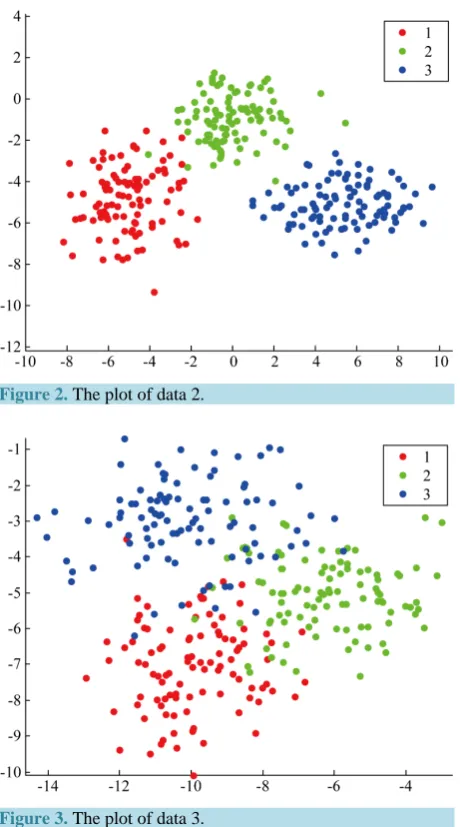
then, we move the three cluster’s center closer by µ1= − −
[
5, 5]
, µ2 =[
0, 1−]
and µ3 =[
4, 4−]
to obtain the data 2 and is showed in Figure 2. Further, we set the three cluster’s center more closer to each others by[
]
1 10, 7
µ = − − , µ2= − −
[
6, 5]
and µ3= −[
10, 3−]
to obtain the data 3 and is showed in Figure 3.We get the value of α=0.27 for data 1, the value of α=0.33 for data 2 and the value of α=0.38 for data 3 used for S-FCM*.
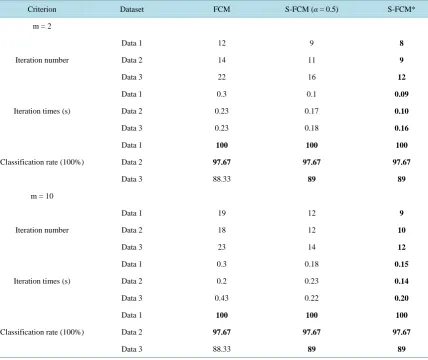
[image:4.595.200.430.523.720.2]In cluster analysis, three important criterions to test the performances of clustering algorithm are iteration number, iteration times (s) and classification rate. For the data 1, three clusters are well-separated, thus a small value of
α
is hoped, we get the value of α=0.27 for S-FCM*. It had shown in Table 1 that S-FCM* has minimum iteration number and iteration times (s), and the classification rate of FCM, S-FCM and S-FCM* are all 100%. For data 2, we move the clusters closer slightly, thus a slightly larger value ofα
is hoped, we get the value of α=0.33 for S-FCM*. It had shown in Table 1 that S-FCM* has minimum iteration number and iteration times (s), and the classification rate of FCM, S-FCM and S-FCM* are all 97.67%. For data 3, we move theFigure 2.The plot of data 2.
Figure 3. The plot of data 3.
clusters more closer each other, thus a larger value of
α
is hoped, we get the value of α=0.38 for S-FCM*. It had shown in Table 1 that S-FCM* has minimum iteration number and iteration times (s), and the classifica-tion rate of S-FCM and S-FCM* are all 89%, which is better than the classificaclassifica-tion rate of FCM with 88.33%. The fuzzy factor m = 2 and m = 10 are used to compare the results.As supported by the experiments, it indicates that S-FCM* improves the convergence speed while preserving its good classification accuracy compared with S-FCM.
5.2. UCI Machine Learning Datasets
In this section, we perform experiments on a number of UCI Machine Learning data sets [18], which is Iris, Wine, Ionosphere, Sonar, GCM_efg and Leukemia. Iris plants data is the best-known data sets to be found in pattern recognition literature. The iris consists of 150 label vectors of four dimensions. Wine data consists of 178 label vectors of 13 dimensions. Ionosphere data consists of 351 vectors of 34 dimensions. Sonar data con-sists of 208 vectors of 60 dimensions. GCM_efg and the Leukemia are high-dimensional data sets. GCM_efg data consists of 43 vectors of 16,063 dimensiona and Leukemia data consists of 72 vectors of 7129 dimensions. We test the performances hundred times, average result (iteration number, iteration times and classification rate) are given in Table 2.
Table 1. Computational performances of FCM, S-FCM and S-FCM*.
Criterion Dataset FCM S-FCM (α = 0.5) S-FCM*
m = 2
Iteration number
Data 1 12 9 8
Data 2 14 11 9
Data 3 22 16 12
Iteration times (s)
Data 1 0.3 0.1 0.09
Data 2 0.23 0.17 0.10
Data 3 0.23 0.18 0.16
Classification rate (100%)
Data 1 100 100 100
Data 2 97.67 97.67 97.67
Data 3 88.33 89 89
m = 10
Iteration number
Data 1 19 12 9
Data 2 18 12 10
Data 3 23 14 12
Iteration times (s)
Data 1 0.3 0.18 0.15
Data 2 0.2 0.23 0.14
Data 3 0.43 0.22 0.20
Classification rate (100%)
Data 1 100 100 100
Data 2 97.67 97.67 97.67
Data 3 88.33 89 89
Wine data; α=0.43 for the Ionosphere data; α=0.43 for the Sonar data; α=0.42 for the GCM_efg data and α=0.36 for the Leukemia data.
For Iris data, we can seen that that S-FCM* has minimum iteration number and iteration times (s) on average means, and the classification rate of S-FCM and S-FCM* are all 88.67%, which is better than the classification rate of FCM with 88%. For Wine data, we can seen that that S-FCM* has minimum iteration number and itera-tion times (s) on average means, and the classificaitera-tion rate of S-FCM and S-FCM* are all 69.54%, which is bet-ter than the classification rate of FCM with 68.54%. For Ionosphere data, we can seen that that S-FCM* has minimum iteration number and iteration times (s) on average means, and the classification rate of S-FCM and S-FCM* are all 70.66%, which is better than the classification rate of FCM with 69.8%. For GCM_efg data, we can seen that that S-FCM* has minimum iteration number and iteration times (s) on average means, and the classification rate of S-FCM and S-FCM* are all 74.42%, which is better than the classification rate of FCM with 69.77%. For Leukemia data, we can seen that that S-FCM* has minimum iteration number and iteration times (s) on average means, and the classification rate of S-FCM and S-FCM* are all 87.5%, which is better than the classification rate of FCM with 69.44%. For Sonar data, we can seen that that S-FCM* has minimum iteration number and iteration times (s) on average means, and the classification rate of FCM and S-FCM* are all 55.77%, which is better than the classification rate of S-FCM with 55.29%, this means that set α =0.5 don’t always a good selection. The fuzzy factor m = 2 and m = 10 are used to compare the results.
6. Conclusion
Table 2. The average number of computational performances of FCM, S-FCM, S-FCM* with 100 runs.
Criterion Data FCM S-FCM (α = 0.5) S-FCM*
m = 2
Iteration number
Iris 34 22 16
Wine 45 28 22
Ionosphere 15 14 11
Sonar 42 19 16
GCM_efg 171 28 19
Leukemia 65 25 20
Iteration times (s)
Iris 0.21 0.08 0.07
Wine 0.23 0.09 0.08
Ionosphere 0.36 0.31 0.30
Sonar 0.25 0.21 0.19
GCM_efg 13.6 2.78 2.28
Leukemia 2.95 0.77 0.65
Classification rate (100%)
Iris 88 88.67 88.67
Wine 68.54 69.66 69.66
Ionosphere 69.8 70.66 70.66
Sonar 55.77 55.29 55.77
GCM_efg 69.77 74.42 74.42
Leukemia 69.44 87.5 87.5
m = 10
Iteration number
Iris 25 17 15
Wine 49 20 18
Ionosphere 16 14 13
Sonar 42 19 16
GCM_efg 141 31 29
Leukemia 37 17 15
Iteration times (s)
Iris 0.13 0.04 0.04
Wine 0.28 0.18 0.10
Ionosphere 0.41 0.38 0.23
Sonar 0.29 0.22 0.19
GCM_efg 12.5 2.94 1.56
Leukemia 2.94 1.35 1.24
Classification rate (100%)
Iris 88 88.67 88.67
Wine 68.54 69.66 69.66
Ionosphere 69.8 70.66 70.66
Sonar 55.77 55.29 55.77
GCM_efg 69.77 74.42 74.42
algorithm called S-FCM*, the method to select the fixed suppressed rate by the structure of the data itself. The experimental results show that the proposed method is a better way to select the suppressed rate in suppressed fuzzy c-means clustering algorithm. The S-FCM* improves the convergence speed, while preserving its good classification accuracy on average sense.
Acknowledgements
This work is supported by the National Science Foundation of China (Grant No. 61340040).
References
[1] Bezdek, J.C. (1981) Pattern Recognition with Fuzzy Objective Function Algorithms. Plenum Press, New York. http://dx.doi.org/10.1007/978-1-4757-0450-1
[2] Yu, J. and Yang, M.-S. (2005) Optimality Test for Generalized FCM and Its Application to Parameter Selection. IEEE Transactions on Fuzzy Systems, 13, 164-176. http://dx.doi.org/10.1109/TFUZZ.2004.836065
[3] Cannon, R.L., Dave, J.V. and Bezdek, J.C. (1986) Efficient Implementation of the Fuzzy c-Means Clustering Algo- rithm. IEEE Transactions on Pattern Analysis and Machine Intelligence, 8, 248-255.
http://dx.doi.org/10.1109/TPAMI.1986.4767778
[4] Hathaway, R.J. and Bezdek, J.C. (1995) Optimization of Clustering Criteria by Reformulation. IEEE Transactions on Fuzzy Systems, 3, 241-245. http://dx.doi.org/10.1109/91.388178
[5] Kolen, J.F. and Hutcheson, T. (2002) Reducing the Time Complexity of the Fuzzy c-Means Algorithm. IEEE Transac- tions on Fuzzy Systems, 10, 263-267. http://dx.doi.org/10.1109/91.995126
[6] Kwok, T., Smith, K., Lozano, S. and Taniar, D. (2002) Parallel Fuzzy c-Means Clustering for Large Data Sets. Euro- Par 2002 Parallel Processing, Springer, Berlin, 365-374. http://dx.doi.org/10.1007/3-540-45706-2_48
[7] Lázaro, J., Arias, J., Martín, J., Cuadrado, C. and Astarloa, A. (2005) Implementation of a Modified Fuzzy c-Means Clustering Algorithm for Real-Time Applications. Microprocessors and Microsystems, 29, 375-380.
http://dx.doi.org/10.1016/j.micpro.2004.09.002
[8] Cheng, T.W., Goldgof, D.B. and Hall, L.O. (1998) Fast Fuzzy Clustering. Fuzzy Sets and Systems, 93, 49-56. http://dx.doi.org/10.1016/S0165-0114(96)00232-1
[9] Fan, J., Zhen, W. and Xie, W. (2003) Suppressed Fuzzy C-Means Clustering Algorithm. Pattern Recognition Letters, 24, 1607-1612. http://dx.doi.org/10.1016/S0167-8655(02)00401-4
[10] Szilágyi, L., Szilágyi, S.M. and Benyo, Z. (2010) Analytical and Numerical Evaluation of the Suppressed Fuzzy c-Means Algorithm: A Study on the Competition in c-Means Clustering Models. Soft Computing, 14, 495-505. http://dx.doi.org/10.1007/s00500-009-0452-y
[11] Szilágyi, L., Szilágyi, S.M. and Benyo, Z. (2008) Analytical and Numerical Evaluation of the Suppressed Fuzzy c-Means Algorithm. Lecture Notes in Computer Science, 5285, 146-157.
http://dx.doi.org/10.1007/978-3-540-88269-5_14
[12] Szilágyi, L., Szilágyi, S.M. and Benyo, Z. (2008) A Thorough Analysis of the Suppressed Fuzzy C-Means Algorithm, Progress in Pattern Recognition, Image Analysis and Applications. Lecture Notes in Computer Science, 5197, 203-210. http://dx.doi.org/10.1007/978-3-540-85920-8_25
[13] Hung, W.L., Yang, M.S. and Chen, D.H. (2006) Parameter Selection for Suppressed Fuzzy C-Means with an Applica- tion to MRI Segmentation. Pattern Recognition Letters, 27, 424-438. http://dx.doi.org/10.1016/j.patrec.2005.09.005
[14] Hung, W.-L. and Chang, Y.-C. (2006) A Modified Fuzzy C-Means Algorithm for Differentiation in MRI of Ophthal- mology, Modeling Decisions for Artificial Intelligence. Lecture Notes in Computer Science, 3885, 340-350.
http://dx.doi.org/10.1007/11681960_33
[15] Nyma, A., Kang, M., Kwon, Y.-K., Kim, C.-H. and Kim, J.-M. (2012) A Hybrid Technique for Medical Image Seg- mentation. Journal of Biomedicine and Biotechnology, 2012, Article ID: 830252.
http://dx.doi.org/10.1155/2012/830252
[16] Li, Y. and Li, G. (2010) Fast Fuzzy c-Means Clustering Algorithm with Spatial Constraints for Image Segmentation, Advances in Neural Network Research and Applications. Lecture Notes in Electrical Engineering, 67, 431-438. http://dx.doi.org/10.1007/978-3-642-12990-2_49
[17] Saad, M.F. and Alimi, A.M. (2010) Improved Modified Suppressed Fuzzy C-Means. 2nd International Conference on Image Processing Theory, Tools and Applications (IPTA), Paris, 7-10 July 2010, 313-318.
Appendix
Theorem: 2 1 1 1 1 1 2 1 n n j r j r n j j x x n x x n = = = − ≤ ≤ −∑∑
∑
.Proof: For the data set X =
{
x x1, 2,,xn}
, we have xj−xr ≤ xj−x + xr−x , where 1 n j j x x n ==
∑
. Thus1 1
n n
j r j r
r r
x x n x x x x
= =
− ≤ − + −
∑
∑
and
1 1 1 1
n n n n
j r j r
j r j r
x x n x x n x x
= = = =
− ≤ − + −
∑∑
∑
∑
.That is
1 1 1
2
n n n
j r j
j r j
x x n x x
= = = − ≤ −
∑∑
∑
. This means 2 1 1 1 1 2 1 n n j r j r n j j x x n x x n = = = − ≤ −∑∑
∑
.In other side,
(
)
1
1 1
1 1 1 1 1
1 1 1 1
1 1
1 1
n
n n n n n
j n n
j
r r r j j r j j
r r r r j
n n n n
r j r j
r j r j
x
x x x nx x x x
n n n
x x x x