Reliable Data Aggregation using Ant Colony
Optimization with State Transition Ant Rule in Sensor
Network
S. Vijiya Chandra
Research Scholar
Manonmanium Sundaranar University Tirunelveli, Tamilnadu
K. Alagarsamy,
Ph.DAssociate Professor / Department of Computer Applications
Madurai Kamaraj University Madurai, Tamilnadu
ABSTRACT
Data aggregation plays a vital role as the wireless sensor network (WSN) is highly susceptible to attacks. In WSN, data aggregation correlates the sensing data and aggregates at the intermediate nodes by reducing the time taken for message transfer. Works conducted on Concealed Data Aggregation Scheme for Multiple Applications (CDAMA) in WSN provides mechanisms from unauthorized aggregations. But, CDAMA data aggregation is not reliable for higher computation capability. Moreover, Data Aggregation Ant Colony Algorithms (DAACA) computes better energy and the quantity in choosing the next hop, however fails to forward packets with the sensed nodes causing inefficiency in data aggregation. Hence, in order to attain reliable data aggregation with better computation capability, Ant Colony Optimization with State Transition Ant Rule (ACO-STAR) is developed in this paper which works as per the foraging movement of ants analyzing state transition rules. ACO- STAR algorithm provides a significant way of identifying the search space for obtaining optimal data aggregation in WSN. The solution of ACO-STAR steadily attains the global optimal solution through effective forwarding of packets in terms of adjusting the clustering effect based on quantities of foraging movement of ants. ACO-STAR provides clear analysis on the experimental factors such as system data aggregation efficiency, data forwarding rate, and delay measurement in STAR data aggregated sensor network.
Keywords
Ant Colony Optimization, State Transition Ant Rule, Optimal Data Aggregation, Clustering, Foraging Movement, Wireless Sensor Network.
1.
INTRODUCTION
Data aggregation is a significant constraint in WSN, where the applications related to data gathering is used in communication systems. Sensor network aims in identifying the capable algorithms for optimal solution towards data aggregation. Aggregation is designed as effectual optimization problem which is resolved based on Ant Colony Optimization (ACO). One such ACO based router chip is illustrates in [11] to find the shortest path between any two nodes using swarm intelligence based optimization technique. On performing multi-paths the energy levels of the node is unnoticed or utilized more. Therefore, Energy-aware clustering algorithm (EADC) as illustrated in [10] is useful in competition range to construct clusters of even sizes to increase the forwarding tasks by forcing cluster head CH.
Data Aggregation Ant Colony Algorithms (DAACA) as computed in [2] conserved energy and the quantity of pheromones. But DAACA failed to forward packets during sensed nodes with high data aggregation efficiency in sensor network. Distributed Privacy-Preserving Access Control scheme as demonstrated in [9] for sensor networks used the blind signatures in token generation and ensured tokens for the openly verifiable identities. Privacy-preserving access control was not more efficient DTRD techniques for DP2ACunder different attacker models. Only compromised nodes in the sensor network survived detection with the chance to disturb routing. Intrusion detection in a Gaussian-distributed WSN was characterized by detecting the probability [12] with respect to the application requirements. Concealed Data Aggregation Scheme for Multiple Applications (CDAMA) as illustrated in [1] collected data without decryption, adversaries were not able to forge aggregated results by compromising them. However, CDAMA based data aggregation is unreliable and not well-suited for higher complex computation problems. Hence, in this work Ant Colony Optimization with State Transition Ant Rule (ACO-STAR) is designed to address the above listed limitations more specifically by CDAMA, DAACA. ACO based clustering model intends in better packet transmission with effective data aggregation process using ACO-STAR. The solution of ACO with STAR steadily attains the global optimal solution through effective forwarding of data packets in terms of adjusting the clustering effect in sensor network.
The structure of paper is as follows. In Section 1, the data aggregation in WSN is described based on the Ant Colony Optimization. In Section 2, ACO is described with State Transition Ant Rule (ACO-STAR). Section 3 illustrates Ns2 experimental setup explained with parametric factor description while experimented on the WSN. Section 4 analysis the result through table and graph values and section 5 illustrates the existing works with limitations on the WSN. Finally concludes with effective data aggregation and higher computational capability in Section 6.
2.
DATA AGGREGATION IN SENSOR
NETWORK USING ACO WITH STATE
TRANSITION RULE
Transition Ant Rule to improve data aggregation report with the identification of higher computational problem in wireless network. The final phase effectively forwards the sensed data packets using the ACO-STAR for the complex problem computational capability. The wireless senor system architecture of the ACO-STAR is shown in Fig 1.
Fig 1: Architecture of the ACO-STAR in WSN
Wireless Sensor System architecture of the ACO-STAR in Figure 1 describes the overall system process of the three phases. Initial phase is to perform the ant colony based clustering. The clustering method in ACO-STAR uses the foraging movement of ants(i.e.,) data packets to provide natural and intrinsic way for easy processing of data aggregation in WSN. The clustered data (i.e.,) aggregated data in sensor network is analyzed and each cluster has the cluster head and it is referred as the ACO aggregator. Each ACO aggregator sensor node contains all the information about the sensed data movements in WSN.
Second phase in ACO-STAR is to demonstrate the State Transition Ant Rule for improving the data aggregation report with identification of solution for higher computational problem. In the State Transition Ant Rule, the ant (i.e.,) sensed data moves from the service source point and visits each other sensed data by means of pheromonetrails, and then returns to the destination service point in sensor network. The pheromone density is measured clearly to demonstrate the State Transition Ant Rule used for the data aggregation. Third phase in the ACO-STAR is to forward the data packets to the sink node with reliable data aggregation for complex computation problems. The Ant Colony Optimization with Star Transition Ant Rule addresses the solution for high computational on wireless sensor system. The elaborate process involved in the Ant Colony Optimization with State Transition Ant Rule is discussed in the forthcoming sections.
2.1
ACO Clustering Process
The first phase involved in Ant Colony Optimization with State Transition Ant Rule (ACO-STAR) is the clustering process using ACO. Ant colony optimization cluster the data depending on the movements as the ants or the sensed data
always chooses the shortest path to reach the destination sensor nodes. In addition, ACO clustering uses the agents to construct the individual solutions in sensor network. The shortest path development effectively connects every sensed data points using the pheromone. The effective connection between the data is developed through pheromone (i.e.,) node density and lively pheromone in sensor network. The pheromone density is computed as
(1)
The Pheromone Density (PD) used for the clustering of the sensed data is evaluated using the intensity of the ant pheromone samples, a, with the path density being, b, where, the Euclidean distance between the source and destination sensor points and amount of pheromone track between source(s) and destination (d) nodes being and ,
respectively. The Euclidean distance between source and ant (a) is represented by with the amount of pheromone trail
between source (s) and ant (a) queue being and List of
sensed data packets transformation like ant queue being
The pheromone density as computed in (1) and the upcoming lively pheromone computation is used to effectively perform the ACO based clustering in WSN. The lively pheromone in ACO-STAR is defined as the lively node used to perform the effective data aggregation. The lively pheromone is computed as,
(2)
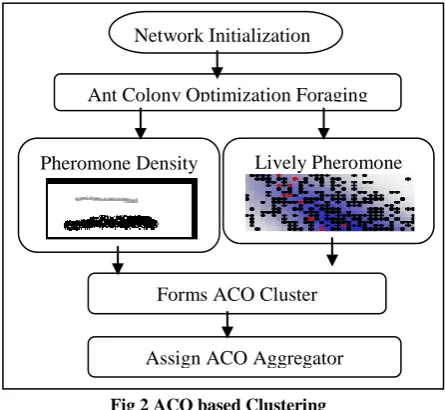
[image:2.595.319.542.476.681.2]The lively node for ACO based clustering denotes the pheromone track from the source to destination for each (i+1) iterations. At each iteration it follows the ‘ ’ live nodes with the length (la) of the ant pheromone in sensor network. The ACO based clustering follows the foraging movement of the ants in such a way that the pheromone density and lively pheromone perform effective aggregation in WSN and is represented through Fig 2.
Fig 2 ACO based Clustering
The ACO based clustering follows the pheromone density and lively pheromone movements to perform the clustering in sensor network for easy data aggregation process. The colored dots in the lively pheromone denote the lively sensor nodes in the sensor network for the data aggregation process. After the cluster formation the cluster head (i.e.,) ACO aggregator is selected based on the pheromone (i.e.,) node value and ACO based WSN
Data(Ant) Movement Analyzed
ACO Clustering based on Data Movement
State Transition Ant Rule (STAR)
ACO-STAR forwarding of packets
Identification of complex computational problem
solution
Easy processing for Data Aggregation
Improve data aggregation report
Network Initialization
Ant Colony Optimization Foraging
Pheromone Density Lively Pheromone
Forms ACO Cluster
pheromone density measure. The pheromone value associated with a sensor node is updated in each sample of data aggregation. The ACO aggregator contains all the information of the clustered sensor nodes and also the updated value of the pheromone in sensor network.
2.2
State Transition Ant Rule
In the second phase, ACO-STAR demonstrates the State Transition Ant Rule for attaining improved data aggregation report. The pheromone density as shown in (1) is measured clearly to demonstrate the State Transition Ant Rule in WSN. When the ant (i.e.,) sensed data arrives at a speed‘s’ in the network, ACO based clustering chooses the destination path with the shortest path computation. The shortest path is computed using the Euclidean distance vector and improves the data aggregation report using State Transition Ant Rule as computed below,
(3)
The main objective of State Transition Ant Rule is to improve the data aggregation report through the transition even when the path of sensed data transfer varies based on the pheromone density. The ‘il’ denotes each data packet transfer length and ‘sl’ denotes the speed utility for the sensed data packet transfer in WSN. In the State Transition Ant Rule, the ant (i.e.,) sensed data moves from the service source point and visits each other by means of pheromone track t to improve the report process of data aggregation. Once the process of data aggregation report in WSN is accomplished, it returns to the destination service point.
2.3
ACO-STAR Forwarding of Sensed
Data Packets
Once the ants accomplishes their trace using pheromone density as shown in (1), new amount of pheromone is left between every pair of sensed data packets in WSN. These left pheromone distance is measured based on the Euclidean distance. The Euclidean distance vector in ACO based clustering is measured as
(4)
The Euclidean Distance (ED) from Source to Destination (S, D) and Destination to Source (D, S) the sensed data packets are transmitted based on the pheromone density deposit in WSN. The Ant colony optimization also chooses the shortest path for the effective transformation of the sensed data packets from the source to sink node in WSN. , , …….. represent the sensed data packets after the data aggregation transfers the nodes for identifying the solution to the complex computational problems.
In the above (4), stands for the pheromone
placed on the path for the easy forwarding of the sensed packets after the data aggregation from source to destination.
is the distance computation based on the ant pheromone for the effective path construction in sensor network. The length of the path is computed as
(5)
The path length of the ACO-STAR based sensor system multiples the distance length with ant (i.e.,) data packets for i’ samples in sensor network. Similar (i.e.,) alike form of data are clustered together in section 2.1 and that is used here for
effective processing of data aggregation and then forward the data packets. The sensed data packets of similar intensity are grouped together and sent through the ant pheromone path in WSN.
[image:3.595.314.543.248.414.2]The Euclidean vector form represents the first sensed data packets in sequence and assigns the centroid node for the each cluster group in WSN. The centroid node information is all maintained in the cluster head for processing of data aggregation. In the next step, calculate the sum of all sensed packet positions using the Euclidean centroid vector. After calculating all the sensed packet position, the path is chosen to transfer the sensed data packets in ACO-STAR from source to destination in sensor network. Gaining of optimal data aggregation solution with higher computational problem solution in ACO-STAR is performed by adjusting the clustering effect based on foraging movement of ants.
Figure 3 Packets
Forwarding through ACO-STAR
Fig 3Packets Forwarding through ACO-STAR
Fig 3 describes the sensed data packet delivery in the WSN based on the ACO-STAR where Source S forwards packets to destination D based on the pheromone flow. The packets transmission using ACO-STAR improves the solution to the complex computational problems using data aggregation with high efficiency. The algorithmic step of ACO-STAR is given below,
Input: a, b intensity and path density, is list of sensed data packets transformation
Output: Effective data aggregation with solution to the higher computational problems in WSN
Begin with WSN Initialization
//ACO Clustering
Step 1: Ant Colony optimization Foraging Movements
Step 2: Pheromone density Computation
2.1:
Step 3: Lively pheromone Computation
3.1:
Step 3: Clustering of nodes using 2.1 and 3.1
Step 4: Assigns ACO Aggregator based on the pheromone value and pheromone density measure, easy process of data aggregation
// State Transition Ant Rule
S…
…
D
…
…
…
ACO-STARSource destination Packet
S
…
Step 5: Sensed Data moves from the service source point
Step 6: Visits by means of pheromone track
Step 7: Return to the sensed destination service point with improved data aggregation report
7.1:
// ACO-STAR Forwarding of Data Packets
Step 8: Measure Euclidean distance vector
8.1: Step 9: Path length computed
Step 10: Shortest path for the effective transformation of sensed data packets from the source to destination in WSN
End
The algorithmic step describes the ACO Clustering, State Transition Ant Rule, and ACO- Forwarding of Sensed Data Packets in WSN. The pheromone intensity and density clearly estimated in (1) and (2) developed the clustering model. The clustered group contains the ACO aggregator for reliable processing of the sensed data aggregation. Subsequently, State Transition Ant Rule used to improve the data aggregation report when compared with the other existing data aggregation model. Finally, the sensed data packets forwarded quickly with the shortest path computation with the help of Euclidean distance vector in WSN. ACO-STAR forwards the sensed data packets with solution to the complex computational problems in sensor network data aggregation.
3.
ACO-STAR EXPERIMENTAL SETUP
Ant Colony Optimization with State Transition Ant Rule (ACO-STAR) in WSN is experimented using the ns-2 network simulator. The ns2 simulator uses the random surrounding data path of 1000 ×1000 size where the ACO-STAR framework holds 25 simulation milliseconds with ‘n’ unpredictable sensor node. The sensor networks continue the process for a reliable data aggregation using the ACO system and compare the experimental parameter with the existing CDAMA and DAACA.
Once the transmission time is evolved, it then randomly chooses and moves to another sensed node location point. In the Random Way Point (RWM) model, each sensed node shift to an erratically chosen location and the RWM uses standard number of sensor nodes for data aggregation. The chosen location with a randomly selected speed contains a predefined amount and speed count. A Dynamic Source Routing (DSR) Protocol is used in ACO-STAR for the intermediate sensed data routing change depending on the pheromone density.
ACO-STAR contains approximately of about 100 neighbouring nodes where the randomly selected position with a randomly selected velocity provides a predefined speed. The minimum moving speed of ACO-STAR is about 8.0 m/s of each sensed node and the experiment is conducted on the factors such as complex problem computation rate in sensor network, data aggregation system efficiency, and delay measurement in sensor network.
The data aggregation in WSN is the amount of effective gathering and processing of sensed data packets. The effectiveness depends on the speed of performing the data aggregation. The STAR data aggregation efficiency is computed as
(6) (6) defines the efficiency of data aggregation and measured in terms of percentage (%).The overall process nodes taken for the processing in WSN is ‘20’ and the speed of data aggregation varies for each samples. The complex problem computation rate is achieved using the state transition ant rule, and measured in terms of percentage. The delay measurement in sensor network demonstrates the amount of time elapsed to transfer the sensed data packets from source to destination nodes in sensor network.
4.
RESULT ANALYSIS OF ACO-STAR
[image:4.595.323.536.310.584.2]Ant Colony Optimization with State Transition Ant Rule in WSN is compared against the existingConcealed Data AggregationScheme for Multiple Applications (CDAMA) in WSN and Data Aggregation Ant Colony Algorithms (DAACA).The table given below and graph describes theACO-STAR based effective data aggregation in WSN and compared with the CDAMA and DAACA.
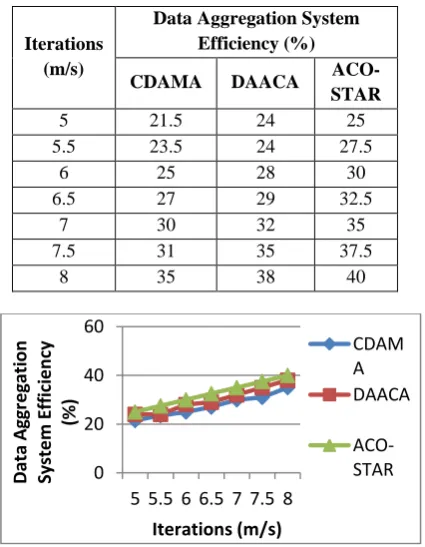
Table 1. Tabulation for Data Aggregation System Efficiency
Iterations (m/s)
Data Aggregation System Efficiency (%)
CDAMA DAACA
ACO-STAR
5 21.5 24 25
5.5 23.5 24 27.5
6 25 28 30
6.5 27 29 32.5
7 30 32 35
7.5 31 35 37.5
8 35 38 40
Fig 4Data Aggregation System Efficiency Measure
Fig 4 describes the data aggregation of the system based on the state transition ant rule. The data aggregation is also compared with the CDAMA and DAACA [1, 2]. In the State Transition Ant Rule, the ant (i.e.,) sensed data moves from the service source point and visits each other by means of pheromone track‘t’, in such a way that 14 – 20 % improved data aggregation efficiency is obtained when compared with the CDAMA. After the data aggregation report processing in WSN, returns to the data aggregation to the destination service point. The efficiency is 4 – 14 %improved when compared with the DAACA [2].
0 20 40 60
5 5.5 6 6.5 7 7.5 8
D
ata
A
gg
reg
ati
on
Sy
ste
m
E
ff
ic
ie
n
cy
(%
)
Iterations (m/s)
CDAM A DAACA
Table 2. Tabulation of Delay Measurement
Pheromone Density Ratio
Delay Measurement (sec)
CDAMA DAACA
ACO-STAR
10 336 287 243
20 455 423 353
30 546 473 405
40 523 455 416
50 741 626 551
60 849 740 628
[image:5.595.316.543.116.230.2]70 866 759 652
Table 2 demonstrated the delay measurement of ACO-STAR, CDAMA and DAACA in WSN.
Fig 5 Measure of Delay Measurement
Fig5 describes the delay measurement in ACO-STAR by using the Euclidean distance. The Euclidean Distance (ED) sensed the data packets and transmitted based on the pheromone density deposit in WSN and decreased the delay by 8 – 16 % when compared with the DAACA [2]. The Ant colony optimization also chooses the shortest path for the effective transformation of the sensed data packets from the source to sink node in WSN, so that the delay time in packet transferring is reduced by 20 – 27 % on contrast with the CDAMA [1].
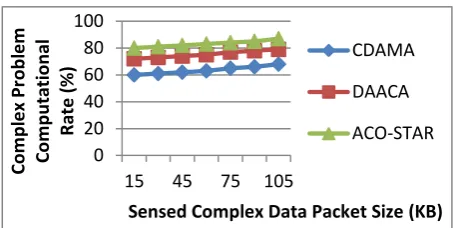
Table 3. Tabulation for Complex Problem Computational Rate
Sensed Complex
Data Packet Size (KB)
Complex Problem Computational Rate (%)
CDAMA DAACA
ACO-STAR
15 60 72 80
30 61 73 81
45 62 74 82
60 63 75 83
75 65 77 84
90 66 78 85
105 68 79 87
Table 3 and Fig 6 shows the complex problem computational cost that is measured based on the sensed complex data packet size, whereas the size is measured in terms of Kilo Bytes (KB). The Euclidean vector form is used for handling the complex sensed data packets in sequence and assigns the centroid node for each cluster group in WSN.The centroid node information is used for finding the solution to the complex problems in ACO-STAR WSN. The Euclidean
centroid vector sum up all sensed packet positions and 27 – 33 % improved computational rate when compared with the CDAMA [1] and 8 – 11 % improved when compared with the DAACA [2].
Fig 6 Complex Problems Computational Rate Measure
As final point, efficient Data Aggregation using Ant Colony Optimization with State Transition Ant Rule determines the solution for higher computational problem. The ACO with State Transition Ant Rule develop a clustering system for easy processing of data aggregation in sensor network. ACO-STAR improves data aggregation report in WSN.
5.
RELATED WORK
In Ant colony optimization, a colony of artificial ants build a solutions guided by the pheromone track. The indirect communication between the ants via the pheromone track permits them to find the shortest path among their adjoining network places and food (i.e.,) sensed data sources. The functionality of real ant colonies is exploited in artificial ant colonies in order to solve the complex optimization problems in WSN. The behaviour of ants modelled as artificial ants is used to resolve the combinatorial optimization problem. An optimal wake-up frequency assignment (OWFA) algorithm as described in [8], which takes into report the data rate at every node and the total permitted delay for data aggregation.
Data Aggregation and Authentication (DAA) protocol as described in [3] integrate false data detection with data aggregation and privacy. But computation of corresponding small-size message authentication codes is more complicated. And also data aggregation scheme with compressed sensing (CS) as described in [4] attained equally improved reliability and energy efficiency in WSN with arbitrary topology. However, CS scheme failed to investigate the minimum energy related to complex data aggregation problem. Data aggregation with the routing scheme presented a smoothing estimation function for the optimization problem in [7]. More additional efforts are in need to solve optimization problems.
Progressive optimization approach as illustrated in [5] employed Combine-Skip-Substitute (CSS) scheme to get hold of solutions surrounded by a small range of the lower bound of the optimal solution. Data Routing for In-Network Aggregation (DRINA) as explained in [6] reduced the number of message but the spatial and temporal correlation of the aggregated data was not taken into consideration. DRINA algorithm was not effective in stochastically selecting the nodes and balances the overhead. In addition, DRINA new strategies were not devised to manage the waiting time for aggregator sensor nodes based on standard space of the event coordinators, spatial, and semantics event correlation criteria.
6.
CONCLUSION
Reliable Ant Colony Optimization with State Transition Ant Rule addresses the high computational problem related to data
0 500 1000
10 20 30 40 50 60 70
D
el
ay
M
e
asu
re
m
e
n
t
(sec
)
Pheromone Density Ratio
CDAMA
DAACA
0 20 40 60 80 100
15 45 75 105
Co
m
p
le
x
Pr
o
b
le
m
Co
m
p
u
tat
io
n
al
R
ate
(%
)
Sensed Complex Data Packet Size (KB)
CDAMA
DAACA
aggregation in WSN. The results obtained during simulated experiments justified better quality on handling complex computational problems. ACO based clustering is developed using pheromone density and lively pheromone movements based on which clustering formation makes the process of data aggregation simple. Additionally, State Transition Ant Rule develops the source service point and visits each other nodes to improve the data aggregation in WSN. The solution of ACO with STAR steadily attains the global optimal solution through effective forwarding of sensed data packets in WSN. The experimental study results obtained by ACO with STAR attain the 9.957 % maximal data aggregation efficiency, data forwarding rate. Finally delay measurement is also reduced using the ACO-STAR data aggregation in WSN.
7.
REFERENCES
[1] Yue-Hsun Lin., Shih-Ying Chang., and Hung-Min Sun., “CDAMA: Concealed Data Aggregation Scheme for Multiple Applications in WSNs,” IEEE
TRANSMOVEMENTS ON KNOWLEDGE AND
DATA ENGINEERING, VOL. 25, NO. 7, JULY 2013
[2] Chi Lin., Guowei Wu., Feng Xia, Mingchu Li., Lin Yao, Zhongyi Pei., “Energy efficient ant colony algorithms for data aggregation in wireless sensor networks,” Journal of Computer and System Sciences., Elsevier Journal., 2012
[3] Suat Ozdemir and Hasan Çam,“Integration of False Data Detection with Data Aggregation and Confidential
Transmission in WSNs,” IEEE/ACM
TRANSMOVEMENTS ON NETWORKING, VOL. 18, NO. 3, JUNE 2010
[4] Liu Xiang., Jun Luo., and Catherine Rosenberg., “Compressed Data Aggregation: Energy Efficient and High Fidelity Data Collection,” IEEESECON, 2011
[5] Liang He., Jianping Pan., and Jingdong Xu., “A Progressive Approach to Reducing Data Collection Latency in Wireless Sensor Networks with Mobile Elements,” IEEE TRANSACTIONS ON MOBILE COMPUTING, VOL. 12, NO. 7, JULY 2013
[6] Leandro Aparecido Villas., Azzedine Boukerche, Heitor Soares Ramos.,Horacio A.B. Fernandes de Oliveira., Regina Borges de Araujo., and Antonio Alfredo Ferreira Lour., “DRINA: A Lightweight and Reliable Routing Approach for In-Network Aggregation in WSNs,” IEEE TRANSACTIONS ON COMPUTERS, VOL. 62, NO. 4, APRIL 2013
[7] Cunqing Hua., and Tak-Shing Peter Yum., Senior Member, IEEE., “Optimal Routing and Data Aggregation for Maximizing Lifetime of WSNs,” IEEE/ACM TRANSACTIONS ON NETWORKING, VOL. 16, NO. 4, AUGUST 2008
[8] Ungjin Jang., Sunggu Lee., Sungjoo Yoo., “Optimal wake-up scheduling of data gathering trees for WSNs,” Journal Parallel Distributed Computing, Elsevier Journal., 2012
[9] Rui Zhang.,Yanchao Zhang., and Kui Ren., “Distributed Privacy-Preserving Access Control in Sensor Networks,” IEEE TRANSACTIONS ON PARALLEL AND DISTRIBUTED SYSTEMS, VOL. 23, NO. 8, AUGUST 2012
[10]Jiguo Yua., Yingying Qia., Guanghui Wangb., Xin Gua., “A cluster-based routing protocol for WSNs with non uniform node distribution,” International Journal of Electronics and Communications (AEÜ)., 2012
[11]Selcuk Okdem., and Dervis Karaboga., “Routing in WSNs Using an Ant Colony Optimization (ACO) Router Chip,” Sensors 2009, 9, 909-921; doi:10.3390/s90200909.
[12]Yun Wang., Weihuang Fu., and Dharma P. Agrawal., “Gaussian versus Uniform Distribution for Intrusion Detection in Wireless Sensor Networks,” IEEE
TRANSACTIONS ON PARALLEL AND