Performance of Matrix-Assisted Laser
Desorption Ionization–Time of Flight
Mass Spectrometry for Identifying
Clinical
Malassezia
Isolates
Julie Denis,
a,bMarie Machouart,
cFlorent Morio,
d,eMarcela Sabou,
a,bCatherine Kauffmann-LaCroix,
fNelly Contet-Audonneau,
cErmanno Candolfi,
a,bValérie Letscher-Bru
a,bLaboratoire de Parasitologie et de Mycologie Médicale, Hôpitaux Universitaires de Strasbourg, Strasbourg, Francea; Institut de Parasitologie et de Pathologie Tropicale, EA 7292, Fédération de Médecine Translationnelle, Université de Strasbourg, Strasbourg, Franceb; Structure de Parasitologie-Mycologie, Département de Microbiologie, Centre Hospitalo-Universitaire de Nancy (CHU-Nancy), Hôpitaux de Brabois, Vandœuvre-les-Nancy, Francec; Laboratoire de Parasitologie-Mycologie, CHU de Nantes, Nantes, Franced; EA 1155 IICiMed, UFR de Pharmacie Nantes Atlantique Universités, Nantes, Francee; Laboratoire de Parasitologie-Mycologie, CHU de Poitiers, Poitiers, Francef
ABSTRACT
The genus
Malassezia
comprises commensal yeasts on human skin.
These yeasts are involved in superficial infections but are also isolated in deeper
in-fections, such as fungemia, particularly in certain at-risk patients, such as neonates
or patients with parenteral nutrition catheters. Very little is known about
Malassezia
epidemiology and virulence. This is due mainly to the difficulty of distinguishing
species. Currently, species identification is based on morphological and biochemical
characteristics. Only molecular biology techniques identify species with certainty, but
they are time-consuming and expensive. The aim of this study was to develop and
evaluate a matrix-assisted laser desorption ionization–time of flight (MALDI-TOF)
da-tabase for identifying
Malassezia
species by mass spectrometry. Eighty-five
Malasse-zia
isolates from patients in three French university hospitals were investigated. Each
strain was identified by internal transcribed spacer sequencing. Forty-five strains of
the six species
Malassezia furfur
,
M. sympodialis
,
M. slooffiae
,
M. globosa
,
M. restricta
,
and
M. pachydermatis
allowed the creation of a MALDI-TOF database. Forty other
strains were used to test this database. All strains were identified by our
Malassezia
database with log scores of
⬎
2.0, according to the manufacturer’s criteria.
Repeat-ability and reproducibility tests showed a coefficient of variation of the log score
val-ues of
⬍
10%. In conclusion, our new
Malassezia
database allows easy, fast, and
reliable identification of
Malassezia
species. Implementation of this database will
contribute to a better, more rapid identification of
Malassezia
species and will be
helpful in gaining a better understanding of their epidemiology.
KEYWORDS
MALDI-TOF,
Malassezia
identification, ITS sequencing, ITS identification,
Malassezia
T
he lipophilic yeasts of the genus
Malassezia
were first observed by Charles Robin in
1853 (1). The taxonomy of this genus has evolved since then, and it now contains
14 distinct species (2), among which 10 are commensals of the human skin:
Malassezia
furfur
,
M. pachydermatis
,
M. sympodialis
,
M. globosa
,
M. obtusa
,
M. slooffiae
,
M. restricta
,
M. dermatis
,
M. japonica
, and
M. yamatoensis.
The four remaining species (
Malassezia
nana
,
M. caprae
,
M. equina
, and
M. cuniculi
) are commensals of animals’ skin (cats, goats,
horses, and rabbits, respectively). Recently, yeasts morphologically similar to those of
the genus
Malassezia
have been described in marine ecosystems (3). Interestingly, a
Received20 August 2016Returned for modification15 September 2016 Accepted7 October 2016
Accepted manuscript posted online19 October 2016
CitationDenis J, Machouart M, Morio F, Sabou M, Kauffmann-LaCroix C, Contet-Audonneau N, Candolfi E, Letscher-Bru V. 2017. Performance of matrix-assisted laser desorption ionization–time of flight mass spectrometry for identifying clinical
Malasseziaisolates. J Clin Microbiol 55:90 –96. https://doi.org/10.1128/JCM.01763-16.
EditorDavid W. Warnock, University of Manchester
Copyright© 2016 Denis et al. This is an open-access article distributed under the terms of the Creative Commons Attribution 4.0 International license.
Address correspondence to Julie Denis, [email protected].
crossm
on May 16, 2020 by guest
http://jcm.asm.org/
study showed that
Malassezia
species could represent 50 to 80% of the human skin
microbiota (4), with distinct geographical differences (5). For example,
M. globosa
is the
species most frequently isolated from healthy skin in Japan and Iran (6), while in Canada
the most frequently isolated species is
M. sympodialis
(7), and in Korea it is
M. restricta
(8). Some other studies have described various predominant species depending on the
body site, the geographical location, and the methods used for their identification (5,
7).
Malassezia
species are opportunistic pathogens, causing various skin diseases, such
as pityriasis versicolor, seborrheic dermatitis, or dandruff (9). Their incidence seems to
be higher in some autoimmune disorders, such as psoriasis or atopic dermatitis (10–12).
Although rare, some cases of fungemia and other invasive infections (peritoneal and
biliary infections) (13, 14) have been described since the 1980s (13–15). These infections
have no specific clinical signs and therefore remain difficult to diagnose.
Mycological diagnosis can be performed on skin or tissue samples and consists of
direct examination and culture using lipid-enriched media at 32°C. Microscopic
exam-ination of clinical samples and colonies shows that small ovoid, ellipsoidal, or cylindrical
blastoconidia (1.1 to 2.5
m by 1.7 to 2.7
m) with a large-base bud are characteristic
of the genus
Malassezia
(2). Classical species identification comprises both biochemical
and morphological studies, but this is rarely done due to the difficulty of interpreting
lipophilic tests and the morphological closeness of the different species (16–18).
Insufficiency of species identification contributes to the lack of epidemiological
knowl-edge about
Malassezia
infections. Alternatively, molecular biology techniques, such as
sequencing of large-subunit (LSU) rRNA (19) or the internal transcribed spacer (ITS) of
26S rRNA (20), can provide reliable species identification, but these techniques are
usually reserved for strains from patients with deep infections.
An easy, fast, and simple method to identify
Malassezia
species could enhance the
precise diagnosis of these infections and would provide better knowledge of the
epidemiology of each species in the clinical setting. The aims of this study were (i) to
develop a matrix-assisted laser desorption ionization–time of flight (MALDI-TOF)
data-base for the identification of the main
Malassezia
species of clinical interest and (ii) to
evaluate this database prospectively in routine practice, on clinical strains.
RESULTS
Database creation.
Under the conditions described in Materials and Methods, we
obtained 45 main spectrum profiles (MSPs) distributed across six species:
M. furfur
,
M.
sympodialis
,
M. slooffiae
,
M. globosa
,
M. restricta
, and
M. pachydermatis
.
In the building of the database, the genus and species specificities of mass spectra
were verified. To check that our spectra were genus specific, we compared the 45 MSPs
obtained to Bruker Daltonics database MBT DB-5627, which contains four
Malassezia
strains (1
M. furfur
and 3
M. pachydermatis
strains). No MSPs were misidentified as
non-
Malassezia
genera, but only one was correctly identified to the genus level: an
M.
pachydermatis
strain with a log score of 2.13. The spectra were then compared at the
species level. Comparison of the intensity and the position of the
m/z
of the spectra
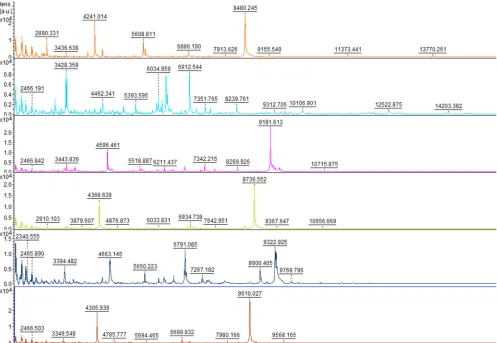
showed differences between the spectra of different species (Fig. 1). The composite
correlation index (CCI) analysis of the spectra showed low similarity between the MSPs
of different species, with a score close to zero, and high similarity within species (Fig.
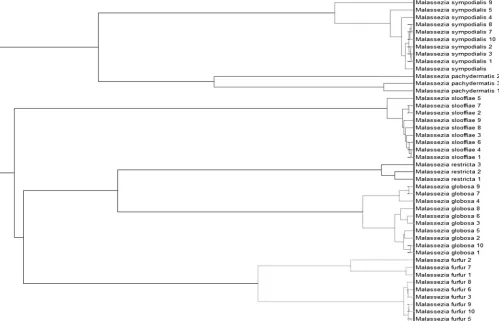
2), with a score close to 1. The construction of an MSP dendrogram confirmed the
distribution of the MSPs into species clusters (Fig. 3). The spectra were sufficiently
discriminative between species to allow identification at the species level.
Database test.
To test our database, we acquired the spectra of 40 additional
sequenced clinical strains and compared them to both Bruker Daltonics database MBT
DB-5627 and the new
Malassezia
database. As expected from preliminary experiments,
none of the strains were identified using the Bruker MBT DB-5627 database. When
compared to our
Malassezia
database, 100% of the strains (
n
⫽
40) were correctly
identified at the species level, with log scores of
⬎
2.0.
For the reproducibility and repeatability of analysis and full-protocol tests, all the
coefficients of variation (CVs) calculated on the log scores were lower than 10%. CVs
on May 16, 2020 by guest
http://jcm.asm.org/
were not significantly different according to the age of colonies within each species
tested (
P
, 0.34, 0.95, and 0.77, respectively). For all species, the average CVs of the
analysis and full protocol were 4% (range, 3 to 6%) and 4.9% (range, 3 to 6%),
respectively. For the reproducibility tests, the average CV was 5.9% (range, 3 to 7%).
FIG 1Comparison of spectra obtained for the 6 speciesM. slooffiae(orange),M. furfur(light blue),M. globosa(purple),M. pachydermatis(green),M. restricta (dark blue), andM. sympodialis(red).
FIG 2Graphical representation of CCI scores calculated for each species. Cold colors (green to blue) represent CCI scores ranging from 0 to 0.5 (weak similarity). Warm colors (red to yellow) represent CCI scores from 0.5 to 1 (high similarity).
on May 16, 2020 by guest
http://jcm.asm.org/
[image:3.585.47.544.72.415.2] [image:3.585.81.328.519.709.2]When the reproducibility and repeatability CVs were compared, there were no
signif-icant differences depending on the age of the colonies (Table 1).
DISCUSSION
In this study, we developed and implemented a MALDI-TOF database to identify
several species of the genus
Malassezia
. Since Dixon medium contains Tween 40, which
inhibits the MALDI-TOF signal (21–23), we decided to use subcultures on a Sabouraud
medium enriched with 0.5% olive oil. These results differ from those published by
Kolecka et al. (24), who succeeded in building a MALDI-TOF database for identifying
Malassezia
yeasts from strains cultivated on Dixon medium, possibly due to the use of
another mass spectrometer. A second
Malassezia
database built and tested by another
group (25) was obtained from cultures grown on CHROMagar
Malassezia
medium,
which contains glycerol and a low proportion of Tween 60. Furthermore, modification
of the quantities of formic acid and acetonitrile during the extraction procedure was
revealed to be crucial to obtaining interpretable spectra.
[image:4.585.43.542.78.399.2]FIG 3Dendrogram of theMalasseziadatabase obtained by the MSP approach.
TABLE 1Means of the coefficients of variation of the log score values of the reproducibility and repeatability tests
Age of colony (days)
Mean (range) CV (%) of log score values
Analysis repeatability
Full-protocol
repeatability Reproducibility
2 4.2 (3–6) 4.5 (3–6) 5.4 (2–7)
3 3.6 (3–5) 6 (5–7) 4.8 (4–8)
4 4.2 (3–6) 4.5 (4–5) 5.8 (3–9)
5 4 (3–6) 4.5 (4–5) 6.6 (5–8)
on May 16, 2020 by guest
http://jcm.asm.org/
[image:4.585.41.372.660.739.2]Importantly, none of the 40 clinical strains tested in the present study were correctly
identified with Bruker Daltonics database MBT DB-5627 even at the genus level,
suggesting that this database, though licensed for clinical use, lacks performance for
the genus
Malassezia
. This can be explained by the low number of strains included in
the database (1 for
M. furfur
and 3 for
M. pachydermatis
) and by the different media
used to cultivate those strains (Leeming and Notman agar modified for
Malassezia
species and Sabouraud medium enriched with 1% olive oil [compared to 0.5% olive oil
in our medium]), since some studies have demonstrated that performance could be
affected by the growth medium (26, 27).
Our
Malassezia
database contains 45 strains from six clinically relevant species:
M.
furfur
,
M. sympodialis
,
M. slooffiae
,
M. globosa
,
M. restricta
, and
M. pachydermatis
. The
MSPs obtained are genus specific, reasonably homogenous across the six species, and
discriminative enough between them to allow robust
Malassezia
identification at the
species level. All strains tested against this database were identified at the species level
with a log score value of
⬎
2.0. These results are comparable with those of the other
two databases published recently. The first, developed by Kolecka et al. (24), included
14 species (48 strains) and identified 84.8% of the strains tested, whereas the latter,
from Yamamoto et al. (25), contained 8 species (18 strains) and identified 92.8% of the
unknown strains with a log score value between 1.7 and 2.0. Although our database
currently contains only six species, it remains representative of the local epidemiology
of
Malassezia
yeasts in France. Nevertheless, further experiments are now required to
implement the database with additional spectra, including those for rare species, in
order to provide a better overview of
Malassezia
species responsible for human
diseases.
The repeatability and reproducibility of the entire protocol are acceptable, with CV
values of
⬍
10%, regardless of the age of the colonies within the tested range. Some
studies showed that the quality of the extract is highly dependent on the quality of the
culture (28). Within the genus
Malassezia
, the colony texture differs between species
and may influence the quality of the extracts.
With 100% identification of the strains and CV values of
⬍
10%, our database can
easily be used by clinical laboratories for the identification of
Malassezia
species. It
allows for quick identification of
Malassezia
species, which was not possible with
classical techniques such as microscopy and biochemical tests. In conclusion, we have
developed a rapid and simple method for identifying
Malassezia
species, which
pro-motes a better understanding of the pathogenicity of the different
Malassezia
species.
MATERIALS AND METHODS
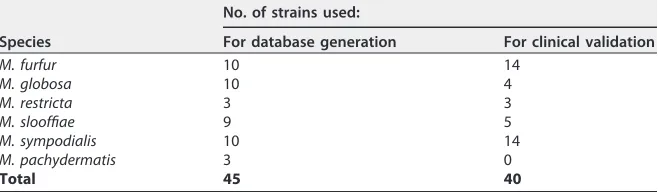
Sample collection.Strains isolated from skin, urinary, fecal, respiratory, and blood samples and identified asMalasseziaspp. in the university hospitals of Strasbourg, Nancy, and Nantes from 2012 to 2015 were collected. First, 45 strains were used to generate the MALDI-TOF database. Forty other strains were tested and were used to evaluate the newMalasseziadatabase (Table 2).
[image:5.585.42.371.84.180.2]Strain identification.All strains were first cultured on Dixon medium (29) at 32°C for 10 days. A microscopic morphology examination after staining with methylene blue allowed genus identification. In parallel, all strains were identified to the species level by sequencing (GATC Biotech, Germany) of the internal transcribed spacer (using primers ITS1 and ITS4) of the ribosomal DNA and comparison of the sequences obtained to those in the GenBank (http://www.ncbi.nlm.nih.gov/GenBank) and CBS (http://www.cbs.knaw.nl) databases (2, 6). The following identification criteria were used: a sequence TABLE 2Distribution and number of strains of each species included in this study
Species
No. of strains used:
For database generation For clinical validation
M. furfur 10 14
M. globosa 10 4
M. restricta 3 3
M. slooffiae 9 5
M. sympodialis 10 14
M. pachydermatis 3 0
Total 45 40
on May 16, 2020 by guest
http://jcm.asm.org/
length between 500 and 700 bp, with an E value of 0 (GenBank), a minimum overlap of 99% (CBS), and an identification concordance higher than 99%.
MALDI-TOF MS analysis. (i) Acquisition of spectra.Because preliminary experiments performed on a Microflex mass spectrometer (Bruker Daltonics, Germany) showed that no spectra could be acquired when the strains were cultivated on Dixon medium, we decided to subculture each strain on Sabouraud chloramphenicol agar (45.5 g Sabouraud chloramphenicol, 7.5 g Pastagar B [both from Bio-Rad, Marnes-la-Coquette, France], distilled water to 1 liter) enriched with 0.5% commercial organic olive oil. Under these conditions, mass spectra were reproducible using 2- to 5-day-old colonies and a protein extract conserved at⫹4°C for⬍48 h after extraction.
Protein was extracted as recommended by the manufacturer. Briefly, one loopful (1l) of yeast material was suspended in 300l of distilled water and 900l of ethanol. The suspension was mixed and was centrifuged at 13,000⫻gfor 5 min. After removal of the supernatant, the pellet was centrifuged again to eliminate the remaining ethanol. The pellet was then air dried for 10 min and was resuspended in 70% formic acid–30% acetonitrile (vol/vol). After 5 min of centrifugation at 13,000⫻g, the pellet was removed. Then 1l of extracted protein,⬍48 h old, was transferred to a steel target, air dried, and coated with 1l of a matrix solution of␣-cyano-4-hydroxycinnamic acid (HCCA). For spectrum acqui-sition, it was necessary to adapt our extraction protocol in order to standardize the quantity of yeast material used. This was difficult because of the variability of texture among the different species, particularly forM. restrictaandM. slooffiae, which have drier colonies than the other species. We thus adjusted the amount of formic acid and acetonitrile to the volume of the yeast pellet obtained after washing: the volume-to-volume mixture of formic acid and acetonitrile must visually represent 1.5 times the size of the pellet (15 to 40l of formic acid and acetonitrile was used in this case).
Mass spectrometry analysis was performed with a Microflex mass spectrometer using Biotyper software, version 3.1. Spectra were recorded in the linear positive mode at a laser frequency of 20 Hz within a mass range from 2 to 20 kDa. The ionization source was fitted out with a delayed extraction time of 400 ns. Each spectrum was obtained from 240 shots in 40-shot steps from different positions on the target plate, and log scores were calculated. We used the manufacturer’s identification criteria, which were based on the score value, as follows:⬍1.7, no reliable identification; between 1.7 and 2.0, genus identification;ⱕ2.0, species identification.
(ii) Generation of the MALDI-TOF database forMalasseziaspecies.According to the manufac-turer’s recommendations, a minimum of 20 spectra were acquired for each strain that was used to generate the database. The spectra were uploaded on flexAnalysis, version 3.4, to smooth them and to subtract the baseline. The smoothed spectra were then analyzed by Biotyper, version 3.1. For each strain, a mass spectrum profile (MSP) was calculated and included in the database. The genus and species specificities of the spectra were analyzed using the MSP and CCI (composite correlation index) methods. The spectra obtained were also compared to Bruker Daltonics database MBT DB-5627, containing one strain ofM. furfurand three strains ofM. pachydermatis, to verify the genus specificity.
(iii) MALDI-TOF database evaluation.For each strain used for testing the database, spectra from four spots were acquired and were compared to our in-house Malasseziadatabase and to Bruker Daltonics database MBT DB-5627. The database performance was evaluated by identification criteria, requiring correct species identification and a log score higher than 2.0. Repeatability and reproducibility were also evaluated. The repeatability of the analysis was tested for five strains—M. furfur,M. sympodialis, M. slooffiae,M. globosa, andM. restricta— on 2-, 3-, 4-, and 5-day-old colonies. For each strain, one protein extract was spotted 30 times onto the same steel target to evaluate the repeatability of the analysis. For two strains,M. furfurandM. sympodialis, the repeatability of the full protocol was tested: 15 extracts obtained at the same time, from the same culture, and from 2-, 3-, 4-, and 5-day-old colonies were deposited on the target. The complete-protocol reproducibility was also tested with three strains:M. furfur,M. sympodialis, andM. slooffiae. For each strain, 10 successive cultures were performed, and single culture extracts from 2-, 3-, 4-, and 5-day-old colonies were analyzed. The coefficient of variation (CV) of the log score values was calculated for each strain.
Statistical analysis.The Kruskal-Wallis test was used to compare the CVs of the repeatability and reproducibility between each pair of species. APvalue ofⱕ0.05 was considered statistically significant.
REFERENCES
1. Guillot J, Hadina S, Guého E. 2008. The genusMalassezia: old facts and new concepts. Parassitologia 50:77–79.
2. Castellá G, Coutinho SDA, Cabañes FJ. 2014. Phylogenetic relationships ofMalasseziaspecies based on multilocus sequence analysis. Med Mycol 52:99 –105. https://doi.org/10.3109/13693786.2013.815372.
3. Amend A. 2014. From dandruff to deep-sea vents:Malassezia-like fungi are ecologically hyper-diverse. PLoS Pathog 10:e1004277. https:// doi.org/10.1371/journal.ppat.1004277.
4. Gao Z, Perez-Perez GI, Chen Y, Blaser MJ. 2010. Quantitation of major human cutaneous bacterial and fungal populations. J Clin Microbiol 48:3575–3581. https://doi.org/10.1128/JCM.00597-10.
5. Gaitanis G, Magiatis P, Hantschke M, Bassukas ID, Velegraki A. 2012. The Malasseziagenus in skin and systemic diseases. Clin Microbiol Rev 25:106 –141. https://doi.org/10.1128/CMR.00021-11.
6. Sugita T, Kodama M, Saito M, Ito T, Kato Y, Tsuboi R, Nishikawa A. 2003.
Sequence diversity of the intergenic spacer region of the rRNA gene of Malassezia globosacolonizing the skin of patients with atopic dermatitis and healthy individuals. J Clin Microbiol 41:3022–3027. https://doi.org/ 10.1128/JCM.41.7.3022-3027.2003.
7. Barac A, Pekmezovic M, Milobratovic D, Otasevic-Tasic S, Radunovic M, Arsic Arsenijevic V. 2015. Presence, species distribution, and density of Malasseziayeast in patients with seborrhoeic dermatitis—a community-based case-control study and review of literature. Mycoses 58:69 –75. https://doi.org/10.1111/myc.12276.
8. Gupta P, Chakrabarti A, Singhi S, Kumar P, Honnavar P, Rudramurthy SM. 2014. Skin colonization byMalasseziaspp. in hospitalized neonates and infants in a tertiary care centre in North India. Mycopathologia 178: 267–272. https://doi.org/10.1007/s11046-014-9788-7.
9. Sugita T, Kodama M, Saito M, Ito T, Kato Y, Tsuboi R, Nishikawa A. 2001. Molecular analysis ofMalasseziamicroflora on the skin of atopic
on May 16, 2020 by guest
http://jcm.asm.org/
titis patients and healthy subjects. J Clin Microbiol 39:3486 –3490. https://doi.org/10.1128/JCM.39.10.3486-3490.2001.
10. Fry L, Baker BS. 2007. Triggering psoriasis: the role of infections and medications. Clin Dermatol 25:606 – 615. https://doi.org/10.1016/ j.clindermatol.2007.08.015.
11. Amaya M, Tajima M, Okubo Y, Sugita T, Nishikawa A, Tsuboi R. 2007. Molecular analysis ofMalasseziamicroflora in the lesional skin of psori-asis patients. J Dermatol 34:619 – 624. https://doi.org/10.1111/j.1346 -8138.2007.00343.x.
12. Glatz M, Bosshard PP, Hoetzenecker W, Schmid-Grendelmeier P. 2015. The role ofMalasseziaspp. in atopic dermatitis. J Clin Med 4:1217–1228. https://doi.org/10.3390/jcm4061217.
13. Tragiannidis A, Bisping G, Koehler G, Groll AH. 2010.Malassezia infec-tions in immunocompromised patients. Mycoses 53:187–195. https:// doi.org/10.1111/j.1439-0507.2009.01814.x.
14. de St Maurice A, Frangoul H, Coogan A, Williams JV. 2014. Prolonged fever and splenic lesions caused byMalassezia restrictain an immuno-compromised patient. Pediatr Transplant 18:E283–E286. https://doi.org/ 10.1111/petr.12351.
15. Al-Sweih N, Ahmad S, Joseph L, Khan S, Khan Z. 2014. Malassezia pachydermatisfungemia in a preterm neonate resistant to fluconazole and flucytosine. Med Mycol Case Rep 5:9 –11. https://doi.org/10.1016/ j.mmcr.2014.04.004.
16. Mayser P, Haze P, Papavassilis C, Pickel M, Gruender K, Guého E. 1997. Differentiation ofMalasseziaspecies: selectivity of cremophor EL, castor oil and ricinoleic acid forM. furfur. Br J Dermatol 137:208 –213. https:// doi.org/10.1046/j.1365-2133.1997.18071890.x.
17. Kaneko T. 2011. A study of culture-based easy identification system for Malassezia. Med Mycol J 52:297–303. (In Japanese.) https://doi.org/ 10.3314/mmj.52.297.
18. Kaneko T, Murotani M, Ohkusu K, Sugita T, Makimura K. 2012. Genetic and biological features of catheter-associatedMalassezia furfur from hospitalized adults. Med Mycol 50:74 – 80. https://doi.org/10.3109/ 13693786.2011.584913.
19. Didehdar M, Mehbod ASA, Eslamirad Z, Mosayebi M, Hajihossein R, Ghorbanzade B, Khazaei MR. 2014. Identification ofMalasseziaspecies isolated from patients with pityriasis versicolor using PCR-RFLP method in Markazi Province, Central Iran. Iran J Public Health 43:682– 686. 20. Vuran E, Karaarslan A, Karasartova D, Turegun B, Sahin F. 2014.
Identi-fication ofMalasseziaspecies from pityriasis versicolor lesions with a new multiplex PCR method. Mycopathologia 177:41– 49. https://doi.org/ 10.1007/s11046-013-9704-6.
21. Amini A, Dormady SJ, Riggs L, Regnier FE 2000. The impact of buffers and surfactants from micellar electrokinetic chromatography on matrix-assisted laser desorption ionization (MALDI) mass spectrometry of pep-tides. Effect of buffer type and concentration on mass determination by MALDI–time-of-flight mass spectrometry. J Chromatogr A 894:345–355. 22. Abrar S, Trathnigg B. 2011. Separation of polysorbates by liquid chro-matography on a HILIC column and identification of peaks by MALDI-TOF MS. Anal Bioanal Chem 400:2119 –2130. https://doi.org/10.1007/ s00216-011-4933-3.
23. Zhang H, Ran Y, Xie Z, Zhang R. 2013. Identification ofMalasseziaspecies in patients with seborrheic dermatitis in China. Mycopathologia 175: 83– 89. https://doi.org/10.1007/s11046-012-9606-z.
24. Kolecka A, Khayhan K, Arabatzis M, Velegraki A, Kostrzewa M, Andersson A, Scheynius A, Cafarchia C, Iatta R, Montagna MT, Youngchim S, Caba-ñes FJ, Hoopman P, Kraak B, Groenewald M, Boekhout T. 2014. Efficient identification ofMalasseziayeasts by matrix-assisted laser desorption ionization–time of flight mass spectrometry (MALDI-TOF MS). Br J Der-matol 170:332–341. https://doi.org/10.1111/bjd.12680.
25. Yamamoto M, Umeda Y, Yo A, Yamaura M, Makimura K. 2014. Utilization of matrix-assisted laser desorption and ionization time-of-flight mass spectrometry for identification of infantile seborrheic dermatitis-causing Malasseziaand incidence of culture-based cutaneousMalassezia micro-biota of 1-month-old infants. J Dermatol 41:117–123. https://doi.org/ 10.1111/1346-8138.12364.
26. Walker J, Fox AJ, Edwards-Jones V, Gordon DB. 2002. Intact cell mass spectrometry (ICMS) used to type methicillin-resistantStaphylococcus aureus: media effects and interlaboratory reproducibility. J Microbiol Methods 48:117–126. https://doi.org/10.1016/S0167-7012(01)00316-5. 27. Saenz AJ, Petersen CE, Valentine NB, Gantt SL, Jarman KH, Kingsley MT,
Wahl KL. 1999. Reproducibility of matrix-assisted laser desorption/ ionization time-of-flight mass spectrometry for replicate bacterial cul-ture analysis. Rapid Commun Mass Spectrom 13:1580 –1585. https:// doi.org/10.1002/(SICI)1097-0231(19990815)13:15⬍1580::AID-RCM679
⬎3.0.CO;2-V.
28. Williams TL, Andrzejewski D, Lay JO, Musser SM. 2003. Experimental factors affecting the quality and reproducibility of MALDI TOF mass spectra obtained from whole bacteria cells. J Am Soc Mass Spectrom 14:342–351. https://doi.org/10.1016/S1044-0305(03)00065-5.
29. Guého E, Midgley G, Guillot J. 1996. The genusMalasseziawith descrip-tion of four new species. Antonie Van Leeuwenhoek 69:337–355. https:// doi.org/10.1007/BF00399623.