Management Using PIC Micro Controller
J.Ramprabhu1, S.Nandhini2Department of EEE, Kumaraguru College of Technology, Coimbatore, India
Abstract
—
This paper presents a novel defect segmentation of fruits based on color features with K-means clustering algorithm. The algorithms Gaussian Mixture Model (GMM), Support Vector Machine (SVM) are used for background removal and color classification respectively. Physical recognition of defected fruit is very time overwhelming. These days, most existing fruit superiority detecting and grading system have the drawback of low efficiency, low speed of grading, high cost and complexity. Although the color is not commonly used for defect segmentation, it produces a high discriminative power for different regions of image. This approach thus provides a feasible robust solution for defect segmentation of fruits. Image processing gives solution for the automated fruit size grading to give precise, dependable, unfailing and quantitative information apart from handling large volumes, which may not be achieved by employing the human graders. The hardware model can also be created by using PIC microcontroller. This will have a good aspect of application in fruit quality detecting industries.Keywords— K-Means, Defect Segmentation, PIC Microcontroller, Image Processing.
I. INTRODUCTION
The naked eye observation of experts is the main approach adopted in practice for detection and identification of plant diseases. But, this requires continuous monitoring of experts which might be prohibitively expensive in large farms. Further, in some developing countries, farmers may have to go long distances to contact experts, this makes consulting experts too expensive and time consuming and moreover farmers are unaware of non-native diseases. In order to improve the fruits’ quality and production efficiency, to reduce labor intensity, it is necessary to research nondestructive automatic detection technology. Fruit nondestructive detection is the process of detecting fruits’ inside and outside quality without any destructive, using some detecting technology to make evaluation according some standard rules. Nowadays, the quality of fruit shape, default, color and size and so on cannot evaluate on line by using traditional methods. With the development of image processing technology and computer software and hardware, it becomes more attractive to detect fruits’ quality by using vision detecting technology. At present, most existing fruit quality detecting and grading system have the disadvantage of low efficiency, low speed of grading, high cost and complexity. So it is significant to develop high speed and low cost fruit size detecting and grading system. Food and other biological products are valued by their appearance. Appearance is a major factor in the judgment of quality and human eye has historically done this. The color indicates parameters like ripeness, defects, damage etc. The quality is often inconsistent. The adaptation of human eye to small changes in color and the effect of the background on the perceived color and color intensity are the main sources of error. There are many efforts is being made to establish the standard quality parameters for fresh produce and the instrumentations that meet these expectation. Employing non-destructive sensing techniques in fruits industry assure the quality and wholesomeness of fruit. This would increase consumer satisfaction and acceptance, and enhancing industry competitiveness and profitability. Various non-destructive sensing techniques have been studied and implemented for predicting internal/external quality of fresh fruits. This paper presents an efficient image segmentation approach using K-means clustering technique based on color features from the images. Defect segmentation is carried out into two stages. At first, the pixels are clustered based on their color and spatial features, where the clustering process is accomplished. Then the clustered blocks are merged to a specific number of regions. Using this two step procedure, it is possible to increase the computational efficiency avoiding feature extraction for every pixel in the image of fruits. Although the color is not commonly used for defect segmentation, it produces a high discriminative power for different regions of the image.
II. DESIGN METHODOLOGY
300
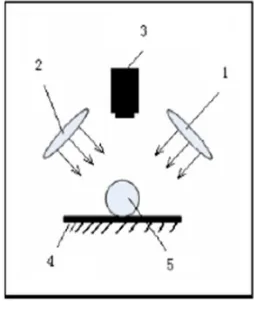
Fig. 1 Block DiagramThe image could be captured using a regular digital camera. Here we have used for capturing image the iball twist cam which is CMOS based camera. The system arrangement is done as shown below the basic aim is to obtaining the fruit’s features. The system consists of several steps like feature extraction, sorting and grading. As proposed in , to avoid shadow, two annular lights are used to supply well- distributed light. The black background color in image is easier to extract the fruit edge characters later. So the background is set black in whole process of image capture. The light and camera location is as shown in Figure 2.2.
Fig.2 Fruit system light and camera location.1-light; 2-light; 3-cmos camera; 4-conveyor belt; 5-fruit.
For grading using first choice camera position is adjusted in such a way that for capturing live image of a fruit the camera is continuously scanning the conveyor belt in video mode, when conveyor stops as fruit is detected by IR system camera can capture top view image of fruit. The black background color in image is easier to extract the fruit edge characters later [1] so black color is used for the conveyor system. The captured image is given as an input to the MATLAB software which extracts (detects) color and size of a fruit, this data is transferred to PIC micro controller based system by using RS232 and com port and accordingly control action is taken place, later conveyor starts and then fruit is collected in main plate of grading assembly. If fruit bad fruit is detected (as detected by MATLAB) then the main plate is moving anticlockwise and accordingly the fruit is collected in lower plate 1, if abnormal fruit is detected (as detected by MATLAB) then the main plate is moving anticlockwise and accordingly the fruit is collected in lower plate2.
III. IMAGE PROCESSING
[image:3.612.246.373.337.494.2]Fig.3 Image Processing Flow
Step 1. Read the input image of defected fruits.
Step 2. Transform Image from RGB to L*a*b* Color Space. We have used L*a*b* color space because it consists of a luminosity layer in 'L*' channel and two chromaticity layer in 'a*' and 'b*’ channels. Using L*a*b* color space is computationally efficient because all of the color information is present in the 'a*' and 'b*' layers only.
Step 3. Classify Colors using K-Means Clustering in 'a*b*' Space. To measure the difference between two colors, Euclidean distance metric is used.
Step 4. Label Each Pixel in the Image from the Results of K-Means. For every pixel in our input, K means computes an index corresponding to a cluster. Every pixel of the image will be labeled with its cluster index.
Step 5. Generate Images that Segment the Input Image by Color. We have to separate the pixels in image by color using pixel labels, which will result different images based on the number of clusters.
Programmatically determine the index of each cluster containing the defected part of the fruit because K-means does not return the same cluster index value every time. But we can do this using the center value of clusters, which contains the mean value of 'a*' and 'b*' for each cluster.
IV. FRUIT SIZE DETECTING AND GRADING
302
Fig.4 Fruit image size detecting and grading flowTake apple as the processing example, according to the apple size is its diameter, which is the longest distance in the apple’s cross section. So the detecting program is focused on how to calculate the diameter in an apple side view image. The fruit image size detecting and grading processing flow is shown in Fig 4.
B. Color Detection
In the process of fruit color is detected according to RGB values, here fruits are sorted according to color and size. So for e.g. two fruits are considered say tomato having red color and guava having green color, so in this step work is going to find out color of a fruit by using RGB values of an image taken from the camera, this image can be processed by using MATLAB software and accordingly color can be detected i.e. green or red. Color detection algorithm: 1) Start 2) Read the input color image using im read function. 3) Read the input pixel of color image in three different planes (RGB) and store it into three variables r, g, and b. 4) Read the small region of fruit to detect color of fruit. 5) Store in different variable r1, g1, b1. 6) Calculate the mean of r1, g1, b1 and store into variable r2, g2, b2. 7) Compare the value with threshold. 8) If g2>threshold, Color detected is green. 9) If r2>threshold, Color detected is Red. 10) End.
C. Edge Detection
Once color is detected, there is a need to find out size of a fruit. The size of circular shaped fruit is its diameter. The edge extraction is key factor for size detecting. After gray image, the most powerful edge-detection method that finds edge is the canny method. The Canny method differs from the other edge-detection methods in that it uses two different thresholds (to detect strong and weak edges and includes the weak edges in the output only if they are connected to strong edges. This method is therefore less likely than the others to be fooled by noise, and more likely to detect true weak edges.
D. Fruit Size Detecting Algorithm
Fig.5 The processing fruit image (a) the original image (b)gray image (c)diversion image (d)tracking edge
V. SIMULATION
Fig.6 Sample images from the data set infected with (a) apple scab (b) apple rot (c) apple blotch diseases
304
Fig.8 Single Gray-Scale Image Colored Based On Their Cluster Index.Fig.9 Detecting the Infected Fruit
Fig.10 K-Means clustering for an apple fruit that is infected with apple scab disease with four clusters (a)The infected fruit image (b) first cluster (c) second cluster (d) third cluster (e) fourth cluster (f) single gray-scale image colored based on their
cluster index.
VI. CONCLUSION
The system proposed here is a display model. In this paper, a framework for the defect segmentation of fruits using images is projected and valued. For a large scale production the number of cameras and length of conveyor system can be modified according to our requirements in future. Novel incorporated techniques for sorting and grading of different fruits are presented here. Usually image confine is a great challenge as there is a chance of high uncertainty due to the external light conditions, so the advantage of gray scale image is taken into account, which are less effected to the external environment changes as well as beneficial for finding the size of a fruit. Further MATLAB coding will be identified for different images of fruit in order to improve the efficiency.
REFERENCES
[1] Shiv Ram Dubey1,Pushkar Dixit2,Nishant Singh3, Jay Prakash Gupta4 “Infected Fruit Part Detection using K-Means Clusterin Segmentation Technique” 2013 International Journal Artificial Intelligence and Interactive Multimedia, Vol. 2, Nº 2.
[2] Hongshe Dang, Jinguo Song, Qin Guo, “A Fruit Size Detecting and Grading System Based on Image Processing,” 2010 Second International Conference on Intelligent Human Machine Systems and Cybernetics,pp83-86.
[6] Naoshi Kondo, “Fruit Grading Robot”, Proceedings of the2003 IEEE/ASME International Conference on Advanced Intelligent Mechatronics (AIM 2003), pp 1366-1371.
[7] R. C. Gonzalez, R. E. Woods," Digital Image Processing", Pearson Education.IIEd.,2002
[8] [8] J. F. David, K. Y. Yau, and A. K. Elmagarmid, “Automatic image segmentation by integrating color-edge extraction and seeded region growing,” IEEE Transactions On Image Processing (TIP), vol. 10, no.10, pp. 1454-1466, 2001