5
III
March 2017
Technology (IJRASET)
©IJRASET: All Rights are Reserved
455
Modelling and Simulation of Solar PV Module
with MPPT Controller and Boost Converter
Monika Sharma1, Mr. Gagan Yadav 2
1,2
Electrical Department ( Power System) Y.I.E.T. Gadholi Yamuna Nagar, Kurukshetra
Abstract: Solar Photovoltaic (PV) systems are having growing importance in present time of our power system due to its non-polluting, minimum maintenance, and free fuel characteristics. The efficiency of the Solar PV system is limited to design constraints that are as follows- Surface Reflection, Carrier Collection, Recombination and Parasitic Resistances. Hence attaining good efficiency and achieving maximum power from PV system is the major concern for all utilities which involves the solar PV modules. Maximum power point tracking (MPPT) is one the technique by which we can achieve maximum power from the PV module or array. The Perturb and Observe (MPPT) based algorithm is incorporated in the design so as to optimize some of the design constraints to achieve maximum power as well as efficiency from the solar PV module at varying environmental conditions.
Keywords: Boost converter, Maximum power point tracking (MPPT), MATLAB (Simulink), Perturb and Observe (P&O), Solar PV module.
I. INTRODUCTION
Energy is the basic requirement for human lives. So that its supply should be secure and sustainable and at the same time it should be eco-friendly, economic and socially acceptable. The regular hike of fuel prices together with increasing carbon footprints threatens our energy supply. Among all the renewable energy resources such as solar, wind, ocean, geothermal etc. solar is abundant. In recent years, various research work have been done on the application of PV as a alternate energy source. PV energy is one of the promising energy resources as a clean, inexhaustible and can be easily harvested. Several applications employing Solar PV technology have been developed for satellite power systems, solar power generation, solar battery charging
I
ph+
V
I
R
sI
dR
pI
pFig no.1. Practical single diode model with and
station and solar vehicles. At higher solar irradiance it gives greater value of current. Solar cells are connected in combination of series and parallel according to the voltage, current and power rating is required. The model of solar module is configured by using SIMULINK blocks. Boost converter is used for regulating the voltage of the solar PV system. The gate signal of dc-dc converter is given from the MPPT algorithm. Perturbation and observation technique is used for tracking the maximum power point of the PV module. The algorithm takes voltage and current signal from the solar PV module and after optimizing voltage value a referenced duty cycle is generated which is given to dc-dc boost converter.
II. BLOCKDIAGRAMOFMODEL
Technology (IJRASET)
©IJRASET: All Rights are Reserved
456
of the boost converter. Perturb and observe method is easy to implement and also it tracks Maximum power point accurately. The generalized block diagram of P&O MPPT technique is shown in figure 2.
BP3210N
Perturb and observe MPPT Algorithm
Inductor Diode
Capacitor Load Curr ent Sens or
Voltage Sensor
I GBT Irradiance
Fig.2. Block diagram of proposed PV system
The input voltage and current is measured from the PV system and is used to calculate the instantaneous power. Maximum power point is identified and duty ratio of the DC-DC converter is varied by the MPPT algorithm accordingly. The duty ratio is varied in such a manner that the input power delivered to the converter will almost be equal to the power delivered to the load.
III. MODELINGOFPVMODULE
Equivalent circuit representation of solar cell is of four types. This model does not consider the internal losses by current. Solar PV module BP3210N Load P&O MPPT Controller PWM Generator Measurement system DC-DC Boost converter V and I
Duty cycle Solar
irradiance
Fig.3 PV System Modelling Diode current is proportional to the saturation current and is given by the equation:
Where V = voltage imposed on the diode
= reverse saturation current or leakage current of the diode in ampere = actual cell temperature (K)
k = Boltzmann constant = J/K q = electron charge = Coulombs
= thermal voltage (exclusively depend on temperature) = number of PV cells connected in series
A = ideality factor
IV. DETERMINATION OF THE PARAMETERS
Technology (IJRASET)
©IJRASET: All Rights are Reserved
457
Fig 4.1 Implementation of
The numbers of parameters varies depending upon the chosen model and assumptions made by researchers. I have considered the single diode model with series resistance and parallel resistance. Because it is easy to implement and also it gives best match with experimental values. And hence this model is best suited for many researchers. In this work four parameters , , and have to be evaluated.
A. Determination of
According to the figure 4.1, the output current at the standard test condition (STC) is given as:
When the PV cell is short circuited : ,
This equation is valid only for ideal case. So equality is not valid for this equation. So, that it can be written as:
The photocurrent depends upon both irradiance and temperature and is stated as:
Where G = solar irradiance or irradiance (W/ ) = irradiance at STC = 1000 W/
= (Kelvin) = cell temperature at STC = 25+273 = 298 K
= temperature coefficient of short circuit current (A/K), provided by the manufacturer = photocurrent (A) at STC
B. Determination of
The value of shunt resistance is generally taken as high, so the last term of equation (7) is eliminated for the next approximation. By enforcing equation (7) at the three most remarkable points at STC:
The voltage at open circuit ( , we get
The current at short circuit ( , then we get
The voltage ( and current ( at maximum power, then we get
The (-1) term has to be neglected because it is very smaller than the exponential term. From the equation 8 substituting the value of in equation 9 then we get:
So:
Technology (IJRASET)
©IJRASET: All Rights are Reserved
458
Fig 4.2 Implementation of The reverse saturation current is given by
Where = band gap energy of the semiconductor material (eV), (1.12 eV for Si) D = diode diffusion factor
In order to eliminate D, equation 13 is calculated twice; at and at . Then, when the ratio of the two equations is taken, we get:
[image:5.612.119.508.361.425.2]
The above equation of in which some parameters provided by the manufacturer as after putting equation 12 into 14, others which depends on the technology of PV cell, as (A, ) and some are constants. But ‘a’ and depends on actual temperature, that is why has to be determined at real time.
Fig 4.3 Implementation of Fig 5.1 Solar PV Module BP3210N with load resistance
C. Implementation of PV Module
According to the mathematical expressions discussed Simulink model is developed. The datasheet of solar PV module is taken from the solar BP3210N.
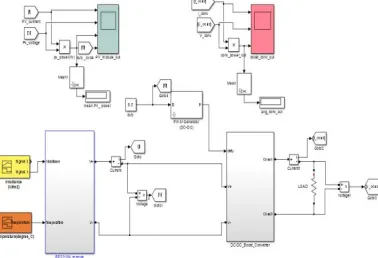
[image:5.612.212.401.580.709.2]D. Solar PV Module of with Boost Converter
Figure 6.1 shows the implementation of solar PV module with DC-DC boost converter. Voltage and current is sensed from the PV module and boost converter and analysed in the scope. The output voltage is controlled by using PWM technique by changing the duty cycle. In this model the duty cycle is constant hence MPP is not achieved all the instant of time. For varying irradiance and temperature signal builder block is used. Various signal of output of PV module and DC-DC converter is analyzed in scope.
Technology (IJRASET)
©IJRASET: All Rights are Reserved
459
V. RESULT ANALYSIS
A. Simulation at G = 1000w/m^2 and Cell Temperature =
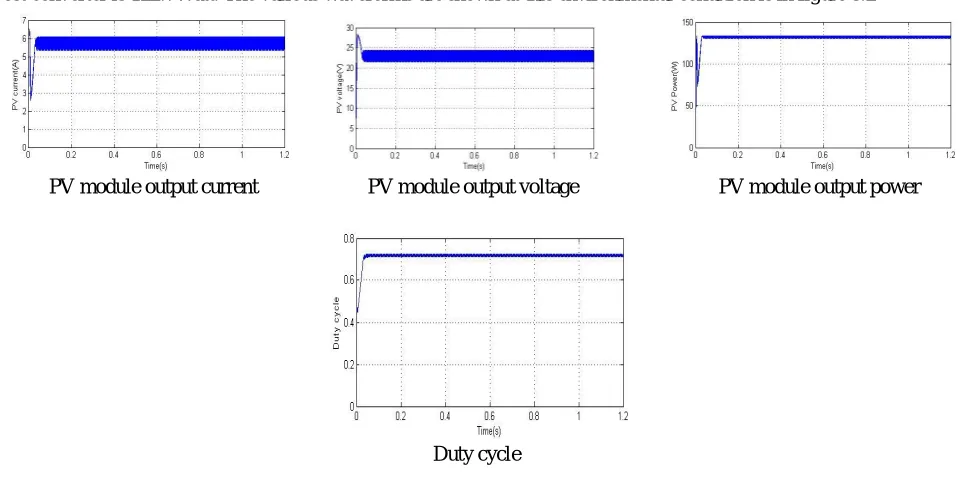
At irradiance level of 1000W/m^2 and the cell temperature of the average power achieved by the PV module is 165.2 Watt. The average value of power at STC is 194.5. Hence, the maximum power point ratio calculated at this condition is 84.95 %. Hence, the boost converter shows the efficiency of 92.7%. The various waveforms are shown at this environmental condition is in figure x.
PV module output current PV module output voltage PV module output power
[image:6.612.71.545.150.386.2]Duty cycle
Fig 8.1-Output waveform of PV module at G=1000 W/m^2 and
B. Simulation at G = 800w/m^2 and Cell Temperature =
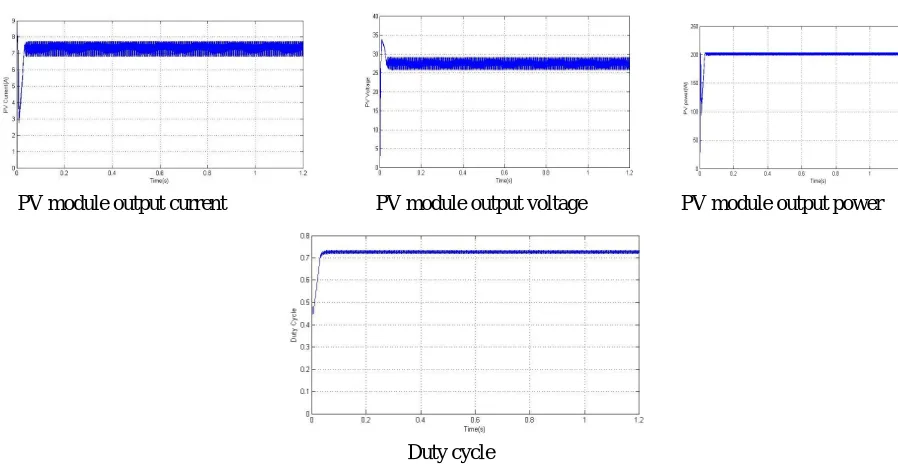
At irradiance level of 800W/m^2 and the cell temperature of the average power achieved by the PV module is 132.4 Watt. The average value of power at STC is 156.7. Hence, the MPP ratio calculated at this condition is 84.49 %. The average output power of the boost converter is 122.7Watt. The various waveforms are shown at this environmental condition is in figure 8.2
PV module output current PV module output voltage PV module output power
[image:6.612.64.550.462.704.2]Duty cycle
Technology (IJRASET)
©IJRASET: All Rights are Reserved
460
C. Simulation at G = 600w/m^2 and Cell Temperature =
At irradiance level of 600W/m^2 and the cell temperature of the average power achieved by the PV module is 98.46
Watt. The average value of power at STC is 117.7. Hence, the MPP ratio calculated at this condition is 83.65 %. The average output power of the boost converter is 91.23Watt. The various waveforms are shown at this environmental condition is in figure 8.3.
PV module output current PV module output voltage PV module output power
[image:7.612.77.531.132.349.2]Duty cycle
Figure 8.3 Output waveform of PV module at G=600 W/m^2 and
D. Simulation at G = 400w/m^2 and Cell Temperature =
At irradiance level of 600W/m^2 and the cell temperature of the average power achieved by the PV module is 63.87 Watt. The average value of power at STC is 77.8. Hence, the MPP ratio calculated at this condition is 82.1 %. The average output power of the boost converter is 59.13Watt Fig 8.4
PV module output current PV module output voltage PV module output power
Duty cycle
[image:7.612.57.520.437.695.2]Technology (IJRASET)
©IJRASET: All Rights are Reserved
461
E. Simulation at G = 1000w/m^2 and Cell Temperature =
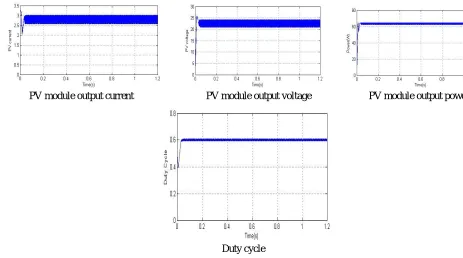
At irradiance level of 1000W/m^2 and the cell temperature of the average power achieved by the PV module is 202.1 Watt. The average value of power at STC is 212.3 watt. Hence, the MPP ratio calculated at this condition is 95.2 %. The average output power of the boost converter is 188.4 Watt. The various waveforms are shown at this environmental condition is in figure 8.5.
PV module output current PV module output voltage PV module output power
[image:8.612.72.521.129.365.2]Duty cycle
Figure 8.5- Output waveform of PV module at G=1000 W/m^2 and
VI. CONCLUSION
The simulation results of the developed model are presented. The output waveforms have been drawn at different irradiance and temperature levels. As per the result, the efficiency of designed DC-DC boost converter is 92.7%. The simulation result of designed model shows that at higher irradiance level the MPP ratio is greater than lower irradiance level. Simulation result also shows that at lower value the MPP ratio is greater than the MPP ratio at higher level temperature. Sudden changes in the irradiance level has been also tracked by the P&O MPPT algorithm, which gives sudden changes in the duty cycle of the DC-DC converter by which the maximum power is achieved by the PV module.
REFERENCES
[1] Faranda, R., Leva, S.: ‘Energy comparison of MPPT techniques for PV systems’, WSEAS Transactions on Power Systems, 3, pp. 446-455 [2] ko, S.-H., Chao, R.-M.: ‘Photovoltaic dynamic MPPT on a moving vehicle’, Solar Energy, 2012, 86, pp. 1750-1760
[3] Chen, W., Shen, H., Shu, B., Qin, H., Deng, T.: ‘Evaluation of performance of MPPT devices in PV systems with Storage Batteries’, Renewable Energy, 2007, 32, pp. 1611-1612
[4] Andrejašič, T.; Jankovec, M.; Topič, M., "Comparison of direct maximum power point tracking algorithms using EN 50530 dynamic test procedure," Renewable Power Generation, IET, vol.5, no.4, pp.281-286, July 2011
[5] Houssamo, I., Locment, F., Sechilariu, M.: “Maximum power tracking for photovoltaic power system: Development and experimental comparison of two algorithms”, Renewable Energy, Volume 35, Issue 10, October 2010, Pages 2381-2387
[6] Jiang, J., Huang, T., Hsiao, Y., Chen, C.: “Maximum power tracking for photovoltaic power systems”, Tamkang J. Sci. Eng., 2005, 8, pp. 147-153
[7] Tafticht, T., Agbossou, K., Doumbia, M.L., Chériti, A.: “An improved maximum power point tracking method for photovoltaic systems”, Renewable Energy, Volume 33, Issue 7, July 2008, Pages 1508-1516, ISSN 0960-1481