International Journal of Emerging Technology and Advanced Engineering
Website: www.ijetae.com (ISSN 2250-2459, ISO 9001:2008 Certified Journal, Volume 5, Issue 1, January 2015)
303
Retinal Image Analysis for Evaluating Image Suitability for
Medical Diagnosis
Vinitha R
1, Jayageetha J
2 1PG Scholar, 2Assistant professor, ECE Department, SNS College of Technology, Coimbatore, India
Abstract— The quality of a retinal image is assessed using the algorithm based on image quality indicators is introduced. Features such as colour and focus are used as quality indicators and are computed using novel image processing techniques. These quality indicators are also classified to evaluate the image suitability for diagnosis purposes. The retinal images are collected from DRIVE, ROC and STARE datasets. Artificial feed forward neural network classifier is used to classify the retinal image and simulated using MATLAB.
Keywords— Artificial neural network, Colour index, Colour measure, Focus measure, Retinal image quality.
I. INTRODUCTION
Eye diseases such as diabetic retinopathy and age-related macular degeneration affect a considerably large share of the population and its prevalence is expected to increase in the near future. Diabetic retinopathy is damage to the retina caused by complications of diabetes, which can eventually lead to blindness. Diabetic retinopathy may cause vision loss more rapidly, may not have any warning signs for some time. In general, however, a person with macular edema is likely to have blurred vision, making it hard to do things like read or drive. Glaucoma is a term describing a group of ocular (eye) disorders resulting in optic nerve damage or loss to the field of vision, typically caused by a clinically characterized pressure build-up in regards to the fluid of
the eye (intraocular pressure-associated optic
neuropathy).The disorders can be roughly divided into two main categories, "open-angle" and "closed-angle"(or "angle closure") glaucoma. The angle refers to the area between the iris and cornea, through which fluid must flow to escape via the trabecular meshwork, an area of tissue in the eye located around the base of the cornea.
AMD is a common eye condition and a leading cause of vision loss among people age 60 and older. It causes damage to the macula, a small spot near the centre of the retina and the part of the eye needed for sharp, central vision, which lets us see objects that are straight ahead. In some people, AMD advances so slowly that vision loss does not occur for a long time. The eye care professional will look at the retina for early signs of the disease, such as: Leaking blood vessels, Retinal swelling, such as macular edema, Pale, fatty deposits on the retina
(exudates) – signs of leaking blood vessels,
damaged nerve tissue (neuropathy) and any changes in the blood vessels.
If macular edema is suspected, FFA and sometimes OCT may be performed. Poor quality images may be caused by cataract, poor dilation, ptosis, external ocular condition, or learning difficulties. There may be artifacts caused by dust, dirt, condensation, or smudge.
Commonly, in order to screen for and diagnose retina related conditions, digital fundus photography is used, which enables a non-invasive examination and allows image storage and transmission for later use at different locations. However, in all cases the resulting digital retinal images must be examined by an expert human grader, usually a trained ophthalmologist or optometrist, which makes the whole process very difficult and time consuming, a problem aggravated by the scarcity of specialized human resources. Moreover, both DR and AMD are diagnosable, based on well known and perfectly characterized symptoms which are detectable by visual inspection of the eye fundus, and may be treatable if detected at an early stage.
The use of automated evaluation of digital retinal images has the potential to reduce the workload and thus increase the cost-effectiveness of such screening also some manufactures offer automated clinical decision support system targeting these applications including retinal image analysis tool with diagnostic capabilities. However, there still remain a number of problems that must be overcome in order to develop fully reliable automated retinal images analysis systems. One of these problems is the need to guarantee that the quality of the retinal images to be graded exceeds a threshold below which the automated analysis procedures may fail. This is a real problem for low-quality images as seen in [1], [4] so a computationally efficient algorithm for assessment of retinal image quality of very good performance compared to conventional methods is developed.
A. Retinal image quality
International Journal of Emerging Technology and Advanced Engineering
Website: www.ijetae.com (ISSN 2250-2459, ISO 9001:2008 Certified Journal, Volume 5, Issue 1, January 2015)
304
The image artefacts are mostly caused by the occurrence of haze, presence of dust and dirt, partial occlusion by eyelashes, improper cleaning of the cameralens, uneven illumination over macula, uneven
illumination of the optic disc, uneven illumination of the image edge and the total eye blink. Our work evaluates retinal image quality through classification of features derived from generic image quality parameters.
B. Previous works on image quality assessment
Image focus is evaluated based on the analysis of the global distribution of edge magnitudes in the image and on local analysis of intensity distribution [8]. [2] Focused their quality assessment algorithm on image sharpness and illumination. Illumination quality measured through evaluation of retinal image contrast and brightness. [3] Evaluated the image along the dimensions of colour, luminance and contrast, achieving an overall sensitivity of 100% and specificity of 96%. [5] Proposed a method but focused only on eye vasculature and not on the entire eye structure
II. DESCRIPTION
The retinal image quality assessment algorithm proposed in this work follows a sequence of steps: pre-processing, the generic image attributes of colour and focus are evaluated and classified. During pre-processing useless image information is removed or masked also the image is cropped and then subjected to removal of noise.
A. Pre-processing
Each image is first subjected to a pre-processing phase which removes unimportant information by masking and cropping the image to include only pixels showing retinal data. Images are often degraded by noises. Noise can occur during image capture, transmission, etc. So in order to preserve the real image noise should get removed from it. Masking is a technique used to selectively obscure or hold back parts of an image while allowing other parts to show. Cropping an image extracts a rectangular region of interest from the original image. This focuses the viewer's attention on a specific portion of the image and discards areas of the image that contain less useful information. Image cropping allows zooming a specific portion of the image.
1) Noise:
Image noise is random (not present in the object imaged) variation of brightness or colour information in images, and is usually an aspect of electronic noise. It can be produced by the sensor and circuitry of a scanner or digital camera. Image noise can also originate in film grain and in the unavoidable shot noise of an ideal photon detector. Image noise is an undesirable by-product of image capture that adds spurious and extraneous information.
Principal sources of Gaussian noise in digital images arise during acquisition e.g. sensor noise caused by poor illumination or high temperature or transmission. In digital image processing Gaussian noise can be reduced using a spatial filter, though when smoothing an image, an undesirable outcome may result in the blurring of fine-scaled image edges and details because they also correspond to blocked high frequencies. Here linear smoothing filter is used. Salt-and-pepper noise is a form of noise sometimes seen on images. It presents itself as sparsely occurring white and black pixels. An effective noise reduction method for this type of noise is a median filter. Shot noise or Poisson noise is a type of electronic noise which originates from the discrete nature of electric charge. The term also applies to photon counting in optical devices, where shot noise is associated with the particle nature of light. Speckle noise is multiplicative noise, so it's difficult to remove the multiplicative noise as compared to additive noise
2) Types of Filters to Remove Noise:
In image processing, to smooth a data set is to create an approximating function that attempts to capture important patterns in the data, while leaving out noise or
other fine-scale structures/rapid phenomena. In
smoothing, the data points of a signal are modified so individual points (presumably because of noise) are reduced, and points that are lower than the adjacent points are increased leading to a smoother signal. The Wiener filtering executes an optimal tradeoff between inverse filtering and noise smoothing. It removes the additive noise and inverts the blurring simultaneously. The Wiener filtering is optimal in terms of the mean square error. In other words, it minimizes the overall mean square error in the process of inverse filtering and noise smoothing. The Wiener filtering is a linear estimation of the original image. Median filtering is very widely used in digital image processing because, under certain conditions, it preserves edges while removing noise. The main idea of the median filter is to run through the signal entry by entry, replacing each entry with the median of neighboring entries. First image fuzzification is used to modify the membership values of a specific data set or image. After the image data are transformed from gray-level plane to the membership plane using fuzzification, appropriate fuzzy techniques modify the membership values. This can be a fuzzy clustering, a fuzzy rule-based approach, or a fuzzy integration approach.
B. Focus Assessment Algorithm
International Journal of Emerging Technology and Advanced Engineering
Website: www.ijetae.com (ISSN 2250-2459, ISO 9001:2008 Certified Journal, Volume 5, Issue 1, January 2015)
[image:3.595.52.273.368.678.2]305
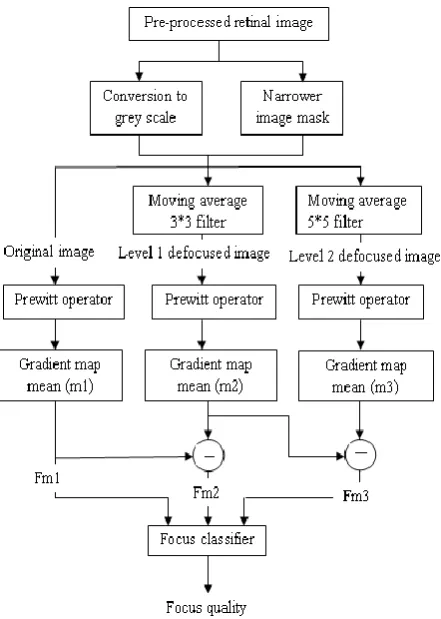
Focus is measured through the application of the perwitt operator to the retinal image after conversion to grey scale, followed by a multi-focus-level analysis. The algorithm has three stages. The first stage corresponds to the application of the perwitt operator to the original grey scaled retinal image, and the resulting focus measure (FM1) corresponds to the mean of the respective gradient map of original image. In second stage the grey scaled image is low-pass filtered with a 3 *3 moving average filter, the perwitt operator is applied and the focus information (m2) gathered through the mean of the resulting gradient map of level I defocused image. The second focus measure (FM2) corresponds to the difference between FM1and m2. In the final stage, the original grey scaled image is again low-pass filtered with a 5 *5 moving average filter, the perwitt operator is applied and the focus information (m3) gathered through the mean of the resulting gradient map of level 2 defocused images. The third focus measure (FM3) is obtained through the difference between m2 and m3.Figure 1: Focus Assessment Algorithm Flowchart
Perwitt operator is used particularly in edge detection algorithm. Technically, it is discrete differentiation operator computing an appropriate gradient of image intensity function. Gradient is measure of change in intensity of some point in original image in given direction. Pixels with large gradient value become possible edge pixels.
Edges may be tracked in the direction perpendicular to the gradient direction and used to extract information from images.
C. Colour Assessment Algorithm:
This algorithm classifies retinal image colour as „„bright‟‟, „„dark‟‟ or „„normal. The procedure starts with
a colour indexing operation, using histogram
[image:3.595.326.536.456.765.2]backprojection. Histogram backprojection answers the question „„Where in the image are the colours that belong to the object being looked for (the target)?‟‟ In our case, the object looked for is a colour palette represented by a pre-defined colour map. In our application for each image class a specific colour map was computed from the contents of training images belonging to that class. Accordingly, the „„bright colour map‟‟, “dark colour map‟‟ and „„normal colour map‟‟ are computed. Each of these colour maps is used to perform colour indexing of the retinal image being processed, with the creation of three different indexed images, Then the average values of the three indexed images are computed, yielding three colour measures (CM1, CM2, and CM3). Finally since each image colour class occupies specific regions in the feature space, the image class („„bright‟‟, „„dark‟‟ or „„normal‟‟) can be determined using clustering or classification techniques applied to the image feature vector (CM1, CM2, CM3).
International Journal of Emerging Technology and Advanced Engineering
Website: www.ijetae.com (ISSN 2250-2459, ISO 9001:2008 Certified Journal, Volume 5, Issue 1, January 2015)
306
Indexed colour is a technique to manage digital images, colour is displayed in a limited fashion, in orderto save computer memory and file storage, while
speeding up display refresh and file transfers. It is a form of vector quantization compression. When an image is encoded in this way, colour information is not directly carried by the image pixel data, but is stored in a separate piece of data called a palette: an array of colour elements, in which every element, a colour, is indexed by its position within the array. The image pixels do not contain the full specification of its colour, but only its index in the palette. This technique is sometimes referred as pseudo colour or indirect colours as colour are addressed indirectly.
K-means clustering is a method of vector quantization, originally from signal processing, that is popular for cluster analysis in data mining. K-means clustering aims to partition n observations into k clusters in which each observation belongs to the cluster with the nearest mean, serving as a prototype of the cluster. This results in a partitioning of the data space into Voronoi cells.
III. RESULTS
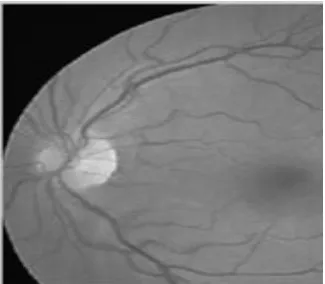
[image:4.595.313.549.127.664.2]Pre-processing the retinal image includes cropping masking and removal of noise from the original image. The figure 3 shows the result for cropped image here the left part of the image is cropped. The figure 4 shows the result for masking an retinal image i.e. sharpening the original image.The figure 5 shows the results for removal of various noise using fuzzy filter.
Figure 3 Cropped image
Figure 4 Masked image
[image:4.595.84.247.502.644.2]International Journal of Emerging Technology and Advanced Engineering
Website: www.ijetae.com (ISSN 2250-2459, ISO 9001:2008 Certified Journal, Volume 5, Issue 1, January 2015)
[image:5.595.50.281.137.531.2]307
[image:5.595.357.508.140.412.2]Figure 6 Gradient of original image (top), level 1 defocused image (middle), level 2 defocused image (bottom).
Figure 7 Final results for focus assessment
Figure 6 shows the gradient i.e., magnitude and direction of the original image intensity and image defocused at various levels. Blurred image is given as input which is correctly classified by the neural classifier. Figure 7 here y=0 means blurred image, y=1 means bordered image and y=2 means focused image.
[image:5.595.336.524.496.759.2]International Journal of Emerging Technology and Advanced Engineering
Website: www.ijetae.com (ISSN 2250-2459, ISO 9001:2008 Certified Journal, Volume 5, Issue 1, January 2015)
[image:6.595.50.284.108.486.2]308
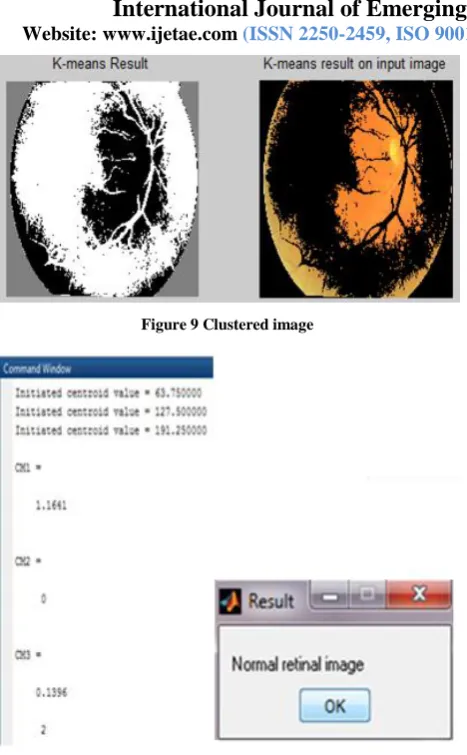
Figure 9 Clustered image
Figure 10 Final results for colour assessment
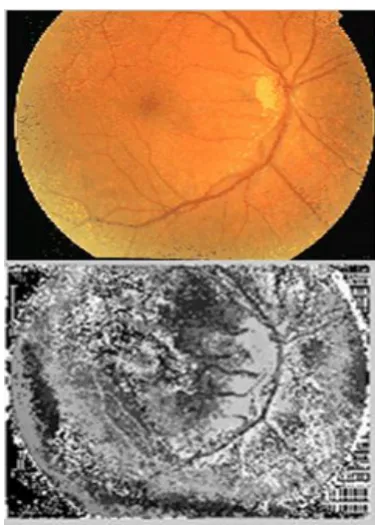
Figure 8 shows the indexed gray and colour image. Figure 9 shows the result for the clustered image. Figure 10 shows the final result for colour assessment. The centroid values for dark, bright and normal image is displayed in the command window. Here final value 0 means dark image, 1 means bright image and 2 means normal image
IV. CONCLUSION
The proposed retinal image quality assessment algorithm relies on the measure of generic image features, namely colour, focus, contrast and illumination computed using specific algorithms.
This individual image quality indicators classification is very important as it produces partial image quality indicators which can be used for real time quality assessment. In this work colour assessment and focus
assessment are performed separately and the
corresponding results have been obtained. In the future work along with colour and focus assessment of retinal image contrast and illumination assessment has to be performed individually. In addition to it all those quality indicators are combined together and classified to assess the image quality. Along with this work performance of the classifier is evaluated by computing sensitivity and specificity.
REFERENCES
[1] Ahmad.M.A.2007, Focus measure operator using 3D gradient, in: International Conference on Machine Vision, pp. 18–22. [2] Bartling.H, Wanger.P, Martin.L. 2009, Automated quality
evaluation of digital fundus photographs, Acta Ophthalmologica 87,643–647.
[3] Davis.H, Russell.S.2009, Vision based, real time retinal image quality assessment, in: 22nd IEEE International symposium on computer-based medical systems, pp.1-6.
[4] Fleming A.D, Philip.S, Goatman.K.A, Olson.J.A, Sharp.P.F. 2006, Automated assessment of diabetic retinal image quality based on clarity and field definition, Investigative Ophthalmology & Visual Science 47 1120–1125...
[5] Giancardo.L,Abramoff.M.D,Chaum.E.2008,Ellipitical local vessel density : a feast and robust quality metric for retinal image, in: conference proceeding of the international conference of IEEE Engineering in medicine and biology society,pp.3534-3537 [6] Haar.F. 2005 Automatic Localization of the Optic Disc in Digital
Colour Images of the Human Retina, Utrech University. [7] Kautsky.J, Flusser.J, Zitová.B, Šimberová.S,. 2002, A new
wavelet-based measure of image focus, Pattern Recognition Letters 23.1785–1794.
[8] Lalonde.M, Gagnon.L, Boucher.M.C.2001, Automatic visual quality assessment in optical fundus images, Proceedings of Vision Interface 259–264.
[9] Lee.J, Lee.W.H, Jeong.D. 2003, Object tracking method using back-projection of multiple colour histogram models, in: Proceedings of the 2003 International Symposium on Circuits and Systems, pp. 668–671.