International Journal of Emerging Technology and Advanced Engineering
Website: www.ijetae.com (ISSN 2250-2459, ISO 9001:2008 Certified Journal, Volume 7, Issue 3, March 2017)
Performance Analysis of Dye Sensitized Solar Cell Using
Polymer Electrolytes with Methyl violet (C
24
H
28
N
3
CI) and
Malachite green (C
23
H
25
CIN
2
) Dyes
Atishay Dixit
1, S.D.Dixit
2, C.K.Dwivedi
3Department of Electronics and Communication, (J K Institute of Applied Physics), University of Allahabad, India
Abstract-- DSSC’s is fabricated with the help of PEO based polymer electrolyte composite film by using two different dyes. The properties of the polymer electrolyte film with both the dyes were studied by morphological measurement like optical microscope and infrared spectroscopy technique. The electrical properties measured by impedance spectroscopy show the effect of dyes on pristine electrolyte prepared by sol cast method. The cell efficiency has been measured with the help of solar simulator and kithley meter.
Keyword-- PEO, Dyes, DSSC
I. INTRODUCTION
Renewable energy is source of energy in which we can utilize the natural resources like sun, water or air. To solve the issue of energy problem in the world, solar energy is a better option. Since 1991 when Gratzel and O'Regan [1] have reported the Dye Sensitized Solar Cell (DSSC) it has been intensively investigated as a low cost alternative to exploit solar energy. In DSSC, dye plays an important role in absorbing the solar radiation. Nowadays scientists are focused on natural and organic dyes in place of Ruthenium or Osminum based dyes. The use of Methyl violet (C24H28N3CI) and Malachite green (C23H25CIN2) are less studied for the use of DSSC. Methyl violet is a triphenyltmethane dye, with one dimethylamino group on each phenyl ring. Malachite green (C23H25CIN2) has similar chemical structure to Methyl violet (C24H28N3CI), but it has only two out of three phenyl rings substituted with dimethylamino groups, allowing a partial planar structure of Malachite green (C23H25CIN2). The presence of auxochrome groups
in the dye molecules is responsible for high intensity of absorption spectra in the visible region [3-4]. Polymer electrolyte based DSSCs are became more popular due to their low cost, high efficiency and better flexibility. The advantage of the solid polymer electrolyte is the ionic conductivity which occurs in the amorphous phase which is useful for photo electrochemical cells. Poly (ethylene oxide) (PEO) semi crystalline material and coordinates with a range of inorganic salt such as LiI, NaI, LiAc. Lithium acetate is basically salt of lithium and acetic acid. Lithium acetate salt is usually used because it easily liberates lots of lithium ions which help in charge transportation which helps in improving the conductivity of polymer host. In PEO the repeating units (-CH2-CH2 -O-) present a favorable arrangement for effective interaction of free electron pair on the oxygen with the alkali metal cations.
In this paper we investigate the effect of dyes on the ionic conductivity of polymer electrolyte (PEO-Li Acetate (CH3COOLi)) and performance of a solar cell
[image:1.612.170.445.598.729.2]using polymer electrolyte. To understand the ionic conductivity behavior, the dielectric properties of the pristine and blend electrolyte are analyzed using impedance spectroscopy, dielectric relaxation properties. The structural properties of the electrolyte are studied by the FTIR spectrometer and optical microscope and the cell efficiency has been investigated with the help of solar simulator (Oriel SOL3A 2x2 450W SOLAR SIMULATOR) and kithley meter.
International Journal of Emerging Technology and Advanced Engineering
Website: www.ijetae.com (ISSN 2250-2459, ISO 9001:2008 Certified Journal, Volume 7, Issue 3, March 2017)
197
II. EXPERIMENTALII A. Preparation of electrolyte
The polymer electrolyte has been prepared by using polymer PEO with (M.W.~6X10⁵) and salt Lithium acetate (CH3COOLi) with two dyes, Methyl violet, and Malachite
green. To get the polymer electrolyte film, PEO and salt (LiAc) separately dissolved in a common solvent like methanol and stirred for 8-10 hours, then dispersed the desired dye in a known stchiometric ratio. Finally the gelatinous solution is poured in PC Petridis to evaporate the solvent in the room temperature to obtain the standing gel film for further studies simultaneously other film were developed using other dyes.
II B. Fabrication of DSSC
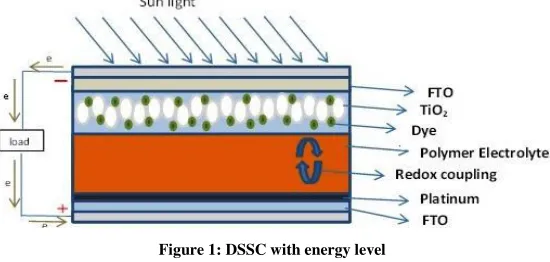
DSSC is a sandwiched type structure clamped with dye sensitized photo electrode with a Platinum coated FTO counter electrode as shown in Fig 1. The polymer gel film was used as a gel electrolyte. The prepared cell is then kept in dark and used for photo voltage-current observations using solar simulator (Oriel SOL3A 2x2 450W SOLAR SIMULATOR).
III. RESULT AND DISCUSSION
III A. Optical Properties
The optical micrograph of the pristine and films with both the dyes are shown in Fig.2 The surface morphology of the pristine film show decrease in the surface roughness and no lamellar pattern of PEO are observed under the microscope. This can be attributed to the intercalation of salt with PEO respectively resulting in the reduction of crystallinity of host polymer and subsequent enhancement in the overall amorphous fraction in the materials. From the figure (B)(C)(D) it is clearly seen that both the dyes methyl violet and Malachite green are properly distributed in the {90PEO-10(CH3COOLi)} film which is beneficial for solar
cell application because it can absorb light better as compared to pristine. In the solution casted film of {90PEO-10(CH3COOLi)} with malachite green some small
pores are visible due to evaporation of the solvent during the preparation while such pores are not visible for crystal violet film.
Fig2: Optical micrograph of polymer electrolyte (A) [(90PEO):10(CH3COOLi))] (B) [99[(90PEO):10(CH3COOLi))]:1(C24H28N3CI)] and (C) [99[(90PEO):10(CH3COOLi))]:1(C23H25CIN2)]..
III B. FTIR Spectrum
To investigate the coordination effect between PEO polymer and Dyes, the FTIR spectrum of (90PEO+10(CH3COOLi) with dye complexes are shown in Fig.3. The prominent peak of the pristine and dye based films are given in table-1. The change involve during the
International Journal of Emerging Technology and Advanced Engineering
[image:3.612.216.405.134.277.2]Website: www.ijetae.com (ISSN 2250-2459, ISO 9001:2008 Certified Journal, Volume 7, Issue 3, March 2017)
[image:3.612.82.529.319.527.2]Fig 3: FTIR spectra for polymer electrolyte systems [(90PEO):10(CH3COOLi)], [99[(90PEO): 10(CH3COOLi)]:1(C23H25CIN2)] and 99[[(90PEO: 10(CH3COOLi)]:1(C24H28N3CI)].
Table 1:Position and assignment of prominent peak obtained in different electrolyte system.
[(90PEO):10(CH3COOLi)]
[99[(90PEO):10(CH3CO OLi))]:1(C23H25CIN2)]
[99[(90PEO):10(CH3CO OLi))]:1(C24H28N3CI)]
Assignments
545 540
C-Br (alkyl)
840 840 842 =C=C=H
956 954 952 P-O-P
1095 1099 1101
CH-O or C-H-O
1280 1282 1280
C-N=O
1463 1463 1463
-CH3 or =CH2
1552
=NH
1569
-N=N- III C. Variation of ionic conductivity
The variation of conductivity with frequency at different temperature is shown in Fig.4 it is seen that initially at lower frequency the conductivity increases followed by a plateau and then increased for the complete temperature range. This behavior is well governed by universal power
International Journal of Emerging Technology and Advanced Engineering
Website: www.ijetae.com (ISSN 2250-2459, ISO 9001:2008 Certified Journal, Volume 7, Issue 3, March 2017)
[image:4.612.191.437.132.314.2]199
Fig 4 Variation of ionic conductivity for polymer electrolyte systems [99[(90PEO): 10(CH3COOLi)]:1(C24H28N3CI)], [99[(90PEO): 10CH3COOLi)]: 1(C24H28N3CI)] and [(90PEO): 10(CH3COOLi)] at different frequencies.
Variation of conductivity with temperature of two electrolyte system are shown in Fig.5.The conductivity of film with single and double dye initially decreases with the temperature and after certain temperature i.e. 65-80 it start to increase. This decrease is attributed to the phase change of PEO at 68oC. Another important fact is film with
malachite green dye does not sustain after 110oC. The other film shows the stable behavior upto 200oC. In 80-200oC the variation of conductivity is almost constant in dye loaded film.
Fig5: Variation of ionic conductivity of polymer electrolyte [99[(90PEO):10(CH3COOLi))]:1(C23H25CIN2)], [99[(90PEO):10(CH3COOLi))]:1(C24H28N3CI)] as a function of different temperatures
III D. Dielectric Properties
The variation of dielectric constant and dielectric loss with frequency at different temperature is shown in Fig-6 and Fig-7.The dielectric loss for film prepared by solution
International Journal of Emerging Technology and Advanced Engineering
Website: www.ijetae.com (ISSN 2250-2459, ISO 9001:2008 Certified Journal, Volume 7, Issue 3, March 2017) strong dielectric dispersion was observed in all the films
with increasing temperature which reflects a Non-Debye
[image:5.612.147.465.146.395.2]relaxation in composite electrolyte systems.
Fig 6: Variation of dielectric constant for polymer electrolyte systems [(90PEO): 10(CH3COOLi)], [99[(90PEO): 10(CH3COOLi)]:1(C23H25CIN2)],] and [99[(90PEO): 10(CH3COOLi)]: 1(C24H28N3CI)], at different frequencies.
Fig 7: Variation of dielectric Loss for polymer electrolyte systems [(90PEO): 10(CH3COOLi)], [99[(90PEO): 10(CH3COOLi)]:1(C23H25CIN2)],] and [99[(90PEO): 10(CH3COOLi)]:1(C24H28N3CI)], at different frequencies
III E. Tangent Loss
It is observed that tangent loss, broad relaxation peak is seen and peak is shift towards higher frequency with the increase of temperature. From the figure it is clear that f0
[image:5.612.170.445.424.644.2]International Journal of Emerging Technology and Advanced Engineering
Website: www.ijetae.com (ISSN 2250-2459, ISO 9001:2008 Certified Journal, Volume 7, Issue 3, March 2017)
201
broad relaxation and more sifting towards the higher frequency is seen in the both dye based films.III F. UV-VIS Absorption Characteristics
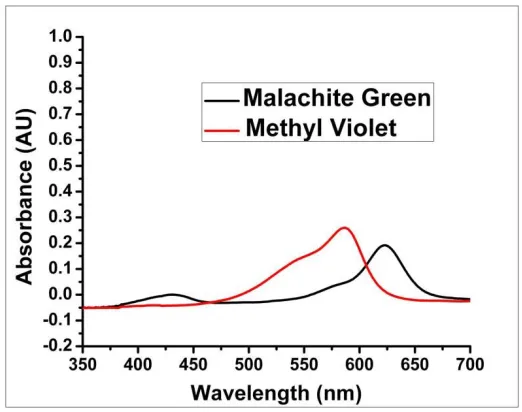
UV-VIS absorption characteristics of Methyl violet (C24H28N3CI) and Malachite green (C23H25CIN2) dye dissolved in the solvents Chloroform have been recorded with the help of photodiode array spectrophotometer
[image:6.612.204.465.237.443.2](model-Perkin Elmer Lambda 35 UV visible spectro photometer) and are shown in Fig.8. The absorption characteristics are in the visible region (350nm-700nm) for both the cases of dyes dissolved in Chloroform.
Fig. 8 UV-VIS absorption characteristics of Methyl violet (C24H28N3CI) and Malachite green (C23H25CIN2) dye dissolved in Chloroform
III G. Photovoltaic Characteristic
The current-voltage characteristics of DSSCs sensitized with Methyl violet (C24H28N3CI) and Malachite green (C23H25CIN2) dye dissolved in Chloroform are shown in Fig.9. The Keithley electrometer (model 2400) has been used to record the current density characteristics under the illumination of 0.89 mW per mm square. The photovoltaic parameters are determined and tabulated in Table1. It is observed that efficiencies of the cells designed using Methyl violet (C24H28N3CI) Malachite green (C23H25CIN2) dyes dissolved in Chloroform are (0.017%and 0.079%) is not showing a good response. This is possibly due to
reduced adsorption of dye molecules on TiO2 layer in this case. The fill factor (FF) is calculated as 𝐹𝐹 = 𝐼𝑚𝑎𝑥∗𝑉𝑚𝑎𝑥
𝐼𝑠𝑐∗𝑉𝑜𝑐
International Journal of Emerging Technology and Advanced Engineering
[image:7.612.183.432.142.340.2]Website: www.ijetae.com (ISSN 2250-2459, ISO 9001:2008 Certified Journal, Volume 7, Issue 3, March 2017)
Fig 9: Current Density versus output Voltage curves for systems [99[(90PEO): 10(CH3COOLi)]:1(C23H25CIN2)],] and [99[(90PEO): 10(CH3COOLi)]:1(C24H28N3CI)]
Dye
J
sc(mA/cm
2)
V
OC(V)
FF
%
Methyl violet (C24H28N3CI)
0.242 0.235 27% 0.017%
Malachite green (C23H25CIN2)
0. 385 0.348 52% 0.079%
IV.CONCLUSIONS
The incorporation of dyes has shown a significant influence on different temperature ionic conductivity of the polymer electrolyte. As we can say that incorporation of different dye will produce good result in all the observation that is observed in this paper. The temperature dependence of conductivity of SPEs shows the VTF type. The cell efficiency of these dye are not showing some good response but in case of stability there is some good response because of polymer electrolyte
REFERENCES
[1] B. O’Regan and M. Gratzel, Nature, 353 (1991) 737.
[2] Z.L. Zhu, P.X. Jun, C.X. Qiag and F.J. Li, Development of Rhodamine B for biomedical application. The proceedings of third international conference on funcional molecules, 85-88.
[3] D. Bora and S. Hazarika, optical properties of malachite green dye doped SiO2 GLASSES: effect of transition metals used as codopant,
Int J of optics, 2014, 865814.
[4] S. Kantesaria, optimization of dsscs through co absorption and tri absorption of organic dyes.
![Fig 3: FTIR spectra for polymer electrolyte systems [(90PEO):10(CH3COOLi)], [99[(90PEO): 10(CH3COOLi)]:1(C23H25CIN2)] and 99[[(90PEO: 10(CH3COOLi)]:1(C24H28N3CI)]](https://thumb-us.123doks.com/thumbv2/123dok_us/8687763.876368/3.612.216.405.134.277/ftir-spectra-polymer-electrolyte-systems-cooli-cooli-cooli.webp)
![Fig 4 Variation of ionic conductivity for polymer electrolyte systems [99[(90PEO): 10(CH3COOLi)]:1(C24H28N3CI)], [99[(90PEO): 10CH3COOLi)]: 1(C24H28N3CI)] and [(90PEO): 10(CH3COOLi)] at different frequencies](https://thumb-us.123doks.com/thumbv2/123dok_us/8687763.876368/4.612.191.437.132.314/variation-conductivity-polymer-electrolyte-systems-cooli-different-frequencies.webp)
![Fig 6: Variation of dielectric constant for polymer electrolyte systems [(90PEO): 10(CH3COOLi)], [99[(90PEO): 10(CH3COOLi)]:1(C23H25CIN2)],] and [99[(90PEO): 10(CH3COOLi)]: 1(C24H28N3CI)], at different frequencies](https://thumb-us.123doks.com/thumbv2/123dok_us/8687763.876368/5.612.170.445.424.644/variation-dielectric-constant-polymer-electrolyte-systems-different-frequencies.webp)
![Fig 9: Current Density versus output Voltage curves for systems [99[(90PEO): 10(CH3COOLi)]:1(C23H25CIN2)],] and [99[(90PEO): 10(CH3COOLi)]:1(C24H28N3CI)]](https://thumb-us.123doks.com/thumbv2/123dok_us/8687763.876368/7.612.183.432.142.340/current-density-versus-output-voltage-curves-systems-cooli.webp)
