Journal of Chemical and Pharmaceutical Research, 2012, 4(7):3688-3694
Research Article
ISSN : 0975-7384
CODEN(USA) : JCPRC5
Method development and validation of nicardipine hydrochloride in bulk and
formulation using UV spectrophotometric method
Amala Mateti, Kiran Aarelly, Manish Kumar Thimmaraju and N. Raghunandan
Department of Pharmaceutical Analysis, Balaji Institute of Pharmaceutical Sciences,
Narsampet,Warangal, Andhra Pradesh, India
_____________________________________________________________________________________________
ABSTRACT
The present study describes a simple, accurate, precise, specific and highly sensitive method for the determination of Nicardipine Hydrochloride present in pharmaceutical dosage forms. The method is validated for the determination of Nicardipine Hydrochloride in bulk and tablet dosage form. The solvent used was acetonitrile: water (50:50) and the λmax or the absorption maxima of the drug was found to be 235nm. A linear response was observed in the range of 5-25µg/ml with a regression coefficient of 0.999. The linear regression equation obtained by least square regression method were y=0.249X+0.008, where y is the absorbance and x is the concentration of the pure drug solution. The. The method was validated for several parameters like accuracy, precision as per ICH guidelines. The values of relative standard deviation and % recovery were found to be satisfactory, indicating that the proposed method is precise and accurate and hence can be used for the routine analysis of Nicardipine Hydrochloride in bulk and pharmaceutical formulation.
Keywords: Nicardipine hydrochloride, λmax, ICH, UV-VIS spectroscopy
_____________________________________________________________________________________________
INTRODUCTION
Nicardipine hydrochloride, 2-(N-benzyl-N-methylamino)ethyl methyl 1,4-dihydro- 2,6-dimethyl-4-(m-nitrophenyl)-3,5-pyridinedicarboxylate monohydrochloride, is a calcium antagonist with highly potent vasodilating activity and has been widely used for the treatment of hypertension and cerebrovascular disease[1]. Although nicardipine is rapidly and completely absorbed from the gastro-intestinal tract after oral administration to humans and laboratory animals, its plasma concentrations are relatively low due to extensive first-pass metabolism in the liver [1,2].
______________________________________________________________________________
Fig.1-Nicardipine structure:
EXPERIMENTAL SECTION
Instrument
UV-Visible SpectrophotometerT60 (model), Analytical technologies Limited, connected to the digital system
loaded with UV-Win software ver.5.1.1 have an wavelength accuracy of ±5.0nm with quartz cells of 1cm path length.
Reagents and materials
Working standard of pharmaceutical grade Nicardipine Hydrochloride was procured locally and other chemicals used were of AR grade and purchased from SD fine chemicals, Mumbai.
Preparation of standard stock solution
10 mg of pure Nicardipine Hydrochloride was dissolved separately in acetonitrile solvent and final volume was made up with water to produce a concentration of 100 µg ml–1 which is the standard stock solution.
Selection of wavelength
In order to ascertain the wavelength of maximum absorption (λmax) of the drug, different solutions of the drugs (5
µg/ml and 25 µg/ml) in 50% acetonitrile were scanned using spectrophotometer within the wavelength region of 200 – 400 nm against 50% acetonitrile as blank. The resulting spectra shown in Figure-2 and the absorption curve showed characteristic absorption maxima at 235nm for Nicardipine Hydrochloride . overlay absorption spectrum showed in Figure-3
______________________________________________________________________________
Figure.3:: Overlay Absorption Spectrum of Nicardipine Hydrochloride
Calibration standards
[image:3.595.149.449.347.529.2]From the standard stock solution of nicardipine hydrochloride , different concentrations were prepared respectively in the range of 5-25µg/ml and measured absorbance at 235nm.The calibration curves were plotted (Figure-4) and data presented in Table 1.
Figure 4: Calibration curve of Nicardipine Hydrochloride
VALIDATION
Validation can be defined as (ICH) Establishing documented evidence, which provides a high degree of assurance that a specific activity will consistently produce a desired result or product meeting its predetermined specifications and quality characteristics[10]. The method was validated for several parameters like linearity, accuracy, precision, Ruggedness, Robustness, Limit of detection(LOD), Limit of quantification(LOQ) according to ICH guidelines.
TABLE 1:Linearity table of Nicardipine Hydrochloride
Concentration (µg /ml)
Absorbence
5 0.263
10 0.49
15 0.771
20 1.004
25 1.252
Linearity
[image:3.595.227.369.621.691.2]______________________________________________________________________________
the standard solution of the drug were prepared from stock solution and analysed. The drug showed linearity in the range of 5-25µg/ml with correlation coefficient 0.999. Linearity data are shown in Table1.
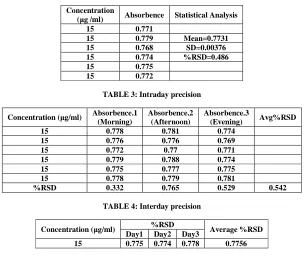
Precision
Precision studies were carried out to ascertain the reproduciblity of the proposed method. Repeatablity was determined by preparing six replicates of same concentration of the sample and the absorbance was measured. Intraday precision study was carried out by preparing drug solution of same concentration and analyzing it at three different times in a day. The same procedure was followed for three different days to determine interday precision.
The results was reported as %RSD. The precision result showed a good reproducibility (Table 2) with percent relative standard deviation less than 2. The results of intraday and interday precision studies are shown in (Table 3
and Table 4).
TABLE 2: Precision results showing repeatability
Concentration
(µg /ml) Absorbence Statistical Analysis 15 0.771
15 0.779 Mean=0.7731 15 0.768 SD=0.00376 15 0.774 %RSD=0.486 15 0.775
15 0.772
TABLE 3: Intraday precision
Concentration (µg/ml) Absorbence.1 (Morning) Absorbence.2 (Afternoon) Absorbence.3 (Evening) Avg%RSD
15 0.778 0.781 0.774
15 0.776 0.776 0.769
15 0.772 0.77 0.771
15 0.779 0.788 0.774
15 0.775 0.777 0.775
15 0.778 0.779 0.781
[image:4.595.146.452.264.521.2]%RSD 0.332 0.765 0.529 0.542
TABLE 4: Interday precision
Concentration (µg/ml) %RSD Average %RSD Day1 Day2 Day3
15 0.775 0.774 0.778 0.7756
Accuracy
[image:4.595.73.525.610.718.2]Accuracy of the proposed method was determined using recovery studies. The recovery studies were carried out by adding different amounts (80%,100%,120%) of the pure drug to the pre-analysed formulation. The solutions were prepared in triplicates and the % Recovery was calculated. The results are shown in (Table 5).
TABLE 5: Accuracy readings of Nicardipine Hydrochloride
Labelled claim (mg) Level of Addition(%) Amount of pure drug added(mg) %Recovery Statistical Analysis MEAN SD %RSD
30 80 24 100.05
30 80 24 98.89 99.085 0.275772 0.278318
30 80 24 99.28
30 100 30 101.5
30 100 30 100.8 100.6 1.014869 1.008836
30 100 30 99.5
30 120 36 99.54
30 120 36 100.94 100.1267 0.727003 0.726083
______________________________________________________________________________
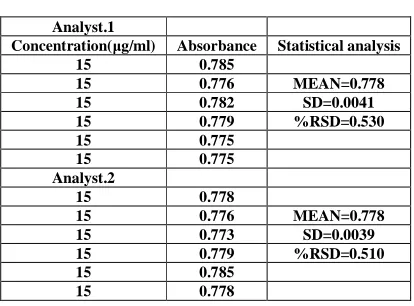
Ruggedness
[image:5.595.195.402.158.311.2]Ruggedness was determined by carrying out analysis by two different analyst and the respective absorbance was noted and the results was indicated as % RSD (Table6)
TABLE 6: Results showing Ruggedness
Analyst.1
Concentration(µg/ml) Absorbance Statistical analysis
15 0.785
15 0.776 MEAN=0.778 15 0.782 SD=0.0041 15 0.779 %RSD=0.530
15 0.775
15 0.775
Analyst.2
15 0.778
15 0.776 MEAN=0.778 15 0.773 SD=0.0039 15 0.779 %RSD=0.510
15 0.785
15 0.778
Robustness
Analysis was carried out at two different temperatures, room temperature and at 180c to determine the robustness ofthe method and the respective absorbance was measured. The results was indicated as %RSD (Table7)
TABLE7: Results showing robustness
Room temperature
Concentration(µg/ml) Absorbance Statistical analysis
15 0.771
15 0.776 MEAN=0.773
15 0.768 SD=0.0049
15 0.769 %RSD=0.636
15 0.775
15 0.781
Temperature 18 degree cenrigrade
15 0.788
15 0.778 MEAN=0.780
15 0.785 SD=0.0053
15 0.773 %RSD=0.691
15 0.781
15 0.778
TABLE 6: Summary of the method developed
PARAMETER RESULT Absorption maximum 235nm Beers law range 5-25 µg/ml Correlation coefficient 0.999 Regression equation 0.249X+0.008
Slope 0.249
Intercept 0.008 Accuracy 98.8-101.5%
Precision(%RSD) Intraday(0.542), interday(0.775) LOD 0.1032 µg/ml
LOQ 0.3130 µg/ml
LOQ and LOD
______________________________________________________________________________
The values of LOQ and LOD were found to be be 0.1032and 0.3130 µg/ml respectively.
The results of various parameters of the developed method are shown in TABLE 6.
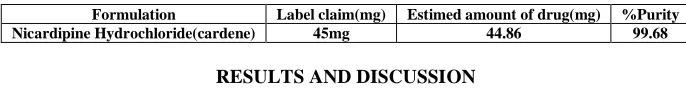
Quantification in dosage form
[image:6.595.125.468.256.300.2]To analyse the concentration of drug in the pharmaceutical formulation, Twenty tablets were accurately weighed and powdered. Tablet powder equivalent to 100mg was accurately weighed and transferred to a 100ml volumetric flask, dissolved in acetonitrile, sonicated, and finally made up the volume with 50% acetonitrile. The solution was centrifuged for the excipients to settle down and the resulting solution was filtered using whatsmann filter paper no1.The solution was suitably diluted so as to obtain a concentration in the linearity range and the absorbance was measured at 235nm against 50% acetonitrile as blank. The result of analysis are shown in (Table 7).
TABLE 7: Quantification in dosage form
Formulation Label claim(mg) Estimed amount of drug(mg) %Purity Nicardipine Hydrochloride(cardene) 45mg 44.86 99.68
RESULTS AND DISCUSSION
The proposed method provides a simple , accurate, economical and convinient method for the analysis of Asenapine maleate using UV spectrophotometry. The wavelength corresponding to maximum absorbance in methanol was found at 235nm. Beers law was obeyed in the concentration range of 5-25µg/ml with correlation coefficient 0.999. Acurracy of the proposed method was determined by the recovery studies, and good %Recovery (98.8- 101.5%) of the drug obtained indicate that the method is accurate. The method was found to be precise as %RSD values for interday and intraday was found to be less than 2. The method was also found to be rugged and robust as the % RSD values were found to be less than 2. The limit of detection and limit of quantification of the proposed method was found to be 0.1032and 0.3130 µg/ml indicating that the method developed is sensitive. The results of assay obtained was found to be in good agreement with the labeled claim, indicating the absence of interference of the excipients.
CONCLUSION
The developed method can be concluded to be simple, accurate, reliable and economical.The proposed method is specific without and interference of excepients and hence can be used for the routine analysis of Nicardipine Hydrochloride in bulk and in pharmaceutical formulation.
Acknowledgement
One of the authors (Amala Mateti) is thankful to Dr.N.Raghunandan, Principal, Balaji Institute of Pharmaceutical Sciences, Narsampet, Warangal for his constant encouragement throughout the research and very much thank full to Manish Kumar Thimmaraju, HOD of Pharmaceutical Analysis, Balaji Institute of Pharmaceutical Sciences, Warangal, for his guidance, kind help and constant encouragement at every step during the progress of my work The authors are also grateful to the chairman Dr.A.Rajendra Prasad Reddy, Balaji Institute of Pharmaceutical Sciences, Narsampet, Warangal for providing research facilities.
REFERENCES
[1]EM Sorkin; SP Clissol,Drugs 1987, 33, 296.
[2]S Higuchi; Y Shiobara, Xenobiotica. 1980 Jun10(6),447–454.
[3]I Escrig-Tena; LA Rodriguez; J Esteve-Romero;MC Gracia Alvarez,Talanta 1998, 47,43-52. [4]G Rango ;C Vetuschi ;A Risoli;G Ioele,Talanta 2003, 59,375-382.
[5]B Marciniec;M Orgodowczyk , Acta Pol Pharama 2006,63,477-484.
[6]M Sheikha; A Ghannam ;M Abeer;A Olyan,Central European journal of chemistry 2008,6,222‐228. [7]D Obendorf and G Stubauer, J Pharm Biomed Anal 1995,13,1339-1341.
[8]S A Ozkan;B Uslu and H Y Aboul- Enein. Critical Review Anal Chem 2003,33, 155-181. [9]Z Atkosar; G Altiokka and M Tuncel,Pharmazie 1997, 52,959-960.
[10]T Martin;T K Mary;H Chi; Malcolm R S. J Pharm Biomed Anal1991; 9:889-893.
______________________________________________________________________________
[13]Fernandez C M and Veiga F J B, Biomed Chromatogr, 2003, 17, 33-38.
[14]Ke Li, Xin Zhang, Yi-sheng Yuan and Fei-lang Zhao, Biomed Chromatogr, 1998, 12, 326-329. [15]Q Meiling;W Peng; X Jin. J Chromatogr B 2006,830,81-85.
[16]R Bakhtiar;F L Tse; Rapid Commun. Mass Spectrom. 2000,14,1128-1135.
[17]Sh-M chen ; M C Hsieh M; Chao Su-Hui, E EChang E; Wang Po-Yu,An-Bang Wu. Biomed Chromatogr 2008, 22,1008-1012.
[18]18.Owusu-Ware, S.K. and Antonijevic, Milan D, The AAPS Journal, 2009,ISSN 1550-7416.
[19]19.R Pomponio; R Gotti ; J Fiori; V Cavrini; P Mura; M Crri; F Maestrelli, Biomed Anal. 2004,35,267-275. [20]20. M C Bonferoni; G Mellerio; P Giunchedi; C Caramella,Conte U. Int. J. Pharmaceutics 1992,80, 109-117. [21]21. T Reiko; O Makoto; M Yoshihisa, International Journal of Pharmaceutics 2004, 286, 1-8.
[22]22. K E Ibrahim; R M Al-ashban; L B Babiker,E-Journal of Chemistry 2010,7(1),85- 92.