© 2017, IRJET | Impact Factor value: 5.181 | ISO 9001:2008 Certified Journal | Page 1367
Using Artificial Neural Network
Noopur Srivastava1, Vandana Vikas Thakare2
1,2
Department of Electronics, Madhav Institute of Technology & Science, Gwalior-05, India
---***---Abstract - This paper presents a design approach of band
pass FIR digital filter for cut-off frequency calculation using artificial neural network (ANN).In this work FDA Tool has been used for design of FIR band pass digital filter with hamming, hanning and Kaiser window because better frequency response has been achieved by these window for design of digital band pass filter than other window and ANN has been used for cut off frequency calculation with two algorithms namely feed forward back propagation and radial basis function.
The cut-off frequencies have been compared by NN Tool and FDA Tool, comparison has been done also for windows and algorithms.
Key Words
: Band pass FIR digital filter, FDA Tool, NNTool, hamming, hanning, Kaiser Window, FFBP, and RBF.1. INTRODUCTION
A filter is a device that discriminates of its input according to some attribute of the object. The digital filter can be implemented in both software and Hardware. Digital filter is a linear time invariant system (LTI) which does not vary with time. Digital filter have high accuracy, easy to simulate and design, flexible than analog filter [17]. Based on frequency characteristics digital filter is divided into four types-
Low pass filter (LPF)-Low pass filter only passes the low frequency components (≤wc).
High pass filter (HPF)-High pass filter only passes the high frequency components (≥wc).
Band pass filter (BPF)-Band pass filter only passes the frequency components between two frequencies (wc1&wc2).
Stop band filter (SBF)-Stop band filter does not passes the frequency components between two frequency (wc1&wc2).
In this section discussion has been done for the design of band pass FIR digital filter. The band pass filter can also be designed by combining of low and high pass filter.
There are two types of digital filter-
i. Finite impulse response filters (FIR). ii. Infinite impulse response (IIR).
The impulse response of FIR filter is finite so this is known as FIR digital filter. They do not use and feedback because they depends on present input and past input so it is also known as non recursive filter.FIR digital filter has linear phase
characteristics and they and inherently stable but IIR filter do not have linear phase characterstics.The impulse response of IIR digital filter is infinite so this is known as IIR digital filter. They requires feedback because they depends on present input, past input and past output so they are also known as recursive filter[10].
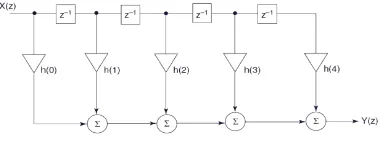
The output sequence is given as for FIR filter- Y(n)=
Y(n)=h(0)x(n)+h(1)x(n-1)+……+h(N)x(n-N)
[image:1.595.339.530.349.422.2]This sequence of output is finite so this is known as finite impulse response.
Figure 1. FIR digital filter
2.
FIR DIGITAL FILTER DESIGN USING WINDOW
METHOD
The window method is one of the simplest methods for design of FIR filter among the two method i.e. fourier series and frequency sampling. In the frequency sampling it only works for particular frequency components and for other it does not works. Window method is easy method and various windows can be used based on our application [5]. The desired unit sample response is given by
hd(n)=
h(n)=w(n)hd(n)
Where hd(w) is desired frequency response
characteristics.hd(n) is of infinite duration so hd(n) is
truncated by finite length of window(M-1) which is w(n).so h(n) will be of finite length duration.
In this paper three windows have been used which are-
Hamming window-hamming window is given by
wH(n)=
© 2017, IRJET | Impact Factor value: 5.181 | ISO 9001:2008 Certified Journal | Page 1368 Kaiser window- Kaiser Window is given as
wk(n)=
Where 1 and 2 is the ripple in pass band and stopband.wp
is pass band frequency and ws is stop band frequency. is a
shape parameter which is given as
And filter order is given by N=
Attenuation A= -20
The Kaiser window is best among other window because they have less transition band than other.
3. ARTIFICIAL NEURAL NETWORK (ANN)
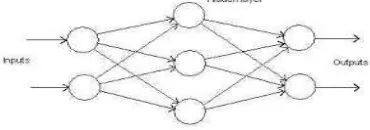
Artificial neural network is comprised of a network of artificial neurons (node) [15].neural network is an algorithm that based on the human brain works. They can build predicted model by learning the pattern of historical data.ANN made by interconnected processing element, these are known as node or neuron. Each node processes the small part of the task. The most common type of ANN is multi layer perceptron (MLP).in MLP the nodes are organized in layer. It is also known as parallel distributed processing system or connectionist system. The first layer is the input layer, the outer most layer stands for output layer. Between these two comes one or more layer known as hidden layer. The entire node is fully connected with the previous node. Input are multiplied by unique weight and added together by a small value called bias. This total is processed is by the function called the activation function.
f(u)=w1u1+w2u2+w3u3+b
Where w is weight is an input and b is a bias.
It leaves the node as output, this process proceeds till information reached at the output layer and leaves it as the prediction for the independent variable. The network compares predicted and actual output. If these do not match it adjust all the weight and repeat the process till the network produce an accurate prediction for most of the observation.
There is various algorithms use in ANN this are-
[image:2.595.340.525.106.171.2]Feed forward back propagation- a feed forward network has feedback paths meaning they can have signals travelling using loops. This system is nonlinear dynamic system because there is a loop which changes until it reaches state of equilibrium. In this the data flows in forward direction and error flows in reverse direction.
Figure 2. Feed forward network
Feed forward distributed time delay algorithm-In this algorithm whose basic function is to work on sequential data. Time delay represents the time shift usually form part of a larger pattern recognition system. It is mainly use to represent the relation between time and input.
Radial basis function- It is a real value function whose value depends only on the distance from the origin or alternatively on the distance from some other point C, called a center. The norm is usually euclidean distance although other distance function is also possible. Radial basis function has more number of neurons than other algorithm so it gives better result than another algorithm.
4.
FORMULATION OF PROBLEM
The objective of this paper is to be estimated the cut-off frequency of proposed filter coefficients of band pass FIR digital filter which is achieved by FDA Tool using hamming, hanning and Kaiser Window. In this the input has been used as filter coefficient and target has been used as cut off frequency for which these filter coefficient have. Some filter coefficients have been chosen which is worked as test input and the cut off frequencies using NN Tool have been estimated for this test input. The comparison has been done between hamming, hanning, Kaiser Window. Feed forward back propagation and radial basis function algorithm of ANN also have been compared.
5
. EXPERIMENTATION
Cut-off frequencies of band pass FIR digital filter have been calculated with three steps-
i. Step 1:
Band pass FIR digital filter has been designed by FDA Tool. The order of the filter has been chosen 38 because for low order the frequency response characteristics has not been properly obtained. The cut-off frequencies have been used in the form of normalized, varied from 0 to 1.
© 2017, IRJET | Impact Factor value: 5.181 | ISO 9001:2008 Certified Journal | Page 1369
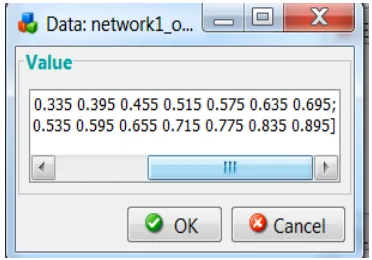
selected as,
ii. Step 2:
The MS excel file has been created for training input, target and testing input. These files have been loaded to MATLAB workspace.
iii. Step 3:
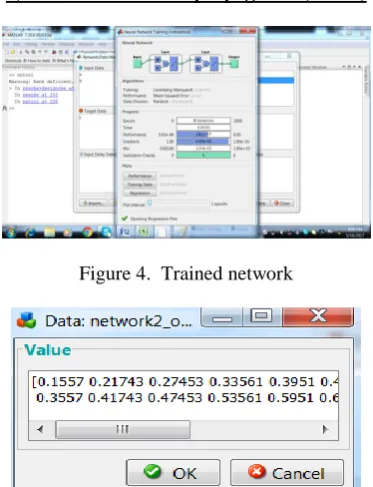
[image:3.595.341.526.257.387.2]A neural network has been created by using nntool box. Training algorithms have been selected as feed forward back propagation and radial basis function. After training, the network has been simulated by testing input. Then the cut-off frequencies have been compared by data from FDA Tool.
Figure 3. Filter designing by FDA Tool for hamming window
Cut off frequency calculation of Band pass FIR digital filter using hamming window
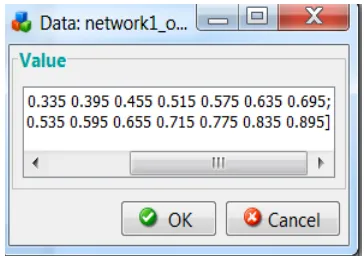
[image:3.595.74.250.294.400.2]a) Feed forward back propagation (FFBP)
Figure 4. Trained network
Figure 5.1 Result of FFBP network for hamming window
Figure 5.2 Result of FFBP network for hamming window
[image:3.595.342.526.421.543.2]Figure 6. Regression plot of FFBP for hamming window
Figure 7. Performance plot for FFBP for hamming window
b) Radial basis function (RBF)
[image:3.595.68.255.476.720.2] [image:3.595.344.523.583.713.2]© 2017, IRJET | Impact Factor value: 5.181 | ISO 9001:2008 Certified Journal | Page 1370
Figure 8.2 result of RBF for hamming window
Cut off frequency calculation of Band pass FIR digital filter using handing window
[image:4.595.77.275.265.551.2]a) Feed forward back propagation (FFBP)
[image:4.595.341.526.430.590.2]Figure 9. Trained network
[image:4.595.73.251.588.732.2]Figure 10.1 Result of FFBP network for hanning window
Figure 10.2 Result of FFBP network for hanning window
Figure 11. Regression plot of FFBP for hanning window
Figure 12. Performance plot for FFBP for hanning window
b) Radial basis function (RBF)
Figure 13.1 Result of RBF network for hanning window
[image:4.595.342.524.621.750.2]© 2017, IRJET | Impact Factor value: 5.181 | ISO 9001:2008 Certified Journal | Page 1371 using Kaiser Window
[image:5.595.327.539.59.378.2]a) feed forward back propagation (FFBP)
[image:5.595.67.258.128.311.2]Figure 14. Trained network
Figure 15.1 Result of FFBP network for Kaiser Window
Figure 15.2 Result of FFBP network for Kaiser Window
[image:5.595.66.257.135.482.2]Figure 16. Regression plot of FFBP for Kaiser Window
Figure 17. Performance plot for FFBP for Kaiser Window
b) radial basis function (RBF)
Figure 18.1 Result of RBF network for Kaiser Window
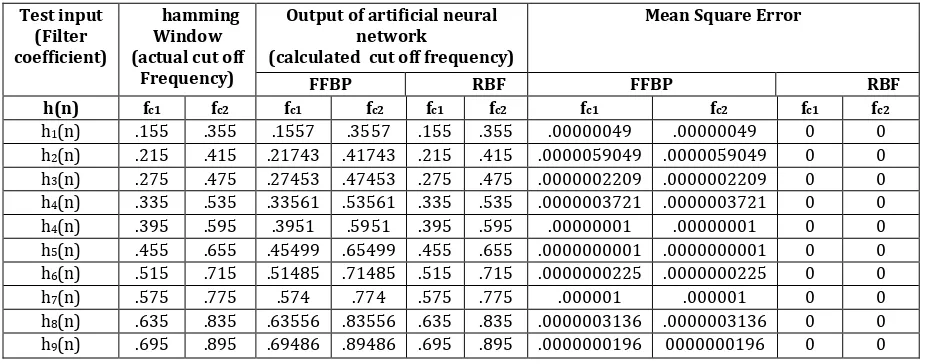
[image:5.595.338.524.405.555.2] [image:5.595.70.250.529.688.2] [image:5.595.340.526.599.729.2]© 2017, IRJET | Impact Factor value: 5.181 | ISO 9001:2008 Certified Journal | Page 1372 Test input
(Filter coefficient)
hamming Window (actual cut off
Frequency)
Output of artificial neural network
(calculated cut off frequency)
Mean Square Error
FFBP RBF FFBP RBF
h(n) fc1 fc2 fc1 fc2 fc1 fc2 fc1 fc2 fc1 fc2
h1(n) .155 .355 .1557 .3557 .155 .355 .00000049 .00000049 0 0
h2(n) .215 .415 .21743 .41743 .215 .415 .0000059049 .0000059049 0 0
h3(n) .275 .475 .27453 .47453 .275 .475 .0000002209 .0000002209 0 0
h4(n) .335 .535 .33561 .53561 .335 .535 .0000003721 .0000003721 0 0
h4(n) .395 .595 .3951 .5951 .395 .595 .00000001 .00000001 0 0
h5(n) .455 .655 .45499 .65499 .455 .655 .0000000001 .0000000001 0 0
h6(n) .515 .715 .51485 .71485 .515 .715 .0000000225 .0000000225 0 0
h7(n) .575 .775 .574 .774 .575 .775 .000001 .000001 0 0
h8(n) .635 .835 .63556 .83556 .635 .835 .0000003136 .0000003136 0 0
h9(n) .695 .895 .69486 .89486 .695 .895 .0000000196 0000000196 0 0
Table 2. Result of hanning window using ANN
Test input (Filter Coefficient)
hanning Window (actual cut off
Frequency)
Output of Artificial Neural Network
(calculated cut off frequency)
Mean Square Error
FFBP RBF FFBP RBF
h(n) fc1 fc2 fc1 fc2 fc1 fc2 fc1 fc2 fc1 fc2
h1(n) .155 .355 .15528 .35528 .155 .355 .0000000784 .0000000784 0 0
h2(n) .215 .415 .21459 .41459 .215 .415 .0000001681 .0000001681 0 0
h3(n) .275 .475 .27504 .47504 .275 .475 .0000000016 .0000000016 0 0
h4(n) .335 .535 .33394 .53394 .335 .535 .0000011236 .0000011236 0 0
h4(n) .395 .595 .3895 .5895 .395 .595 .00003025 .00003025 0 0
h5(n) .455 .655 .4532 .6532 .455 .655 .00000324 .00000324 0 0
h6(n) .515 .715 .51187 .71187 .515 .715 .0000097969 .0000097969 0 0
h7(n) .575 .775 .57321 .77321 .575 .775 .0000032041 .0000032041 0 0
h8(n) .635 .835 .63453 .83453 .635 .835 .0000002209 .0000002209 0 0
h9(n) .695 .895 .69285 .89285 .695 .895 .0000046225 .0000046225 0 0
Table 3. Result of Kaiser Window using ANN
Test input (Filter coefficient)
Kaiser Window (actual cut
off Frequency)
Output of artificial neural network
(calculated cut off frequency) Mean Square Error
FFBP RBF FFBP RBF
h(n) fc1 fc2 fc1 fc2 fc1 fc2 fc1 fc2 fc1 fc2
h1(n) .155 .355 .15567 .35567 .155 .355 .0000004489 0000004489 0 0
h2(n) .215 .415 .21418 .41418 .21498 .41498 .0000006724 0000006724 .0000000004 .0000000004
h3(n) .275 .475 .27404 .47404 .27499 .47499 .0000009216 .0000009216 .0000000001 .0000000001
h4(n) .335 .535 .33475 .53475 .335 .535 .0000000625 .0000000625 0 0
h4(n) .395 .595 .39593 .59593 .395 .595 .0000008649 .0000008649 0 0
h5(n) .455 .655 .45541 .65541 .455 .655 .0000001681 .0000001681 0 0
h6(n) .515 .715 .5145 .7145 .515 .715 .00000025 00000025 0 0
h7(n) .575 .775 .57232 .77232 .575 .775 .0000071824 .0000071824 0 0
h8(n) .635 .835 .63531 .83531 .635 .835 .0000000961 .0000000961 0 0
h9(n) .695 .895 .69439 .89439 .695 .895 .0000003721 .0000003721 0 0
[image:6.595.67.532.133.315.2]
© 2017, IRJET | Impact Factor value: 5.181 | ISO 9001:2008 Certified Journal | Page 1373
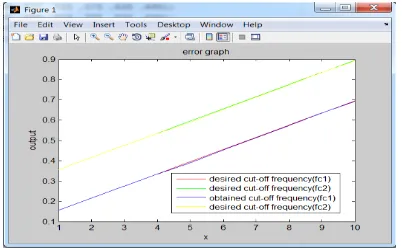
[image:7.595.335.546.81.226.2]In this experiment three tables have been achieved. First is for hamming window second is for hanning window and last third one is for Kaiser Window. By help of the table 1, 2 and 3. Various error graphs between desired and obtained frequency are drawn for various windows.
Figure 19. Error graph between desired cut-off frequencies and obtained cut-off frequencies for hamming window with
[image:7.595.54.260.184.301.2]FFBP
Figure 20. Error graph between desired cut-off frequencies and obtained cut-off frequencies for hamming window with
RBF
Figure 19 and 20 shows error graph between desired cut-off frequencies and obtained cut-off frequencies for hamming window with FFBP and RBF.
Figure 21. Error graph between desired cut-off frequencies and obtained cut-off frequencies for hanning window with
FFBP
Figure 22. Error graph between desired cut-off frequencies and obtained cut-off frequencies for hanning window with
RBF
[image:7.595.335.538.331.453.2]Figure 21 and 22 shows error graph between desired cut-off frequencies and obtained cut-off frequencies for hanning window with FFBP and RBF.
Figure 23. Error graph between desired cut-off frequencies and obtained cut-off frequencies for Kaiser Window with
FFBP
Figure 24. Error graph between desired cut-off frequencies and obtained cut-off frequencies for Kaiser Window with
[image:7.595.55.263.358.494.2]RBF
Figure 23 and 24 shows error graph between desired cut-off frequencies and obtained cut-off frequencies for Kaiser Window with FFBP and RBF.
[image:7.595.333.541.521.644.2] [image:7.595.58.259.599.723.2]© 2017, IRJET | Impact Factor value: 5.181 | ISO 9001:2008 Certified Journal | Page 1374
testing. So we have seen ANN gives efficient result in less time and it has been given result nearer to the actual one.
7. CONCLUSION
For finding that which window gives better result the mean square error (MSE) has been calculated for each window and for each algorithm. After this and it has been found that all window are given almost same result but hamming window is given the more efficient result than hanning and Kaiser Window. Out of two algorithms i.e. FFBP and RBF it has been found from various error graphs that RBF is best and better result is achieved by this almost same as actual one.RBF has highly accurate algorithm than other.
8. REFERANCE
[1] Chonghua Li, “Design and Realization of FIR Digital Filters Based on MATLAB”, IEEE 2010.
[2] Rohit Patel, .Mukesh Kumar, A.K. Jaiswal, Rohini Saxena,” Design Technique of Band pass FIR filter using Various Window Function” IOSR Journal of Electronics and Communication Engineering (IOSR-JECE), Volume 6, Issue 6 (Jul. - Aug. 2013), PP 52-57.
[3]Gaurav Jain, R. P. Narwaria,”Designing of rectangular window based FIR filter for cutoff frequency calculation in artificial neural network”, International Journal of Engineering Science &Research Technology (IJESRT), et al., 6(1): January, 2017.
[4] Alia Ahmed Eleti and Amer R. Zerek,
“FIR Digital Filter Design By Using Windows Method With MATLAB”, IEEE 2013.
[5] John G. Proakis & Dimitis G. Manoakis, “Digital Signal Processing Principles, Algorithms, and Applications”, PRENTICE-HALL INTERNATINAL, INC., Third Edition 1996. [6] Alan V. Oppenheim, and Ronald W. Schafer, “Discrete-Time Signal Processing”.
[7] Yogesh Babu Indoriya, Anil Mourya, Karuna Markam,”Design FIR digital filter using neural network”, international journal of advanced and innovative research, vol. 4 issue 3.
[8] Suchi Sharma, Anjana Goen,”Analysis and Performance Evaluation for Low Pass Filter Design Using Artificial Neural Network “International journal of innovative trends in engineerining (IJITE), volume 19, nov. 02, 2016. [9] M. A. Singh and V. B. V. Thakare,”Artificial Neural Network Use for Design Low Pass FIR Filter a Comparison”, International Journal of Electronics and Electrical Engineering Vol. 3, No. 3, June 2015.
[10] Sanjit K. Mitra, “Digital signal processing A computer-Based Approach”, Department of Electrical and Computer Engineering University of California, McGraw-Hill, Second Edition 2002.
[11] Suruchi Sharma,” Design and Analysis of FIR Filter using Artificial Neural Network”, et al International Journal of Computer and Electronics Research ,Volume 4, Issue 2, April 2015.
[12] Aparna Tiwari, Vandana Thakre, Karuna Markam,”FIR Filter Design Using Artificial Neural Network”,International Journal of Computer & Communication Engineering Research (IJCCER),
Volume 2 - Issue 3 May 2014.
[13]Ajeet Maheshwari, Karuna Markam,”Design A Bartlett Window Based Digital Filter by Using GRNN”,International Journal of Innovative Research in Science, Engineering and TechnologyVol. 3, Issue 7, July 2014.
[14] S. Haykins, “Neural Networks –A comprehensive foundation”, Prentice –Hall of India Private Limited, New Delhi, (2003).
[15] Artificial neural network by B.Yegnanarayana. [16] Mathworks.com