© 2016, IRJET | Impact Factor value: 4.45 | ISO 9001:2008 Certified Journal
| Page 865
Featureless Classification Model Training Algorithm Based On
Similarity Measure
Pavan V H
1, Dr. P V Kumar
21
Student, Dept of CSE, Acharya Institutes, Karnataka, India
2Professor and HOD, Dept of CSE, Acharya Institutes, Karnataka, India
---***---Abstract
-
For the learning problems of vectorial data manysolutions and algorithms have been developed. But in physical world data is depicted as feature vectors. Domains like computer vision, bioinformatics the data is not available as vectorial data but as pair-wise data. The project proposes the new method for similarity based learning using distance transformation and distance is taken as the similarity measure. For a data set a clear class boundary is generated to identify the class by manipulating the distance between the data points. The proposed method is developed using two algorithms; Pair-wise Similarity Based Classifier which is used for train data set and Classifying Unknown Data Points used to label the class for unknown data point. The outcome of the proposed method is compared with k-nearest-neighbor classifier. The accuracy rate is increased and error rate is reduced in proposed method.
Key Words: Data Mining, Machine learning, Transformation
Influence
1.INTRODUCTION
Machine learning problems normally contains two types of data -Vectorial data, Pair-wise Proximity data. Vectorial data Vectorial data comprised of set of samples most oftenly illustrated as data points in an n – dimensional Euclidian space, where every element correlate to a feature. Feature vector is a n – dimensional vector of numerical components that speak to some article. wise Proximity data Pair-wise proximity data disclose the pair of similarities between data points, normally these kind of data is represented in 2-dimensional matrix. A few speculations and calculations have been created to tackle vectorial information learning issues via hunting down the speculation that suits the observed training information.
Similarity based or Distance based learning is practiced when the training data sets are not depicted in Euclidian space. When the samples are depicted as feature vectors but the appropriate association between samples is similarity or dissimilarity function that does not comply with scientific standard of a metric. The one more instance is that when samples are depicted as pair-wise similarity and does not contain any feature vector. The most common technique for distance based learning is k-nearest-neighbor algorithm.
Many other approaches to nearest neighbor have been implemented like nearest-centroid classifier, similarity discriminant analysis, SDA. In nearest-centroid classifier it will conforms mould of human learning and categorize a test sample according to homogeneous mould. Generalization to nearest-centroid classifier is similarity discriminant analysis. With the help of maximum entropy estimation similarity discriminant analysis builds a productive replica. There are some other methods which will neglect that the similarity matrix is not certainly positive semidefinite and considers similarities as kernels. A well known method to this issue is by making use of clip, flip, shift or diffusion methods convert similarity matrix into PSD kernel matrix.
2.RELATED WORK
It is bit difficult to analyze machine learning problems. There are two types of data called vectorial data and pair-wise proximity data which are normally present in machine learning problems. Numerous techniques and algorithms have been proposed to resolve both vectorial data and pair-wise proximity data. But in vectorial data problems the methods and techniques are being limited by stipulated features like dimensions and it‟s difficult to decide accurately. In pair-wise proximity data the most common method is k-nearest-neighbor method.
There are numerous techniques have been proposed for pair-wise proximity data. They are k-nearest-neighbor algorithm. Naïve Bayesian, Artificial neural network, C4.5, SVM, LSDA. All the algorithms have many drawbacks like loss of accuracy, more processing time, error rate will be more.
3.PROPOSED
METHOD
The proposed system is extension to the k-nearest-neighbor algorithm. Since there are many drawbacks present in the k-nearest-neighbor algorithm to overcome those demerits the new method is proposed. The proximity measures in proposed system does not depend on the PSD or Euclidian space.
© 2016, IRJET | Impact Factor value: 4.45 | ISO 9001:2008 Certified Journal
| Page 866
training and prediction is done in one step and make use ofunlabeled data in distance transformation and classification. The same method is applied to both vectorial data and pair-wise proximity data and the results are compared.
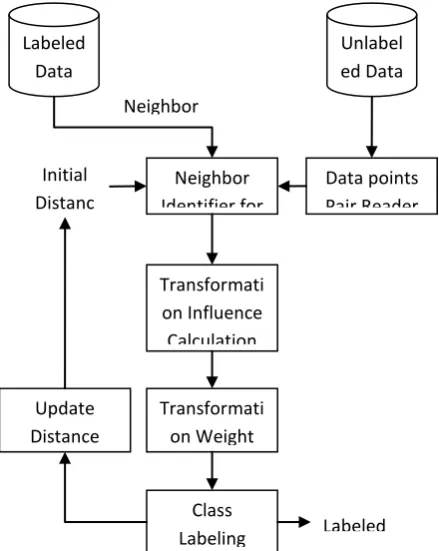
3.1 Architecture
Figure 1 shows the high level design of the proposed method. It shows how the data flows, the input, output and the process involved.
3.1.1 Data Points Pair Reader
The data points are taken in pair-wise format, reads pairs of unlabelled data points for predicting the labels. Let us consider this pair as xi and xj which is shown in Figure 2.
3.1.2 Neighbor Identifier
The Distance Threshold and the unlabeled data points as inputs and finds neighbors for xi and xj present within the
given distance.
Let us consider for xi, the neighbors are n1, n2, n3, n4 and n5. For xj the neighbors are n4, n5, n6 and n7. Notice that n4 and n5 are the common neighbors for xi and xj. dij is the
[image:2.595.319.515.104.220.2]distance between the data points xi and xj and same is used as radius of the circles.
Fig 1: High Level Design for Proposed Method
Fig 2: Pair-wise Distance Transformation Model
3.1.3 Transformation Influence Calculation and Normalization
The Transformation Influence of the common neighbors on each of the unlabeled data points using formula,
Influence Transformation on xi is found using;
(1)
Influence Transformation on xj is found using;
(2)
3.1.4 Transformation Weight Calculation
It computes the weights of the Transformation Influence for unlabelled data points. These weights are used while calculating the average distance for xi and xj with their neighbors of each class.
The weight will be more if the influence rate is high. For dij, pair-wise distance transformation weight wij is given by the sum of the weights of wi and wj i.e. wij = wi + wj. After determining the classes of xi and xj, the pair-wise distance between xi and xj is modified to new distance using transformation function f(wij).
3.1.5 Class Labeling
Class labeling module finds the lowest average distance class in the neighbors of the data point and labels the data point with that label. This way the unlabeled data points are labeled with accurate class label resolving conflict of common neighbors. If both xi and xj are labeled with same class then the Distance Threshold is reduced by fraction of 10% of the current distance. If the class labels are different the Distance Threshold is increased by faction of 10% of the current distance.
Labeled Data
Unlabel ed Data
Transformati on Influence Calculation
& Normalizatio
n Initial
Distanc e Thresh
old
Neighbor Identifier for
xi and xj
Transformati on Weight Calculation Neighbor Data points
Class Labeling Update
Distance Threshold
Labeled Data Points
Data points Pair Reader
[image:2.595.37.257.449.725.2]© 2016, IRJET | Impact Factor value: 4.45 | ISO 9001:2008 Certified Journal
| Page 867
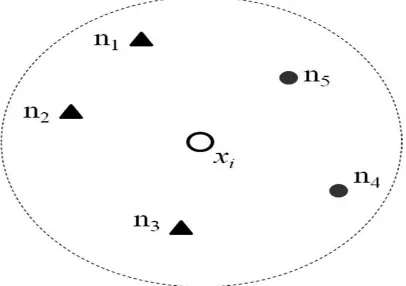
Figure 3 shows xi is unlabeled data, n1 to n6 are labeled [image:3.595.36.239.202.345.2]neighbors and n1, n2, n3 are labeled triangle and n5 and n4 are labeled as circle. Since the triangle neighbor classes are more compared to circle, unlabeled data will be labeled with the class triangle with the probability 3/5.
Fig 3: Assignment of class to data instance
4.ALGORITHMS
4.1 Pair-wise Similarity Based Classifier
INPUT: Training Data, Initial Distance Threshold OUTPUT: Trained Pairwise Similarity Based Classifier 01: Read Data Points from the Training Data
02: FOR each Data Point Pair in the Training Data
03: From the Data Point find other data points in the training data within the Distance Threshold
04: IF Neighor of both data points in pair overlap 05: Calculate Distance Transformation Influence of Common Neighbor for each data point
06: Assign the Common Neighbor to the data point which has highest influence
07: END IF
08: Find Class of Data Point Pair based on K-Nearest Neighbor
09: IF Class label of both the points is Same THEN 10: Increase Distance Threshold
11: ELSE
12: Decrease Distance Threshold 13: END IF
14: END FOR
Fig 4: Algorithm for Pair-wise Similarity Based Classifier
The figure 4 shows the first algorithm which is used is Pair-wise similarity based classifier which helps to train the data set. This algorithm concerned with, from the given data set the data points are read then find the neighbors for each
data point and if the neighbors are overlapping then calculate the distance transformation influence.
It also includes whether to increase or decrease the distance threshold based on the class labels. The input given is Training data, Initial distance threshold and the output is Trained Pair-wise similarity based classifier.
4.2 Classifying Unknown Data Points
INPUT: Training Data, Initial Distance Threshold OUTPUT: Trained Pairwise Similarity Based Classifier 01: Read Data Points from the Training Data
02: FOR each Data Point Pair in the Training Data
03: From the Data Point find other data points in the training data within the Distance Threshold
04: IF Neighor of both data points in pair overlap
05: Calculate Distance Transformation Influence of Common Neighbor for each data point
06: Assign the Common Neighbor to the data point which has highest influence
07: END IF
08: Find Class of Data Point Pair based on K-Nearest Neighbor
09: IF Class label of both the points is Same THEN 10: Increase Distance Threshold
11: ELSE
12: Decrease Distance Threshold 13: END IF
[image:3.595.305.558.227.468.2]14: END FOR
Fig 5: Algorithm for Classifying Unknown Data Points
The figure 5 shows the second algorithm is classifying unknown data points which helps to label the data points. This algorithm deals with the assigning the class label to the unknown data point based on the majority of the classes which are neighbor to the unknown data point. The input is Unknown data, Trained pair-wise similarity based classifier and the output is Assignment of class to unknown data.
4.3 Performance Analysis
The performance of proposed method is compared with k-nearest-neighbor algorithm by taking in consideration of some of the measures like TP rate, FP rate, recall, precision and F-measure.
© 2016, IRJET | Impact Factor value: 4.45 | ISO 9001:2008 Certified Journal
| Page 868
5.EXPERIMENTS
AND
RESULTS
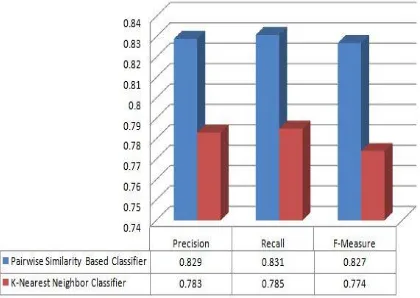
5.1 Comparison graph of KNN and Pair-wise
Classifier
Figure 6 shows the comparison between the k-nearest-neighbor classifier and pair-wise similarity based classifier. The comparison is by taking in consideration of performance measures like precision, recall and f-measure. The study shows that performance of proposed method is increased compared to existing system.
Fig 6: Comparison Graph of both classifiers
[image:4.595.330.502.129.252.2]5.2 Overall Classifier learning time
Figure 7 shows the total time required for classification of both k-nearest-neighbor classifier and pair-wise similarity based classifier.
Fig 7: Overall Classifier learning time
5.3 Accuracy and Error rate
Figure 8 and figure 9 shows the accuracy and error rate of both the classifier. Accuracy is increased and error rate is reduced in pair-wise similarity based classifier while compared with k-nearest-neighbor classifier.
[image:4.595.42.252.250.399.2]Fig 8: Accuracy and Error rate of KNN classifier
Fig 9: Accuracy and Error rate of Pair-wise similarity based classifier
6.CONCLUSION
In physical world, the domains like bioinformatics and social networking representation of data in vectorial form is difficult as the features are not accessible. Contrarily similarity can be acquired in the form of matrix based on expression of gene or the number of users in these applications. In this age Big Data not only the size of data is major problem but also the representation of data. Different representation leads to different learning problems.
[image:4.595.343.487.369.457.2] [image:4.595.42.252.507.654.2]© 2016, IRJET | Impact Factor value: 4.45 | ISO 9001:2008 Certified Journal
| Page 869
the improved accuracy and decrease in error rate comparedto existing methods.
Future work includes reduction of processing time of data training in pair-wise similarity based classifier which may be done through sampling technique.
7.REFERENCES
[1] E. Alpaydin, Introduction to Machine Learning. Cambridge, MA, USA: MIT Press, 2004, pp. 85–86. [2] L. Cazzanti and M. R. Gupta, “Local similarity
discriminant analysis,” in Proc. Int. Conf. Mach. Learning, 2007, pp. 137–144.
[3] R. Goldstone and J. Son, “Similarity,” in Cambridge Handbook of Thinking and Reasoning, K. Holyoak and R. Morrison, Eds. Cambridge, U.K.: Cambridge Univ. Press, 2005, pp. 13–36.
[4] T. Graepel, R. Herbrich, P. Bollmann-Sdorra, and K. Obermayer, “Classification on pairwise proximity data,” Adv. Neural Inf. Process. Syst., vol. 11, pp. 438–444, 1998.
[5] S. Hochreitera and K. Obermayer, “Support vector machines for dyadic data,” Neural Comput., vol. 18, no. 6, pp. 1472–1510, 2006.
[6] R. O. Duda, P. E. Hart, and D. G. Stork, Pattern Classification. 2nd ed. New York, NY, USA: Wiley, 2001, pp. 182–188.
[7] R. L. Goldstone and A. Kersten, “Concepts and categorization,” in Comprehensive Handbook of Psychology, vol. 4. Hoboken, NJ, USA: Wiley, ch. 22, pp. 599–621, 2003.