7406
A STUDY OF NEURAL NETWORK BASED IOT DEVICE
INFORMATION SECURITY SYSTEM
1SEUNGWON LEE, 2CHANGBAE MUN, 3OOK LEE
1Department of Information System, University of Hanyang, Seoul, Korea
2Department of Information System, University of Hanyang, Seoul, Korea
3Department of Information System, University of Hanyang, Seoul, Korea
E-mail: 1[email protected], 2[email protected], 3[email protected]
ABSTRACT
The development of ubiquitous computing environment has increased interest in IoT (Internet of Things) technology. As IoT has flexible and open characteristics applicable in various fields of industry, increased external accessibility has raised the possibility of external threats. As the existing IoT network was small on scale, there was less risk of security attack. However, continuous IoT development brought the large scale network environment by combining various networks, therefore causing higher risk of security attack compared to small scale network environment. By figuring out the response and implementation time while operating IoT devices to detect intrusion through virus or hacking, the artificial neural network learns various responses using a wide variety of mobile devices. This process may help to deal with current virus and hacking. In addition, by detecting virus and malware in real time, this process may also help to prevent future intrusion. As IoT security risk sharply arises, we suggested an intrusion detection system using artificial neural network model in this study. The system method which is developed in this study can be adjusted to fit various fields and situations of IoT by facilitating flexible modification of critical values. Considering limitations of IoT, the research method which detects anomaly through learning the response and implementation time is expected to be widely used for information security system of various fields which utilize IoT in the future from various angles.
Keywords: Anomaly, Intrusion Detection, Artificial Neural Network, Information System, IoT, Security
System
1. INTRODUCTION
Nowadays, the development of ubiquitous computing environment has increased interest in IoT (Internet of Things) technology. IoT is the concept that devices form network by themselves and exchange information. By making the active network between objects and people possible, IoT introduced the environment that each object can freely exchange information with each other [1], and it increased flexibility and openness in various fields. However, on the other hand, increased external accessibility has raised the possibility of external threats. Together with the weakness of the source technology itself, new vulnerability may arise.
Therefore, by examining the response and implementation time while operating IoT devices, the artificial neural network may learn different responses using many other mobile devices to detect intrusion through virus or hacking. It helps to
detect virus and hacking in real time and prevent them in advance. In addition, the artificial neural network detect and learn possible malwares and hacking attempts in real time, and this process may be helpful for continuous IoT security.
2. RELATED WORK
2.1 Internet of Things (IoT)
Internet of Things is a global infrastructure which interconnects intelligent objects and helps communication between objects and people combined with context-awareness based knowledge [2].
7407
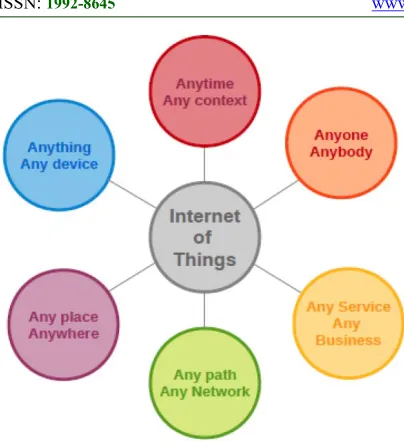
Figure 1: IoT Definition
In the aspect that IoT can connect physical and virtual things and enables communication between objects to exchange information freely, the IoT platform has now more flexible and open characteristics. As the recognition that flexibility and openness of IoT promotes the service quality throughout the industry, focusing on connectivity and data sharing, more studies are now in progress combining IoT with various fields of service such as home appliances and electronics, smart buildings, public utilities, transportation and health care.
2.2 Artificial Neural Network
[image:2.612.92.294.77.299.2]Artificial neural network consists of various processing units, and it has resilience and learnability [3, 4]. The various processing units consisting artificial neural network are constructed by connection weights between each other [5]. Figure 2 shows the structure of an artificial neural network.
Figure 2: Structure of Artificial Neural Network
Compared to existing statistical models or inductive learning method models, artificial neural network models have relatively high predictability [6]. After applying probit analysis, ID3 and artificial neural network on each experiment, artificial neural network turned out to have the highest predictability. Probit analysis and inductive learning method did not show meaningful difference in predictability[7]. Artificial neural network has become one of the most accurate and widely used prediction models among programs which predict social, economic, engineering, foreign exchange and stock issues.[8]. Recently, artificial neural network models have high possibility to solve complicated issues which are hard to deal with computers, Therefore, many related studies are on rapid progress[9].
Among artificial neural network theory, back-propogation neural network is known as the generalized delta rule[10,11]. It is one of the most widely used and studied research method to train the neural network[12]. Back-propogation neural network consists of input and process units which are known as neurons, also known as neurodes and nodes. Neurons of each layer are completely linked to each other by connection stability called weights which save network information[13]. Back-propogation neural network is linked by process units of input, hidden and output layers. The process units have a learning function which learns input data and a transfer function which sends interconnected activation [14].
MLP (Multi-layer Perceptron) has been widely used in application issues based on the mathematical proof that a sufficient number of middle layer nodes can approximate a random function. Especially, MLP is also often used in pattern recognition issues [15]. MLP makes learning and recognition of a training set possible and it can be used as a mathematical tool to solve complicated classification issues of pattern recognition [16]. The learning process of the artificial neural network is as shown as below
1) According to the target, determine the cost
7408 2) After randomly entering the initial weight,
calculate the fitted value .
3) Partially differentiate the cost function on each
weight .
4) By adding or subtracting rth weight (learning rate
ⅹpartial differentiation value), calculate r+1th
weight.
5) Repeat from step 2 to step 4 until the error rate is within the margin of the error [17].
In the artificial neural network theory, backpropogation is adjusting the network to reflect the data connected by processing units of input,
hidden and output layers. Through
backpropogation, aritificial neurons learn the data entered in processing units learning function, and transfer the activation data interconnected to each other transfer function. We used sigmoid (a mathmetical function having a characteristic of "S"-shaped curve) which is generally used in the application of artificial neural network. The
connection weights are decided by
[image:3.612.313.520.77.258.2]backpropogation. Backpropogation is most widely used in application of artificial neural network [18]. Figure 3 shows the sigmoid curve function used in this study.
Figure 3: Sigmoid Function
2.3 Information Security System
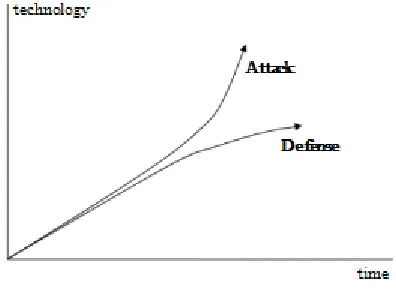
Detecting network system intrusion accurately in real time is always a difficult goal for system administrators and information security researchers [19]. Nowadays, moreover, security attack technology has been more developed than information protection technology. However, as shown in the graph in Figure 4, it is difficult to solve the problem realistically. Due to the rapid development of Internet, the need to quickly establish protection system to deal with Internet security issues and threats is increasing sharply. However, realistically this issue is not easy to solve. [20]. For this reason, it is not surprising that most of the enterprises are investing more money in information security [21].
Figure 4: The difference between attack and defense
[image:3.612.317.515.470.618.2]7409 (HIDS) which monitors the single system and detects anomaly traffic and network intrusion detection system (NIDS) which monitors the whole network activity [22].
However, the main weak point of IDS is that it cannot detect unknown intrusion. Once a new pattern of attack is found, the whole system needs to be manually updated. However, as the speed and complexity of the network is increasing quickly, the frequency and type of network intrusion is also surging drastically. Therefore, it is regarded to be harder to manually update the system to solve the security issues.
Furthermore, an intrusion detection system
identifies system intrusion by monitoring network anomaly[23]. An intrusion detection system is considerably noted for a mechanism that protects the network system by keeping confidentiality, integrity and availability of the network system. However, even though many researchers made considerable efforts, there are still serious weaknesses with an intrusion detection system such as FP(false positive) and FN(false negative)[24]. When an intrusion detection system wrongly interprets normal traffic against attack, it is called FP [22]. When an intrusion detection system regards data actually attacking the system as normal traffic, it is called FN [25]. Due to these critical weaknesses of the intrusion detection system, it is essential to lower FP and FN to increase the accuracy of detection process.
2.4 IoT Security System
IoT can be interpreted as a variety of forms and integrated technologies such as communication/network, device, light weight embedded network, user centered applied service and web service. Therefore, the application range of IoT security technology can be regarded as highly extensive and complicated [26].
As the existing IoT network was small in scale, there was less risk of security attack. However, continuous IoT development brought a large scale network environment integrating various network and it also raised security risk compared to a small scale network [27]. The security issue is becoming more important. Recently, Wifi, Bluetooth and ZigBee are most widely used as IoT network technology. However, each technology has its own weakness: It is difficult to apply high-level encryption technology on ZigBee. Wifi has weakness in security against the attack of information leakage, fabrication and modification. Recently, development of application level protocols such as CoAP and MQTT effectively deals with various linking functions between
publish/subscribe sensing devices and services. In the future, it is expected to be widely used as IoT protocol [28].
3. SYSTEM IMPLEMANTATION
Currently, security technology is being widely used in IT industy and will be used more extensively in various fields. However, as ultra-light and low cost are essential in commercial IoT environment, we can say that extensive prevention system does not match with IoT enviroment, which makes it difficult to measure and control various data.
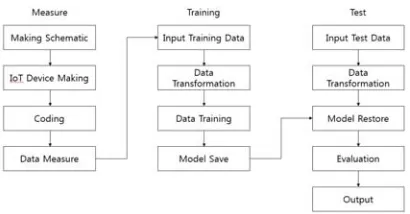
[image:4.612.314.519.378.485.2]Therefore, we used the factor 'time', which is impossible to fabricate, to examine anomaly and tried to find practical ways for detection and prevention against virus and malware. We have performed learning process of the response and implementation time data using Neural Network Tool of MATLAB. Based on learning and test results, we would like to suggest IoT information security system based on artificial neural network. Figure 5 shows the flow chart for this study.
Figure 5: Research Flow Chart
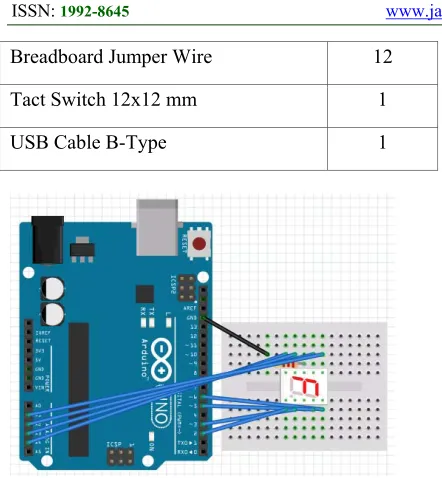
[image:4.612.308.529.598.726.2]We used Arduino Uno as IoT device for system implementation and additionally installed Wifi Shield to connect to the web. As shown on Figure 5, using Arduino Connection Schematic, we installed 7-segment on breadboard and connected with Arduino Uno for device operation.
Table 1: Number of IoT Devices and Equipment Used
Product Name Quantity??
Arduino Uno R3 Board 1
Arduino Wifi Shield R3 1
Breadboard Standard Half+ 1
Register 470Ohm 2
7410
Breadboard Jumper Wire 12
Tact Switch 12x12 mm 1
[image:5.612.85.306.73.312.2]USB Cable B-Type 1
Figure 6: Arduino Connection Schematic
We used wifi shield to connect Arduino Uno to the Internet wirelessly. Through Arduino circuit diagram shown on Figure 6, we set 7-segment on breadboard by using IoT devices and equipment on Table 1 and connected it to Arduino Uno as shown on Figure 7.
Figure 7: Arduino Device
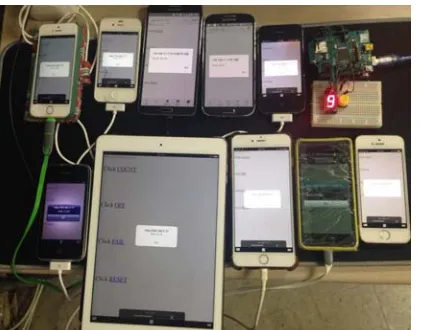
After obtaining device information from wireless router connected to Arduino Uno, we gradually increased the number of access and control to IoT devices from 1 device to 10 devices. Using simultaneous control of 10 devices and 7-segment, we tried number counting from 0 to 9.
In order to control Arduino Uno which was used for this study, we used ARDUINO program offered through the official Arduino
website. This program enables connection with Arduino Uno and programming design. ARDUINO 1.8.1 version was used for this study.
[image:5.612.89.302.411.584.2]As shown on the circuit diagram on Figure 1, we set 2, 3, 5, 6, A1, A2, A3, A4 as output pin of 7-segment and set wifi server as 81. In addition, we set serial as 9600, set ssid and password of wireless router and operated web server by connecting to wifi. By generating JavaScript by client.print, we set the number on 7-segment to count using a herf. Furthermore, through the generator of JavaScript, we measured the time to Milliseconds using Date Object. Through this process, by accessing to Arduino web server, we created a method for number counting of 7-segment and extraction of response and implementation time. Figure 8 shows the core method to measure response and implementation time, and Figure 9 shows the connection to Arduino web server.
7411
Figure 9: Arduino Web Execution Screen
As Arduino Uno uses concurrency control, it processes data according to the time of input and control. As the number of devices controlling Arduino Uno increases, the response time also increases in turn. We measured 10 types of data from using 1 device to 10 devices, measured 200 times each type and extracted 2,000 response time in total. Furthermore, we used the same method to measure, learn and detect to figure out implementation time and deducted 2,000 data in total same as response time. In total, we extracted 4,000 data; 2,000 response time data and 2,000 implementation time data. Figure 10 shows the
measurement process of response and
[image:6.612.93.306.297.462.2]implementation time.
Figure 10: Data Extraction Using Arduino Uno Count
4. EXPERIMENTAL CLASSIFICATION RESULTS AND ANLYSIS
In this study, we built the artificial neural
network using Neural Network Toolbox of MATLAB R2017a. The structure of artificial neural network model in this study used ten evaluation factors; input layers of ten nodes from one device to ten devices. For extracting learning data of the artificial neural network, we used ten nodes as evaluation factors and generated data 200 times according to response and implementation time, 2,000 data per each time and 4,000 data in total. Among the learning data, we sorted 200 data in one pair and generated 10 pairs of data according to response time and 10 pairs of data according to implementation time.
Table 2 and Table 3 show extracted data for response and implementation time.
Table 2: Part of Response Time Data Table
1 2 3 4 5 6 7 8 9 10
0. 93 6 6. 31 2 12. 64 19. 146 26. 224 31. 73 37. 987 44. 325 46. 256 57. 293 1. 27 6 7. 10 9 12. 826 19. 17 25. 422 31. 739 37. 954 44. 818 50. 557 57. 115 1. 45 5 6. 27 8 12. 831 18. 85 25. 402 31. 642 38. 072 44. 34 47. 076 52. 637 0. 87 5 6. 29 2 12.
623 19.06 429 25. 729 31. 994 37. 463 44. 216 46. 042 57.
1. 41 6 6. 29 1 12.
722 996 18. 423 25. 643 31. 646 39. 329 44. 164 51. 036 57.
1. 41 4 6. 52 9 12.
829 19.63 541 25. 608 31. 624 37. 456 44. 102 46. 625 56.
1. 52 7 6. 17 8 12.
722 159 19. 227 25. 928 31. 084 38. 489 44. 193 46. 253 57.
0. 94 6. 41 8 12.
718 751 18. 794 25. 642 31. 37.99 535 44. 235 46. 433 56.
1. 35 8 6. 41 2 12.
724 107 19. 437 25. 738 31. 989 37. 639 43. 50.59 433 57.
1.
39 42 6. 724 12. 021 19. 906 25. 873 37. 997 37. 528 44. 146 46. 57.44
Table 3: Part of Implementation Time Data Table
1 2 3 4 5 6 7 8 9 10
0.00 284 0.00 58 0.00 88 0.01 16 0.01 468 0.01 732 0.02 036 0.02 344 0.02 628 0.02 9 0.00
7412
288 592 884 164 432 736 032 332 604 916 0.00
284 0.00 588
0.00 86
0.01 164
0.01 452
0.01 744
0.02 028
0.02 332
0.02 592
0.02 86 0.00
296 0.00588 0.00872 0.01164 0.01436 0.01744 0.02056 0.02332 0.02596 0.0294 0.00
3 0.00584 0.00868 0.01164 0.0144 0.01764 0.02044 0.02292 0.0262 0.02904
[image:7.612.85.305.70.185.2]We used logsig function as activation function between input and hidden layers and lastly used 10 nodes which represent the number of nodes for optimized learning. Figure 11 shows the node and layer structure used for learning.
Figure 11: Node and Layer Structure for Actual Data Analysis
We sorted the output layers into 10 nodes from 0 (the best) to 9 (the poorest) and applied backpropagation algorithm as a learning method.
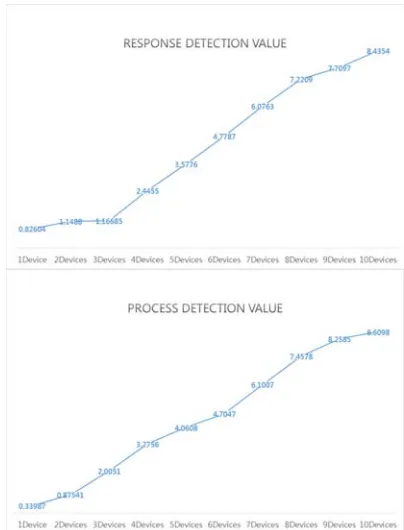
Figure 12: Learning Process Graphs According to Response and Implementation Time
Figure 12 represents the learning process to find the optimized artificial neural network through the program using Neural Network Tool of MATLAB and it shows gradual convergence of output errors. In addition, the experiment results of learning and test data according to response time are as follows; 1Device 0.8264, 2Devices 1.1488, 3Devices 1.16685, 4Devices 2.4455, 5Devices 3.5776, 6Devices 4.7787, 7Devices 6.0763, 8Devices 7.2209, 9Devices 7.7097, 10Devices 8.435. The experiment results of learning and test data according to implementation time are as follows; 1Device 0.33987, 2Devices 0.87541, 3Devices 2.0051, 4Dvices 3.2756, 5Devices 4.0608, 6Devices 4.7047, 7Devices 6.1007, 8Devices 7.4578, 9Devices 8.2585, 10Devices
8.6098.Figure 12 shows learning results based on
output layers set from 0 (the best) to 9 (the poorest), not on response and implementation time. By
setting critical values of response and
[image:7.612.94.297.245.293.2]implementation time recall rate, the anomaly of IoT can be detected.
Figure 13: Detection Rate of Learning Method
[image:7.612.310.512.356.621.2] [image:7.612.92.292.363.688.2]7413 utilize learning results. This study implemented the measurement standard of critical values from 0 (the best) to 9 (the poorest). Based on the critical values, it is expected that setting critical values based on various devices, situations and fields will help to flexibly detect various anomaly when IoT is in use.
5. CONCLUSION
In this paper, we suggested the way to detect anomaly of IoT system by applying artificial neural network theory. Nowadays, IT industry uses IoT concept in the products. Therefore, IoT is widely used in variety of service sectors. However, malicious users may access IoT system using deceptive ways to steal private and service information, which may cause problems on IoT system. As IoT system communicates with various devices, there may be more possibilities of malfunction and non function compared to a single device. System development and software evolution have diversified system intruders, and the combination of existing security technology and models with IoT system security is still insufficient. In this study, we performed research based on accumulated data using basic artificial neural network algorithm. If we use definite inputs, we could only have fixed learning results. Therefore, if we use unexpected inputs in the study hereafter, we need to study unexpected situation as we may have different conclusions compared to existing learning results and. Furthermore, the security of IoT components in physical environment also needs to be considered. Secure authentication of physical access is required to prevent potential physical damages. In addition, it is necessary to continuously identify various potential threats and find appropriate solutions in terms of cyber security.
REFRENCES:
[1] Bong-Im Jang, Chang-su Kim, “A Study on the Security Technology for the Internet of Things”, Journal of Security Engineering, Vol. 11, No. 5, October 2014, pp. 429-438.
[2] Chul-Sik Pyo, Ho-Yong Kang, Nae-Su Kim, Hyo-Chan Bang, “IoT (M2M) technology trends and development prospects”, The Journal of The Korean Institute of Communication Sciences, Vol. 30, No. 8, July 2013, pp. 3-10. [3] M Zeidenberg, “Neural Models in Artificial
Intelligence”, llis Horwood, 1990.
[4] Richard P. Lippmann, “An introduction to computing with neural nets”, IEEE ASSP Magazine, Vol. 4, Issue 2, April 1987, pp. 4-22. [5] Russell, I.F., “Neural Networks”, The UMAP
Journal Vol. 14, No. 75, 1993, pp. 75-88. [6] Kun Chang Lee, "A Comparative Study on the
Bankruptcy Prediction Power of Statistical Model and AI Models: MDA, Inductive Learning, Neural Network", Journal of the Korean Operations Research and Management Science Society, Vol. 18, Issue 2, 1993, pp 57-81.
[7] Liang. T.P, J.S. Chandler, H. Ingoo, J.Roan, "An Empirical Investigation of Some Data Effects on the Classification Accuacy of Probit, ID3
and Neural Networks," Contemporary
Accounting Research, Vol. 9, No. 1, Fall 1992, pp. 306-328.
[8] Mehdi Khashei, Mehdi Bijari, 2010, "An artificial neural network (p, d, q) model for timeseries forecasting," Expert Systems with Applications, Vol. 37, Issue 1, January 2010, pp. 479-489.
[9] K. Y. Lee, Y. T. Cha, J. H. Park, 1992,
"SHORT-TERM LOAD FORECASTING
USING AN ARTIFICIAL NEURAL
NETWORK," Transactions on Power System, Vol. 7, No. 1, February 1992, pp 124-132. [10] D. E. Rumelhart, G.E. Hinton, J. L. McClelland,
“Parallel Distributed Processing”, The PDP Perspective, Vol. 2, 1987, pp. 45-76.
11] J. L. McClelland G.E. Hinton, D. E. Rumelhart, “Parallel Distributed Processing”, The PDP Perspective, Vol. 1, 1987, pp. 3-44.
[12] Philip D. Heermann, Nahid Khazenie, “Classification of Multispectral Remote Sensing Data Using a Back-Propagation Neural Network”, IEEE TRANSACTIONS ON GEOSCIENCE AND REMOTE SENSING, Vol. 30, No. 1, January 1992, pp. 81-88. [13] Iebeling Kaastra, Milton Boyd, 1996,
“Designing a neural network for forecasting
financial and economic time series”,
Neurocomputing, Vol. 10, No. 3, April 1996, pp. 215-236.
[14] Dae-Gyun Choi, 2016, “Anomaly detection
algorithm of IoT system using an artificial
neural netwrok theory,” Hanyang University
Thesis for the Master Science, August 2016, pp. 1-34.
7414 rotations of a sigmoid function with and without scaling”, Neural Networks, Vol. 5, No. 1, 1992, pp. 105-115.
[16] G.E. Hinton, J.L. Mcclelland, DE Rumelhart, “Parallel Distributed Processing, Explorations
in the Microstructure of Cognition:
Foundations”, MIT Press, vol. 5, 1992, pp.45-76.
[17] Trevor Hastie, Robert Tibshirani, Jerome Friedman, The Elements of Statistical Learning, Springer publisher, 2017
[18] Kun Chang Lee, “Synergism of Knowledge-Based Decision Support Systems and Neural Networks to Design an Intelligent Strategic Planning System,” The Journal of MIS Research, Vol. 2, No. 1, June, 1992, pp 35-56. [19] Mukherjee, B., Heberlein, L.T., Levitt, K.N.,
“Network Intrusion Detection”, IEEE Network, Vol. 8, Issue 3, May-June 1994, pp. 26-41 [20] Lim Chae-Ho, “Effective information
protection awareness improvement plan”, Journal of the Korea Institute of Information Security and Cryptology, Vol. 16, April 2006, pp. 30-36.
[21] Lawrence A. Gordon, Martin P. Loeb, “The Economics of Information Security Investment”, ACM Transactions on Information and System Security, Vol. 5, Issue 4, November 2002, pp. 438-457.
[22] Jimmy Shum, Heidar A. Malki, “Network Intrusion Detection System Using Neural Networks”, Fourth International Conference on Natural Computation, October18-20 2008. PP. 242-246.
[23] Huiqiang Wang, Xiaowu Liu, Jibao Lai, Ying
Liang, 2007, “Network Security Situation
Awareness Based on Heterogeneous Multi-Sensor Data Fusion and Neural Network”, Second International Multisymposium on Computer and Computational Sciences, August 13-15 2007, pp 352-359.
[24] John Goodall, Wayne Lutters, Anita Komlodi, “The work of intrusion detection: rethinking the role of security analysts,” Proceeding of the Tenth Americas Conf. on Information System, December 2004, pp 1421-1427.
[25] Seongrae Jo, Haengnam Sung, Byung-Hyuk Ahn, 2016, "A Comparative Study on the Performance of SVM and an Artificial Neural Network in Intrusion Detection," Journal of the Korea Academia-Industrial, Vol. 17, No. 2, February 29 2016, pp 703-711.
[26] Wha-Jung Seo, Dong-Gun Lee, Jong-Suk Lee, and Ho-Won Kim, IoT Security Technology Trends, The Proceedings of the Korea Electromagnetic Engineering Society, Vol. 24, No. 3, July 2013, pp. 27-35.