1823
AN ANALYTICAL APPROACH FOR BANKRUPTCY
PREDICTION USING BIG DATA AND MACHINE LEARNING
TECHNIQUE
1S.SAROJINI DEVI , 2Dr Y.RADHIKA
1Research Scholar,Dept. of CSE,GIT,GITAM University,Visakhapatnam,Andhra Pradesh,India
2Professor ,Dept. of CSE,GIT,GITAM University,Visakhapatnam,Andhra Pradesh,India
E-mail: 1 [email protected], 2[email protected]
ABSTRACT
Bankruptcy is defined as a legal procedure used to claim the identity of an organization or a person on the basis of their creditworthiness and debtor. There is a huge requirement for effective prediction models to evaluate the risks arising in bankruptcy at early stages and to overcome financial losses. Another critical risk considered in bankruptcy is periodic increase in financial data and updates, which increase the size of the system. The existing tools and techniques are limited to less number of inputs and big data cannot be processed directly with these techniques. Big data analytic technique, such as Hadoop, provides an opportunity to process large financial data, which is retrieved from data source such as DataStream, FAME, Company, and House. In this research, bankruptcy prediction model has been developed by using a combined approach of Big Data and Naive Bayes machine learning algorithm. A huge amount of financial data is extracted and stored in Hadoop database through key pair conversion technique and big data analysis and prediction is carried out using naive Bayes classifier on apache mahout platform. The results obtained from validation, on the basis of prediction, show better classification rate with higher accuracy being obtained compared with other existing techniques.
Keywords: Big Data Analytics; Bankruptcy; Naive Bayes Algorithm; Financial Models; Datastream;
FAME (Forecasting Analysis And Modelling Environment); Industrial Risk; Management Risk; Financial Flexibility; Credibility; Competitiveness; Operational Risk.
1. INTRODUCTION
In recent years, there is a significant increase in the magnitude and number of bankruptcy cases due to economic crisis and financial distress. Bankruptcy is generally defined as a condition where a firm is not equipped to solve the rising monetary obligations leading to legal threat. Even efficient auditors expertized on various firm cases fail to provide a clear judgement on banking firms [1]. A recent survey from the World Bank shows that the Indian government tries to solve cases of insolvency in an average span of 4.3 years. There is a huge requirement and need for effective design strategies in order to combat bankruptcy issues in early stages and develop a warning system which helps assuaging default in the corporate world.
Decision-makers have proposed various mathematical techniques, hypothetical models and soft computing techniques to predict and estimate the rate of bankruptcy over time on financial ratios
[2]. Predictions, done based on single- and multivariable models and hypothetical models, are implemented to support theoretical principles but they are statistically complex in nature and development is done based on assumptions. These limitations can be reduced by including soft computing techniques such as Bayesian networks, decision tree, logistic regression and SVM in the design process. Further, failures occurring in business sectors and credit and contract can be detected using bankruptcy prediction models.
1824 and reduce data size. Normalization and transformation are done to replace missing values. The output data obtained is subjected to machine learning algorithm for classification, pattern recognition and construction of models [3]. Various classifications of algorithms has been developed in recent years to solve financial issues that include logistic regression, Naive Bayes classifier, Random Forest, etc. Further, huge dataset from long period time should be considered to increase accuracy and reliability of the system. The data gathered is generally in the form of financial statements, from which the input variables can be extracted. Currently, very few literatures can be obtained in terms of handling large data in bankruptcy [4] - [6]. It has been observed from the study that there are no effective and efficient techniques developed for handling large financial statements datasets. These drawbacks can be overcome by proposing a framework comprising big data analytics and machine learning.
Naïve-base classifier has proved to be an effective algorithm in business failure prediction, and it is derived based on the assumption of Bayesian theorem [7]. In machine learning, it is defined as the family of probabilistic classifiers and strong independent results can be obtained between the feature sets. It is proved to be an alternate for conditional probability distribution by estimating the values of class attribute based on values obtained from other attributes. The advantages such as high scalability, less number of linear parameters and elimination of iterative approximation can be observed by developing a mathematical model using naive Bayes classifiers.
2. LITERATUREREVIEW
There is a wide range of literature obtained in the field of big data bankruptcy and various algorithms have been deployed in order to reduce bankruptcy. The different methods and techniques used by different authors have been briefly explained as follows:
The research work comprising the effects of bankruptcy in terms of economic and financial distress has been explained by author [8]. The author has proposed a two-step classification method of genetic algorithm which helps in selection of relevant factors and adopting the proposed genetic model to a particular application. From the experimental study, it has been observed that the proposed model has been validated by considering a balanced set of data comprising 912 observations and 55 features from Russian
companies. It has been observed that the proposed method by author yields 0.934 accuracy and 0.910 precision, which are accurate and efficient compared with other existing methods. The main limitation of this model was that it was a simple design limited to very few applications. Further, a new approach for bankruptcy prediction using logit and genetic algorithm has been proposed by author [9]. In this study, the author evaluated and compared logit and genetic algorithm on the basis of Root Means Square Error (RMSE), Mean Absolute Error (MAE) and Mean Absolute Percentage Error (MAPE) errors. From the experimental study, values of 0.82, 1.07, 2.17 were obtained for RMSE, MAE, MAPE in genetic algorithm compared with 1.23, 1.87, 3.85 for logic model, respectively. These findings show that the genetic algorithm is highly efficient and effective compared with the logit model and further results obtained through Johansen test suggest that regression variables are co-integrated and non-spurious. But this model was tested only for the database of Russia, testing this model with the database of other countries could have evaluated the performance of the model in various conditions.
A new neural-based optimization technique for cluster-based sampling, using artificial neural network, has been proposed by the authors in [11]. The main theme of this approach is to reduce the data unbalancing problem arising in big data analytics. This study further explains about the need for a proposed algorithm to optimize bankruptcy prediction. The study observed that geometric mean is used to calculate the performance classification of a model to balance the proportion between the minority and majority classes. The study on results shows that Genetic Algorithm Artificial Neural Network Cluster Based
1825 efficiency is lesser when compared to single classifiers and they do not perform to the requirement in the problem of binary classification. Further a fuzzy neural network-based bankruptcy prediction has been proposed by author [12]. The author has proposed various steps from collection of data, partition, fuzzy membership generation and use MATLAB toolbox to validate the proposed model. From this study, it has been observed that the results obtained (prediction rate of 89%) outperform other existing techniques and successfully be able to forecast bankruptcy of organizations effectively compared with other regression models. This neural network model could further be improved and applied to various kinds of financial models to predict the bankruptcy.
Furthermore, a new technique called the support vector machine algorithm has been introduced in [13], to solve issues arising in the bankruptcy prediction model. The advantages of capturing geometric characteristics through feature space extraction without considering the weights help to reduce the training set size and obtaining optimal solution with less time consumption. The author has conducted experiments regarding different kernel parameters and the results obtained show that efficient predictive performance is obtained by using Support Vector Machines (SVM) with minimum training and testing dataset. Later, a new algorithm comprising data depth and support vector machine has been proposed by author in [15] to analyse risks arising due to financial distress and reduce risks rising in bankruptcy. Data depth functions have been considered to define statistical depth function bounded with non-negative mapping and feature set such as Mahalanobis depth, Simplicial depth and Tukey depth, which has been considered to plot Depth vs. depth plot. From the experimental study, it has been observed that the results demonstrate an overall accuracy of 0.6724 and type 1 error rate of 0.1897, which is highly accurate compared with other existing techniques in bankruptcy. The authors in [15] has proposed a new approach by considering weighted ensemble and decision function to analyse the annual data in longitudinal bank function ratios. The weighted ensemble has been designed through the combination of Gaussian functions and linear kernel. The empirical results of the study demonstrated that by using weighted panel structure for a period of three years, better performance is obtained in terms of sensitivity and helps in reducing bankruptcy. The authors feel that using a combination of classifiers along with the base SVM classifier would improve the
performance but that may not always be possible since multiple classifiers also have certain drawbacks.
Further, the author proposed machine learning technique using Naïve Bayes classification algorithm for bankruptcy prediction [16]. By employing machine learning techniques, the predictive model is developed through hidden patterns and supervised, unsupervised learning. From the study, the average accuracy rate of 98.3%, true positive rate of 0.983 and precision rate of 0.98 were observed efficient, compared with other existing techniques. Further, the application of naive Bayesian classifier has been extended to analyse the risk assessment in bank loan and evaluate credit risks in financial and business institutions [17]. The author has introduced cash flow variables in order to improve the prediction quality and introduced collateral for default risk prediction. From the experimental study, it has been analysed that Area Under the Curve (AUC) is in the rate of 83% is observed and further stated that by introducing both qualitative and quantitative variables increases the rate of accessing solidity of the borrower.
To enhance the prediction of bankruptcy model overall reliability and performance, encompassing the highly required prior ability for prediction, huge quantity of data is required as illustrated in [18] and [19] therefore big data analytics can be used for this kind of research.
Big data is gaining high levels of recognition as well as attention because of its broad prospects of application and research. It refers to fast, large-scale change in different types. Sets of data are combined data from various sources in semi-structured, structured and unstructured collection of data. Apart from these, models developed for predicting the bankruptcy are adopted as a baseline model. Therefore this research develops an effective model for predicting the bankruptcy based on the analytics of big data
3. RESEARCHMETHODOLOGY
In this research, the input data comprises with 'n' number of dataset collected from online
website database
1826 in business field such as Industrial Risk, Management Risk, Financial Flexibility, Credibility, Competitiveness and operational risk
[image:4.612.324.565.127.451.2]and comparison among these fields is done on the basis of three classes namely, Positive (P), Average (A), and Negative (N).
Fig. 1. Input Dataset
The input dataset considered for the analysis purpose is shown in Fig. 1. In the input data, if negative class observed in evaluation stage of the risk is four or above four, then we manually predict the data as bankruptcy. Simultaneously, if the risk observed is less than four, then the data is predicted as non-bankruptcy.
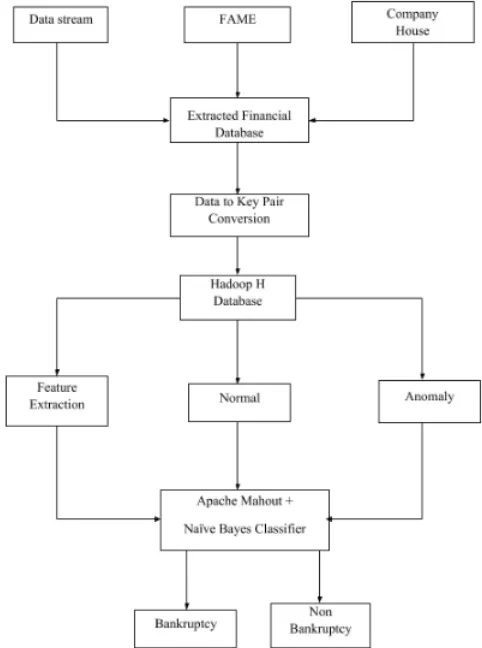
3.2 Key value Pair
The key value pair technique can be generally defined as map reduce technique, where n number of input data can be reduced in order to provide compatibility in big data Hadoop platform. The block diagram of the proposed system along with work flow is shown in Fig. 2. The input financial data is obtained from the online website https://data.gov.uk/ dataset/ insolvency statistics which comprises financial dataset gathered from various sources, such as data stream, FAME, company, house. The captured database is tabulated in excel datasheet. In this research, the input database is considered as big data analytics and more concentration is given to huge volume of data and radical analytic methods to operate on big datasets. Further, the input data captured is converted into key value pair format in order to provide compatibility with the Big Data Analytics
Servers, namely Hadoop Hbase, and the converted key value pair data is stored in Hadoop database.
Fig. 2. Block Diagram Of Proposed System
The stored data is further processed to feature extraction stage, where the key features are been extracted from the dataset for training purpose. For testing purpose, the H-base data is manually classified on the basis of normal and anomaly, and processed to machine learning based on naive bayes classifier along with feature extraction set. The Naive bayes classifier is designed on Apache Mahout Platform in order to analyse and successfully classify huge amount of data. The classification result retrieved from naive bayes classifier predicts whether the firm is bankrupt or not. The detailed explanation regarding individual process will be explained in the following stages.
1827 In the proposed framework, the input data comprises with financial dataset in which individual dataset is further classified on the basis of risks involved in business and construction field such as industrial, management, financial, credibility, competitiveness and operational risk. The dataset comprising various sources such as data stream, FAME, company house has been retrieved from online website https: //data.gov.uk/ dataset/ insolvency statistics and tabulated in an excel sheet. Further, the extracted big data is processed through key value pair conversion process in order to reduce the size of data and process in Hadoop and H-base platform.
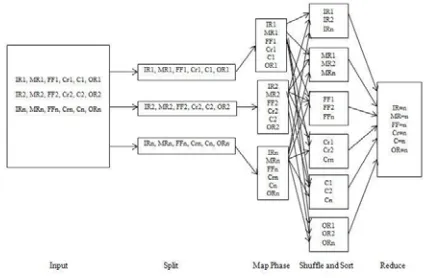
[image:5.612.321.534.167.306.2]Fig. 3. shows the flow structure of mapreduce key pair technique. Fig. 4. represents the map reduce flow of the proposed system. The value n represents the number of data set considered for feature extraction, and in this research, we have considered n=255. Map reduce is defined as a programming model used for transformation and aggregation of big data. Filtering and sorting are done through map method, and operation summary is obtained through reduce method.
Fig. 3. Mapreduce Key Pair Framework
The big data is processed through mapping stage, where individual data is divided on the basis of appropriate size, and each framework is assigned with one split function for individual mapping. Further, individual data pair is assigned with key value function on the basis of risk characteristic and its feature such as positive, average and negative. A series of key value pair is developed using map function, processed and generates zero or more key value outputs. The output of the individual map function is allocated with particular reducer for sharding purpose. The partition function comprises with key, number of reducers and returns with the indexed value. The input data is shuffled, sorted and grouped among mapping and reducer stage in order to reduce the input data. The computational time considered during these processes depends on the bandwidth of network, processing speed and size of input data. The single output from the
reducer stage is stored in Hadoop-H platform. Parallel processing technique, for map reduce, is considered during implementation in order to reduce the number of inputs, and the programming is developed using Java platform.
Fig. 4. Map Reduce Considering Feature Set
3.3 Hadoop H Database
Hadoop is an open source data platform used for processing and handling big data applications in real-time environment. The hadoop database is simple, user-friendly and designed using Java platform. Apache hadoop is defined as software framework that comprises various tools for big data analysis and storage purpose. The concept of distributed processing is considered for data computation and storage among nodes in a cluster. The applications of hadoop storage are used by many organizations such as data and mobile communication, Google earth users and commercial industries. Further, the output data from hadoop database is processed through feature extraction stage for training purpose, and normal and anomaly data for testing purpose in apache mahout platform using naive bayes classifier.
3.4 Feature Extraction
[image:5.612.93.296.398.486.2]1828 of anomalous data as well as normal data during the training set and optimized fit parameter € is achieved through the maximum likelihood value obtained through the analysis. During prediction, these data is processed along with the mean value and standard deviation to obtain the value for Gaussian distribution P(x). The equation for the value P(x) is given by,
(1)
k=number of feature samples
μ = mean gaussian distribution value
σ = standard deviation
The assumptions considered for anomaly data are as follows,
If P(x) < optimized fit value €, then the value is said to be anomaly.
If P(x)>= optimized fit value €, then the value is defined in terms of normal value.
3.5 Apache mahout and Naive bayes classifier
In this proposed research, naive-bayes machine learning algorithm is considered for classification of financial data on the basis of bankruptcy and non-bankruptcy. Apache mahout platform is used to group the set of big data documents into cluster of similar subject area. The Mahout platform comprises a number of classification algorithms, which can be used to allocate category labels to text documents. Naive bayes classifier is defined as a supervised learning probabilistic method works on the principle of Bayes theorem and probabilistic classification. This algorithm employs probabilistic classification techniques to develop a model for class assignments. The output data obtained from hadoop H database is used for feature extraction and for normal and anomaly data. These data obtained are further processed for training and testing through a number of iterative processes, which help in improving the accuracy of the system.
The assumption considered during the implementation of Naive Bayes classifier are as follows:
1. The first assumption is that, there is no dependency between the pair of features, i.e., average credibility does not influence financial
flexibility or management being positive. Hence, these features are assumed to be independent.
2. Secondly, equal importance is given amongst individual feature set.
Apache Bayes theorem states that there is a relationship between the probability of an event occurring and the probability of event already occurred. Mathematically, it is given by
(2) Where, a, b are events and P(b) not equal to zero
P(a) is the prior probability of a, that is probability observed before the evidence.
P(b) = Prior of b
By considering the assumption of class conditional independence, further the equation is defined as,
(3)
In brief terms, the equation (2) can be written as-
Posterior probability = likelihood *class prior probability/ predictor prior Probability
The steps involved in naive bayes classifier are as follows:
Step 1: Every instance of the learning set is defined by an n-dimensional attribute vectors
Ex: M = (m1, m2, m3,...mn) (4)
Step 2: If there is a presence of z classes in the dataset, then it is given by,
C= (c1, c2, c3,...cZ) (5) Step 3: The maximal P (Ci/M) is calculated from
1829
(6) Step 4: Since the probability P(C) is constant for all
the classes, the maximum value is searched only for,
(7)
Step 5: The value of equation (6) can be calculated by assuming all the attributes as unique and independent.
The algorithm is developed and deployed in apache mahout database for classification purpose. The input dataset comprising feature set and normal and anomaly data are made to undergo training and testing. The classified output data determines whether the input financial data is bankrupt or non-bankrupt.
The pseudo code for the proposed system is shown in these stages
Input : Six feature set
Output: Bankruptcy or Non-bankruptcy
Begin:
Initialize six feature set
Y=1: Represents first feature set
Forward data to Naive bayes classifier
Compare <- Trained feature data with test
feature dataset
do <- Anomaly
do <- Normal
For each Anomaly and Normal
Prior (A & N) = P (Ci / M)
Classified <- Bankruptcy or Non-bankruptcy
(Classified depends on Anomaly and Normal data and predict result in terms of bankruptcy or non-bankruptcy)
do class <- check for similar classified data
If
similar classified data observed <- 8;
class<- Previous stage class output;
(If continuous similar data observed at the output of classified is lesser than 8 or output data is frequently changing, then class output retains its previous stage output in terms of bankruptcy or non-bankruptcy)
Else
Class<- Opposite to the output of previous stage;
(If continues similar data observed at the output of classified is greater than 8 or output data is constant for a period of 8 samples or more, then class output changes with respect to previous stage classified. Ex: If bankruptcy output is their class, if more than eight continuous samples are observed in classified, then the output changes to Non-bankruptcy)
End
End
The pseudo code for the proposed system starts with initializing the feature extraction for the input. After obtaining the features such as management risk, financial flexibility, industrial risk, credibility, competitiveness and operational risk, it is forwarded to naïve bayes classifier along with anomaly and normal data for classification purpose by using equation of maximal probability P (Ci / M). The naïve bayes algorithm is trained with input data set and the classified output obtained will be in terms of bankruptcy and non-bankruptcy. Further class is used to calculate the predicted output data. If the output of classified keeps on changing or similar continuous output is lesser than 8, then the output predicted follows the previous class output. If classified output is constant for a period of eight or more than eight iterations, then class output will be changed and will be opposite to that of the previous stage output.
4. RESULTS AND DISCUSSION
1830
Fig. 5. Prediction of classified results
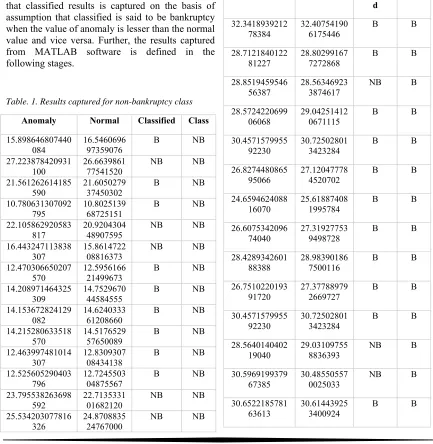
[image:8.612.84.517.298.742.2]Fig. 5 depicts the prediction of classified results from the number of samples. For graphical analysis, seven samples of anomaly and normal data is considered. It is observed from the graph that classified results is captured on the basis of assumption that classified is said to be bankruptcy when the value of anomaly is lesser than the normal value and vice versa. Further, the results captured from MATLAB software is defined in the following stages.
Table. 1. Results captured for non-bankruptcy class
Anomaly Normal Classified Class
15.898646807440 084
16.5460696 97359076
B NB
27.223878420931 100
26.6639861 77541520
NB NB
21.561262614185 590
21.6050279 37450302
B NB
10.780631307092
795 10.802513968725151 B NB 22.105862920583
817 20.920430448907595 NB NB 16.443247113838
307 15.861472208816373 NB NB 12.470306650207
570 12.595616621499673 B NB 14.208971464325
309
14.7529670 44584555
B NB
14.153672824129 082
14.6240333 61208660
B NB
14.215280633518 570
14.5176529 57650089
B NB
12.463997481014
307 12.830930708434138 B NB 12.525605290403
796 12.724550304875567 B NB 23.795538263698
592 22.713533101682120 NB NB 25.534203077816
326 24.870883524767000 NB NB
25.478904437620 102
24.7419498 41391104
NB NB
25.540512247009
590 24.635569437832537 NB NB 23.789229094505
327
22.9488471 88616583
NB NB
23.850836903894 816
22.8424667 85058010
NB NB
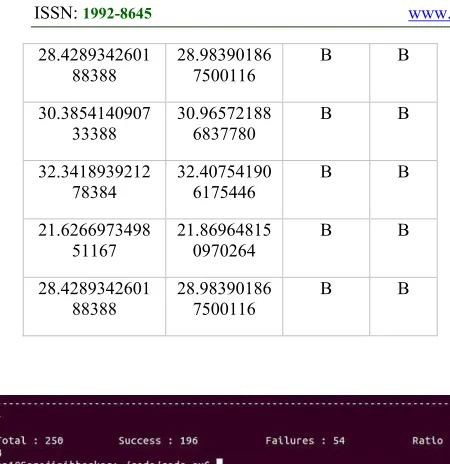
Table. 2. Results captured for bankruptcy class
Anomaly Normal Classifie d Class 32.3418939212 78384 32.40754190 6175446
B B
28.7121840122
81227 28.802991677272868 B B
28.8519459546
56387 28.563469233874617 NB B
28.5724220699 06068
29.04251412 0671115
B B
30.4571579955 92230
30.72502801 3423284
B B
26.8274480865 95066
27.12047778 4520702
B B
24.6594624088
16070 25.618874081995784 B B
26.6075342096
74040 27.319277539498728 B B
28.4289342601 88388
28.98390186 7500116
B B
26.7510220193 91720
27.37788979 2669727
B B
30.4571579955 92230
30.72502801 3423284
B B
28.5640140402
19040 29.031097558836393 NB B
30.5969199379
67385 30.485505570025033 NB B
30.6522185781 63613
30.61443925 3400924
1831 28.4289342601
88388
28.98390186 7500116
B B
30.3854140907 33388
30.96572188 6837780
B B
32.3418939212
78384 32.407541906175446 B B
21.6266973498
51167 21.869648150970264 B B
28.4289342601
[image:9.612.73.298.72.304.2]88388 28.983901867500116 B B
Fig. 6. Calculation of success and failure rate
The results obtained from the predicted model are shown in Table 1, Table 2, and Fig.6. Classified is the predicted output from proposed model and class is determined on the basis of assumption that series data collected from classified. In total, 250 input samples were considered for validation, and it has been observed that the success and failure rates are 196 and 54, respectively. Further, it is observed that class is dependent on classified result, and the change in class is observed when continuous similar result is observed in classified section for a certain period of time. If the result is frequently changing in classified, then class will remain constant. From Table 1 and 2, it is observed that there is a continuous change in terms of bankrupted and non-bankrupted in classified section, which states that the output of class follows the previous stage output of non-bankrupted and it does not change until constant result is observed in classified section for certain period of time. As shown in Fig. 8, an accuracy ratio obtained from the proposed system is 0.784 for 250 samples. In this research, since we are considering big data, the success probability increases randomly with increase in input data which tends to increase the success rate ratio of the system.
5. CONCLUSION
In this research, effective predictive model has been proposed using big data analytics and Naive bayes algorithm. The big data has been successfully stored in hadoop H-base platform and effective feature set comprising industrial risk, management risk, and others. are extracted from big
data. These feature sets are further processed through naive bayes classifier and apache mahout platform for validation. The results obtained from the proposed model show that naive bayes classifier technique along with big data hadoop tool is successful in determining bankruptcy prediction with ratio of 0.784. Furthermore, our proposed system is proved to be an efficient tool for bank supervisions and financiers for early detection of risk profile which may arise due to bankruptcy. In future, this work can be extended by considering international framework comprising national regulations to address the credit risk and to determine best performing regulations.
REFERENCES
[1] McKee, Thomas E. "Rough sets bankruptcy prediction models versus auditor signalling rates." Journal of Forecasting 22, no. 8
(2003): 569-586.
[2] Doolatabadi, Hossein Rezaie, Seyed Mohsen Hoseini, and Rasoul Tahmasebi. "Using decision tree model and logistic regression to predict companies financial bankruptcy in Tehran stock exchanges." International Journal of Emerging Research in Management &Technology 2, no. 9 (2013):
7-16.
[3] Kumar, P. Ravi, and Vadlamani Ravi. "Bankruptcy prediction in banks and firms via statistical and intelligent techniques–A review." European journal of operational research 180, no. 1 (2007): 1-28.
[4] Bellovary, Jodi L., Don E. Giacomino, and Michael D. Akers. "A review of bankruptcy prediction studies: 1930 to present." Journal of Financial education (2007): 1-42.
[5] Tsai, Chih-Fong. "Feature selection in bankruptcy prediction." Knowledge-Based Systems 22, no. 2 (2009): 120-127.
[6] Moro, Sérgio, Paulo Cortez, and Paulo Rita. "Business intelligence in banking: A literature analysis from 2002 to 2013 using text mining and latent Dirichlet allocation." Expert Systems with Applications 42, no. 3 (2015):
1314-1324.
[7] Rish, Irina. "An empirical study of the naive Bayes classifier." In IJCAI 2001 workshop on empirical methods in artificial intelligence,
vol. 3, no. 22, pp. 41-46. 2001.
[8] Gordini, Niccolo. "A genetic algorithm approach for SMEs bankruptcy prediction: Empirical evidence from Italy." Expert systems with applications 41, no. 14 (2014):
1832 [9] Zelenkov, Yuri, Elena Fedorova, and Dmitry
Chekrizov. "Two-step classification method based on genetic algorithm for bankruptcy forecasting." Expert Systems with Applications 88 (2017): 393-401.
[10] Kim, Hyun-Jung, Nam-Ok Jo, and Kyung-Shik Shin. "Optimization of cluster-based evolutionary undersampling for the artificial neural networks in corporate bankruptcy prediction." Expert Systems with Applications
59 (2016): 226-234.
[11] Tsai, Chih-Fong, and Jhen-Wei Wu. "Using neural network ensembles for bankruptcy prediction and credit scoring." Expert systems with applications 34, no. 4 (2008):
2639-2649.
[12] Sudarsanam, S. K. "A Fuzzy Neural Network Model for Bankruptcy Prediction." India, June (2016).
[13] Shin, Kyung-Shik, Taik Soo Lee, and Hyun-jung Kim. "An application of support vector machines in bankruptcy prediction model."
Expert Systems with Applications 28, no. 1
(2005): 127-135.
[14] Kim, Sungdo, Byeong Min Mun, and Suk Joo Bae. "Data depth based support vector machines for predicting corporate bankruptcy." Applied Intelligence 48, no. 3
(2018): 791-804.
[15] Erdogan, Birsen Eygi, and Süreyya Özöğür Akyüz. "A weighted ensemble learning by SVM for longitudinal data: Turkish Bank bankruptcy." In Trends and Perspectives in Linear Statistical Inference, pp. 89-103.
Springer, Cham, 2018.
[16] Nagaraj, Kalyan, and Amulyashree Sridhar. "A predictive system for detection of bankruptcy using machine learning techniques." arXiv preprint arXiv:1502.03601 (2015).
[17] Aida Krichene, "Using a naive Bayesian classifier methodology for loan risk assessment: Evidence from a Tunisian commercial bank." Journal of Economics, Finance and Administrative Science 22.42: 3-24, 2017.
[18] Tseng, Fang-Mei, and Yi-Chung Hu. "Comparing four bankruptcy prediction models: Logit, quadratic interval logit, neural and fuzzy neural networks." Expert Systems with Applications 37, no. 3 (2010):
1846-1853.
[19] Min, Jae H., and Young-Chan Lee. "Bankruptcy prediction using support vector machine with optimal choice of kernel function parameters." Expert systems with applications 28, no. 4 (2005): 603-614.