483
LIVER SEGMENTATION FROM ABDOMEN CT IMAGES
WITH BAYESIAN MODEL
NIDAA ALDEEK, 1RAJA S. ALOMARI, 2M B AL-ZOUBI, 3HAZEM HIARY King Abdullah II School for Information Technology, The University of Jordan, Amman, Jordan
E-mail: [email protected] , [email protected] , [email protected]
ABSTRACT
Liver segmentation from CT volumes has been a challenging problem due to the high inter-organs intensity similarity, the intra-liver intensity variability, and the partial volume effect. In this paper, we perform an extensive review of the liver segmentation literature from CT and MRI. Furthermore, we propose a Bayesian model for a robust and reproducible semi-automatic technique for liver segmentation from CT volumes. We train our model and validate it using 44 clinical volumes for patients with various types of liver abnormality including tumor. Our segmentation results show a robust and clinically acceptable liver volume for all the 44 clinical cases we have with average area overlap accuracy over 87%. Our method is superior to all state of the art methods that has only been validated on less number of subjects as we show during the literature survey.
Keywords: Liver Segmentation, Bayesian Model, Computed Tomography, Abdomen.
1. INTRODUCTION
Liver tumor is one of the most common types of tumors that cause death in the world. In 2010, over 18000 people died because of liver cancer in United States [1]. Surgical intervention is one of the ultimate treatment options. Surgery planning is an important step of successful tumor removal. Planning includes quantification of the tumor size, its location, and trajectories during surgery, and the effect of tumor removal on other neighboring organs such as the gall bladder and the percentage of the surgery success.
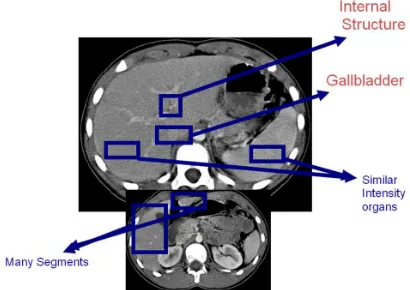
[image:1.612.314.519.414.559.2]Liver segmentation from abdominal Computed Tomography (CT) volumes is an important step in many diagnostic and surgical procedures. It is also useful in building many related computer aided diagnosis, computer guided surgery systems, building anatomical atlases for the abdominal area, and many other applications. Various challenges face liver segmentation from abdominal area including: high inter-organs intensity similarity in the abdominal area, partial volume effect where organs’ boundaries are ill-defined, multi-segment of the liver especially in the lower portion, the location of the gallbladder and its great intensity similarity with the liver, the confusing internal structure of the liver and many other challenges as illustrated in Figure 1.
Many researchers work on liver segmentation from abdominal area. However, each technique has
its own strength and weakness. Campadelli et al [2] presented a thorough survey of these techniques with a comparative study.
Figure 1. A Sample CT Scan Of The Abdominal Area Showing Some Challenges Of Liver Segmentation.
In our previous paper [3], we presented a fully automated liver segmentation from abdominal area based on a Markov Random Field for liver detection and a Gradient Vector Flow (GVF) snake model for boundary refinement. However, we only had 13 clinical cases at that time. In this paper, we validate our work on a significantly larger dataset including 44 cases.
overlap, Dice measure, and Hausdroff distances are usually used for validation. However, visual validation of the cases by an expert is still a necessary measure for the validity of the segmentation method as discussed in our previous work [4]. In this work, we validate our method using both careful visual examination by an expert radiologist and using one quantitative measure for error and accuracy with one ground truth.
The rest of this paper is organized as follows: Section 2 presents an exhaustive literature survey for liver segmentation. Section 3 presents our proposed technique and our classifier. Section 4 presents our data and experimental validation methods and then we conclude in section 5.
2. LITERATURE SURVEY
Liver segmentation has been tackled by many researchers for various computer aided diagnosis and surgery applications. Many surveys exist in the literature for exhaustive review of the literature such [2]. Here we mention some recent related techniques.
Liu et al. [5],[6] used gradient vector flow (GVF) field as an external force. Active contours are obtained by defining curves whose shape and location are guided by two forces: internal forces that are derived from pixels on the curve to impose desirable properties on the curve shape and external forces that are derived from image characteristics to limit the curve to certain locations in the image. Zhou et al. [7] proposed a probabilistic model for liver segmentation from CT which was evaluated on 152 subjects. Lim et al. [8] proposed liver segmentation for volume estimation from CT. They analyzed the intensity distribution to obtain a priori model to determine the coherent regions of liver. They utilized morphological filters and a labeling-based search algorithm to obtain the liver contour, which then leads to liver volume estimation.
Ciecholewski and Debski [9] utilized the lumbar section of the spine as an initial reference to perform liver segmentation from CT. Then they constructed a finite number of joint poly-lines that resulted in two polygons representing the liver segments. Rikxoort et al. [10] started with pre-processing steps to determine the vertical scan range of the liver and to rotate the scan so that the subject is in supine position. Then they performed voxel labeling with K-nearest-neighbor. A final smoothing filter is then applied to obtain a fine segmentation. They only evaluated the system on 10 test cases. Saddi et al. [11] estimated the pose and global shape properties with a statistical shape
model to learn shape features of the liver. Then they used a template to recover local deformations. They only validated their method on 10 cases. Slagmolen et al. [12] built an atlas based on 20 cases using non-rigid registration. Susomboon et al. [13] utilized intensity and texture information to generate probability images that aid in segmenting the liver for new cases. They tested their method with 10 cases. Ma and Yang [14] proposed a two-step scheme: estimation of the statistical parameter vector of a mixture Gaussian distribution by the Expectation Maximization (EM) algorithm, and then using morphological filters to remove foreign components and apply image hole-filling.
Liu et al. [15] proposed an adaptive method that utilizes a bi-class Support Vector Machine (SVM) after applying adaptive thresholding and Kmeans clustering. Size of data was limited. Freiman et al. [16] presented a new algorithm for nearly automatic liver segmentation and volume estimation from abdominal CT images and its validation. They used a multi-resolution iterative scheme that repeatedly applied smoothed Bayesian classification to identify the liver and other organs. They evaluated their method with two retrospective studies on 56 validated CT images. They obtained 0.98 and 0.99 correlation for liver volume estimation, with mean volume differences of 5.36 and 2.68% with respect to manual ground truth estimation, and mean volume variability for different initial seeds of 0.54 and 0.004%, respectively.
Platero et al. [17] segmented liver from MR images based on 3D anisotropic diffusion processing. They obtained an initial segmentation using edge detection techniques (Canny edge
detector), histogram analysis and binary
morphological post-processing. Then they applied an active contour to refine the segmentation. They computed the undirected partial Hausdroff distance
between the boundary of the computed
485
Expectation Maximization (EM) algorithm,
elimination of the ribs and heart, applying double thresholding, and then a final labeling step. They also evaluated their method on 10 CT cases and obtained an average overlap error of 15.3%.
Luo et al. [21] proposed a three step automated technique: texture filters, then a support vector machines (SVM) to classify based on texture analysis, and then post processing morphological operators. Zhao et al [22] proposed a method by initially removing the ribs and spine based on thresholds, and then utilized a neural network to perform the segmentation and the morphological post processing. Our proposed method is unique because it deals with clinical data and seamlessly incorporates within the radiologist or technician routine to perform a quick and highly robust liver segmentation.
Zhang et al. [23] segmented the liver from CT scans with a Statistical Shape Model (SSM)
integrated with an optimal-surface-detection
strategy. They built an average liver shape model with a training set. Then they used subspace initialization of the SSM and shape model deformation to adapt to the liver contour through an optimal-surface-detection. Zayane et al. [24] built a priori knowledge model of location and shape of the liver from a training set of CT images. Then they applied the Greatest Connected Component (GCC) algorithm to detect the largest connected component, which is assumed to be the liver. Few morphological operators are then applied for image filling.
Masoummi et al. [25] used mathematical morphology to enhance the image through reserving edges and reducing noise. They trained the MLP neural networks to extract the features of the liver region to avoid over-segmentation. These extracted features were used to monitor the quality of the segmentation using the watershed transform and adjust the required parameters automatically.
The average accuracy, based on Jaccard
coefficients, was 0.94.
Few research efforts has been proposed by directly working on 3D volumes rather than slice-by-slice fashion such as Okada et al. [26], who developed an atlas-based liver segmentation method from 3D CT volumes. They performed voxel-based segmentation with a Probabilistic Atlas (PA) to an initial region for subsequent Statistical Shape Model (SSM) fitting to 3D CT images. They utilized a Multi-Level SSM (ML-SSM) to improve the reconstruction accuracy especially for largely deformed liver. The whole shape was divided into patches. For each patch, the principle Component
Analysis was applied. They introduced a new constraint (adhesiveness constraint) for overlap regions among patches. Through this method, they demonstrated that segmentation accuracy improved by using PA and ML-SSM. However, the Jaccard similarity measure and average distance were 0.86 (± 0.05) and 2.15 (± 0.62) mm on average, respectively. Dawant et al. [27] used a level-set approach and a dynamically adapted speed function. They trained an anatomic atlas to reduce leakage at the liver-rib interface.
Wimmer et al. [28] proposed a two-stage liver segmentation from CT scans. A manual delineation of cross-sections of the anatomical structure in 2D multi-planer reconstruction views is constructed. Then an initial 3D surface was reconstructed using radial basis functions. Then they applied a level set algorithm incorporating a new combination of image information and shape information. They validated their method on only 10 CT scans. Kainmüller et al. [29] presented a combination of a constrained free-form and statistical deformable model for liver segmentation. Furukawa et al. [30] trained a maximum a posterior probability estimation. Then they used a combination of the probability density function of a Gaussian mixture distribution and a prior probability derived from a probabilistic atlas of the liver. Then they used level set for better final segmentation.
Seghers et al. [31] modeled an object as a set of landmarks augmented with local appearance models to perform 3D liver segmentation on 10 cases. Yussof and Burkhardt [32] used anisotropic diffusion to filter the original liver volume from 3D CT. Then they applied thresholding to preserve all tissues that have the same intensities for liver. They
also performed morphological operators to
ultimately obtain a smooth fine liver region with a graph-cut technique. They also evaluated their method on 10 cases. Lu et al. [33] initialized a deformable model with a manually created simple mesh model for the liver. They formulated the deformation of the shape to adapt to the boundary by minimizing a local cost function associated with each model vertex. The experimental results demonstrated the effectiveness of the proposed algorithm.
3. PROPOSED METHOD
Figure 2. Workflow Of Our Liver Segmentation Technique.
3.1 Preprocessing
Our clinical CT volumes contain a set of images that span the abdominal area from the chest down to the pelvis in axial views. We initially perform a clinically approved preprocessing step known as window/level enhancement.
Window/Level enhancement is based on the physical properties of the tissue being scanned by the CT. This enhancement is achieved by converting the intensity values of the image into Hounsfield units [34]. Each material has physically-approved Hounsfield values that are based on the physical intensity of that material. HU values are quantitative measure of the transparency of a material to X-rays. Table 1 shows some of the known material with the corresponding Hounsfield values. Window/level enhancement aims at enhancing specific Hounsfield values (HU) over the rest of the values in the signal. Figure 3 shows the window/level application filter. We convert to Hounsfield values (HU) from DICOM intensity values (I):
Intercept scaleSlope
y x I y x
HU( , )= ( , )*Re + (1)
where I(x,y) is the DICOM intensity values at the
2D image location x, y. HU(x,y) is the
corresponding Hounsfield value. Both
scaleSlope
Re and Intercept are two parameters
supplied from the DICOM header for each slice within the abdominal volume.
Figure 3. Window/Level Filter Applied On Hounsfield (HU) Values.
Once the volume is enhanced upon the clinical standard, the radiologist uses our viewer to browse over the volume. Because our data is clinical, there are many slices that do not have the liver in them. In some cases, as much as half the abdominal volume does not have the liver because clinical abdominal standard is to acquire the whole area from the chest down to the pelvis. Thus, the radiologist (or the technician) browses over the cases from top where the heart appears down to the last slice that shows the liver. In each slice, she draws an oval that contains the liver (and some other structures). We then apply our Bayesian Model for segmentation.
3.2 Bayesian Model
We design a Bayesian classifier that learns its parameters from a set of training data. Our classifier maximizes the posterior probability
)
|
(
c
I
p
for each pixel in the input image I (ovalselected by the radiologist):
) | ( max
arg p c I
L
I
= (2)
where L is the outcome of our classifier at each
pixel in the input image I ,
c
is a binary randomvariable where c =1for a liver pixel and c = 0for
a non-liver pixel. Using Bayesian:
)
(
)
(
)
|
(
)
|
(
I
p
c
Xp
c
I
p
I
c
p
=
(3)where p( cI| ) is the likelihood of a pixel to be in
each class (liver/non-liver), p( c)is the prior
Table 1. Hounsfield values for some material.
Material Hounsfield
Air -1000
Fat -120
Water 0
Muscle +40
487
probability for liver/non-liver classes, and p( I)is
the marginal probability over the classes (liver/non-liver).
As a standard practice, to maximize the posterior probability, we maximize the logarithm of the posterior:
)] | ( ln[ max
arg p c I
L
I
= (4)
where
)]
(
ln[
)]
(
)
|
(
ln[
]
)
(
)
(
)
|
(
ln[
)]
|
(
ln[
I
p
c
xp
c
I
p
I
p
c
Xp
c
I
p
I
c
p
=
=
(5)
However, ln[p(I)]is a constant and thus can be
ignored. Thus,
)]
(
)
|
(
ln[
)]
|
(
ln[
p
c
I
α
p
I
c
xp
c
(6)Reducing this, we conclude:
(
ln[
(
|
)
ln[
(
)]
)
max
arg
p
I
c
p
c
L
I
+
α
(7)We then model both the likelihood p(I|c) as
Gaussian distributions where:
2 2
2 ) (
2 1 ) |
( σ
µ
π
σ
− −
=
I
e c
I
p (8)
where
µ
andσ2are the mean and variance of theclasses c={liver, non-liver}. Both parameters are learned from a set of data points (1500 points (750 point of each class) that were manually selected from a set of liver images.
3.3 Post processing
Two post processing steps were performed. A 2D median filter to eliminate the salt and pepper noise resulting from some pixels with similar intensity levels for structures surrounding the liver (happen to be inside the selected oval). Then we apply an image filling operation [35] to close the holes inside the liver resulting from the internal structure of the liver.
4. DATA AND RESULTS
We collect our data from our collaborating radiology center. We obtain 44 clinical cases that
have various abnormality types with some normal cases. Our data is anonymized before removal from the radiology center location. Patient consents were taken for each of the cases. Each case consists of a full volume of the abdominal area starting from the chest down to the pelvis. Some of the cases contain up to 120 slides while other might include as few as 50 slides. Images are in DICOM format with 512 x 512 x 5 mm per voxel.
We obtain the ground truth from one radiologist and currently working on having three more radiologists to manually segment each case. Our ground truth was performed as a contour surrounding the liver by software that we develop upon the convenience of the radiologist.
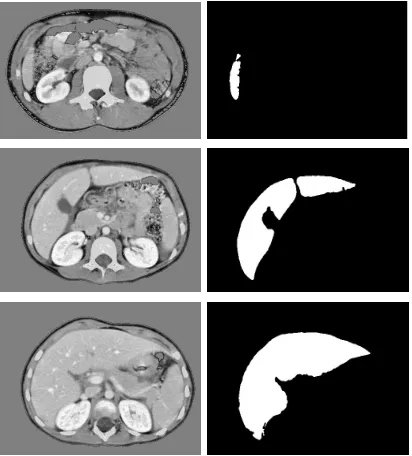
We run our method on all the 44 cases and obtained the full volume of each case. Figure 4 shows a sample a middle slice at each step in our proposed work flow (Figure 2).
[image:5.612.315.521.406.634.2]One strength aspect of our method is that it works on all slices whether the liver is small (lower slices) or big (middle slices) which makes it clinically suitable because radiologist are concerned with accuracy more than fully automating the workflow. Figure 4 shows a set of sample slices from various abdominal levels.
We validate our proposed method in two ways: qualitative and quantitative. Segmentation accuracy
quantitative techniques have positives and
negatives and there is no one technique that
provides optimum sense of the meaning of accuracy [36].
For qualitative validation, we ask our radiologist to thoroughly view each slice in each of the 44 cases and record the result of the segmentation as one of two choices: clinically acceptable or not. By this decision, there is a rational factor to what is clinically acceptable or not. However, the radiologist can determine that. Our radiologist approved all cases as clinically acceptable cases.
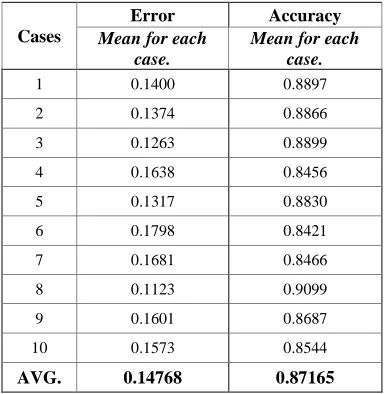
Table 2 shows the summary of two quantitative measures that we call accuracy and error:
G
G
R
Accuracy
=
∩
(9)G
G
R
G
R
Error
=
∪
−
∩
(10)where R and G are areas of our method’s and the gold standard segmentation results, respectively.
We randomly selected ten cases to give a sense of the quantitative accuracy. However, full results and thorough statistical analysis will appear in an extended version of this paper due to size limitation. We achieved an average of 87% area overlap.
5. CONCLUSION
In this paper, we proposed a robust, reliable, and clinically acceptable method for liver segmentation from CT volumes. We proposed a Bayesian-based classifier to model the posterior probability distribution of the image intensity. Then we assign a binary class for each pixel of being a liver or not. Our experimental validation on 44 cases shows a perfect clinical satisfaction from our collaborating
radiologist who manually validated our
segmentation for each case. We also provide two
quantitative measures for the segmentation
compared to a manual segmentation by an expert radiologist and achieved an average area overlap over 87%. Furthermore, we provided an extensive literature survey for liver segmentation from abdomen radiology images.
We work on obtaining three more manual segmentations to provide reliable ground truth that takes into consideration the inter-observer variability in liver segmentation. Moreover, we currently prepare for a thorough clinical study on the
statistical significance of the inter-observer
variability and reliability of liver segmentation from CT volumes.
REFERENCES:
[1] A. Jemal, R. Siegel, J. Xu, and E. Ward,
“Cancer statistics”, CA: Cancer Journal for Clinicians, Vol. 60, No. 5, 2010, pp. 277-300.
[2] P. Campadellia, E. Casiraghia, and A.
Espositob, “Liver segmentation from computed tomography scans: A survey and a new algorithm”, Artificial Intelligence in Medicine, Vol. 45, No. 2-3, 2009, pp. 185-196.
[3] R. S. Alomari, S. Kompalli, and V. Chaudhary,
“Segmentation of the Liver from Abdominal CT Using Markov Random Field model and GVF Snakes”, Proceedings of the International Conference on Complex, Intelligent and Software Intensive Systems (CISIS ‘08), 2008, pp. 293-298.
[4] S. Kompalli, M. Alam, R.S. Alomari, S.T.
Lau, and V. Chaudhary, “Design of a
benchmark dataset, similarity metrics, and tools for liver segmentation”, Proceedings of SPIE Conference on Medical Imaging, Vol. 6915, 2008, pp. 691537.
[5] F. Liu, B. Zhao, P. Kijewski, M. S. Ginsberg,
L.Wang, and L. H. Schwartz, “Automatic liver contour segmentation using GVF snake”, Proceedings of SPIE Conference on Medical Imaging, Vol. 5370, 2004, pp. 1466-1473.
[6] F. Liu, B. Zhao, P.K. Kijewski, L. Wang, and
[image:6.612.320.513.118.315.2]L.H. Schwartz, “Liver Segmentation for CT images using GVF snake”, Medical Physics, Vol. 32, No. 12, 2005, pp. 3699-3706.
Table 2. Quantitative Accuracy Measures (Eq. 9, 10) For A Set Of Randomly Selected Sets
Cases
Error Accuracy
Mean for each case.
Mean for each case.
1 0.1400 0.8897
2 0.1374 0.8866
3 0.1263 0.8899
4 0.1638 0.8456
5 0.1317 0.8830
6 0.1798 0.8421
7 0.1681 0.8466
8 0.1123 0.9099
9 0.1601 0.8687
10 0.1573 0.8544
489
[7] X. Zhou, T. Kitagawa, T. Hara, H. Fujita, X.
Zhang, R. Yokoyama, H. Kondo, M.
Kanematsu, and H. Hoshi, “Constructing a Probabilistic Model for Automated Liver Region Segmentation Using Non-contrast Torso CT images”, Proceedings of the International Conference on Medical Image Computing and Computer-Assisted Intervention (MICCAI ‘06), Vol. 9, No. 2, 2006, pp. 856-863.
[8] S. Lim, Y. Jeong, and Y. Ho, “Automatic liver
segmentation for volume measurement in CT Images”, Journal of Visual Communication and Image Representation. Vol. 17, No. 4, 2006, pp. 860-875.
[9] M. Ciecholewski, and D. Dȩbski, “Automatic
Segmentation of the Liver in CT Images Using a Model of Approximate Contour”, Lecture Notes in Computer Science (LNCS), Vol. 4263, 2006, pp. 75-84.
[10]E. Rikxoort, Y. Arzhaeva, and B. Ginneken,
“Automatic segmentation of the liver in computed tomography scans with voxel classification and atlas matching”, In T. Heimann, M. Styner, and B. van Ginneken (Eds.): 3D Segmentation in the Clinic: A Grand Challenge, 2007, pp. 101-108.
[11]K. Saddi, M. Rousson, C. Chefd’hotel, and F.
Cheriet, “Global-to-Local Shape Matching for Liver Segmentation in CT Imaging”, In T. Heimann, M. Styner, and B. van Ginneken (Eds.): 3D Segmentation in the Clinic: A Grand Challenge, 2007, pp. 207-214.
[12]P. Slagmolen, A. Elen, D. Seghers, D. Loeckx,
F. Maes, and K. Haustermans, “Atlas based liver segmentation using nonrigid registration with a B-spline transformation model”, In T. Heimann, M. Styner, and B. van Ginneken (Eds.): 3D Segmentation in the Clinic: A Grand Challenge, 2007, pp. 197- 206.
[13]R. Susomboon, D. Raicu, and J. Furst, “A
Hybrid Approach for Liver Segmentation”, In T. Heimann, M. Styner, and B. van Ginneken (Eds.): 3D Segmentation in the Clinic: A Grand Challenge, 2007, pp. 151-160.
[14]L. Ma, and L. Yang, “Liver Segmentation
Based on Expectation Maximization and
Morphological Filters in CT Images”,
Proceedings of the International Conference on Bioinformatics and Biomedical Engineering (ICBBE ‘07), 2007, pp. 690-693.
[15]J. Liu, Q. Hu, Z. Chen and P. Heng, “Adaptive
Liver Segmentation from Multi-slice CT Scans”, Proceedings of the Asian-Pacific Conference on Medical and Biological
Engineering (IFMBE ‘08), Vol. 19, 2008, pp. 381-384.
[16]M. Freiman, O. Eliassaf, Y. Taieb, L.
Joskowicz, Y. Azraq, and J. Sosna, “An
iterative Bayesian approach for nearly
automatic liver segmentation: algorithm and validation”, International Journal of Computer Assisted Radiology and Surgery, Vol. 3, No. 5, 2008, pp. 439-446.
[17]C. Platero, J. Poncela, P. Gonzalez, M. Tobar, J.
Sanguino, G. Asensio, and E. Santos, “Liver Segmentation for Hepatic Lesions Detection and Characterisation”, Proceedings of the IEEE International Symposium on Biomedical Imaging: From Nano to Macro (ISBI ’08), 2008, pp. 13-16.
[18]M. Selver, A. Kocaoğlu, G Demir, H. Doğan,
O. Dicle, and C. Güzeliş, “Patient oriented and robust automatic liver segmentation for pre-evaluation of liver transplantation”, Computers in Biology and Medicine, Vol. 38, No. 7, 2008, pp. 765-784.
[19]K. Cheng, L. Gu, J. Wu, W. Li, and J. Xu, “A
Novel Level Set Based Shape Prior Method for Liver Segmentation from MRI Image”, Lecture Notes in Computer Science (LNCS), Vol. 5128, 2008, pp. 150-159.
[20]A. Foruzan, R. Zoroofi, M. Hori, and Y. Sato,
“Liver segmentation by intensity analysis and anatomical information in multi-slice CT images”, International Journal of Computer Assisted Radiology and Surgery, Vol. 4, No. 3, 2009, pp. 287-297.
[21]S. Luo, J. Jin, S. Chalup, and G. Qian“A Liver
Segmentation Algorithm Based on Wavelets and Machine Learning”, Proceedings of International Conference on Computational Intelligence and Natural Computing (CINC ‘09), Vol. 2, 2009, pp. 122-125.
[22]Y. Zhao, Y. Zan, X. Wang, and G. Li, “Fuzzy
C-means clustering-based multilayer perceptron neural network for liver CT images automatic segmentation”, Proceedings of Chinese Control and Decision Conference (CCDC ‘10), 2010, pp. 3423-3427.
[23]X. Zhang, J. Tian, K. Deng, Y. Wu, and X. Li,
[24]O. Zayane, B. Jouini, and M. Mahjoub, “Automatic Liver Segmentation method in CT
images”, Canadian Journal on Image
Processing and Computer Vision, Vol. 2, No. 8, 2011, pp. 92-95.
[25]H. Masoummi, A. Behrad, M. Pourmina, and A.
Roosta, “Automatic liver segmentation in MRI images using an iterative watershed algorithm and artificial neural network”, Biomedical Signal Processing and Control, Vol. 7, No. 5, 2012, pp. 429-437.
[26]T. Okada, R. Shimada, Y. Sato, M. Hori, K.
Yokota, M. Nakamoto, Y. Chen, H. Nakamura, and S. Tamura, “Automated Segmentation of the Liver from 3D CT Images Using Probabilistic Atlas and Multi-level Statistical Shape Model”, Proceedings of the International Conference on Medical Image Computing and Computer-Assisted Intervention (MICCAI ‘07), Vol. 10, No. 1, 2007, pp. 86-93.
[27]B. Dawant, R. Li, B. Lennon, and S. Li,
“Semi-automatic Segmentation of the Liver and its Evaluation on the MICCAI 2007 Grand Challenge Dataset”, In T. Heimann, M. Styner, and B. van Ginneken (Eds.): 3D Segmentation in the Clinic: A Grand Challenge, 2007, pp. 215-221.
[28]A. Wimmer, G. Soza, and J. Hornegger,
“Two-stage Semi-automatic Organ Segmentation Framwork using Radial Basis Functions and Level sets”, In T. Heimann, M. Styner, and B. van Ginneken (Eds.): 3D Segmentation in the Clinic: A Grand Challenge, 2007, pp. 179-188.
[29]D. Kainmüller, T. Lange, and H. Lamecker,
“Shape Constrained Automatic Segmentation of the Liver based on a Heuristic Intensity Model”, In T. Heimann, M. Styner, and B. van Ginneken (Eds.): 3D Segmentation in the Clinic: A Grand Challenge, 2007, pp. 109-116.
[30]D. Furukawa, A. Shimizu, and H. Kobatake,
“Automatic Liver Segmentation Method based
on Maximum A Posterior Probability
Estimation and Level Set Method”, In T. Heimann, M. Styner, and B. van Ginneken (Eds.): 3D Segmentation in the Clinic: A Grand Challenge, 2007, pp. 117-124.
[31]D. Seghers, P. Slagmolen, Y. Lambelin, J.
Hermans, D. Loeckx, F. Maes, and P. Suetens, “Landmark based liver segmentation using local shape and local intensity models”, In T. Heimann, M. Styner, and B. van Ginneken (Eds.): 3D Segmentation in the Clinic: A Grand Challenge, 2007, pp. 135-142.
[32]W. Yussof, and H. Burkhardt, “Automatic 3D
Liver Segmentation Using Morphological
Operations and Graph-Cut Techniques”,
Journal of Next Generation Information Technology, Vol. 2, No. 3, 2011, pp. 23-34.
[33]J. Lu, L. Shi, M. Deng, S.C.H. Yu, and P. Heng,
“An interactive approach to liver segmentation in CT based on deformable model integrated
with attractor force”, Proceedings of
International Conference on Machine Learning and Cybernetics (ICMLC ‘11), Vol. 4, 2011, pp. 1660-1665.
[34]G.N. Hounsfield, “Computed Medical
Imaging”, Science, Vol. 210, No. 4465, 1980, pp. 22-28.
[35]P. Soille, “Morphological Image Analysis:
Principles and Applications”, Springer-Verlag, 1999, pp. 173-174.
[36]W.R. Crum, O. Camara, D.L. Hill, “Generalized
Overlap Measures for Evaluation and