Assessment of forest density using geospatial techniques
of a tropical protected area
M. Shamshad Alam
1#*, Jamal A. Khan
2, Bharat J. Pathak
3$and Sandeep Kumar
41&2
Department of Wildlife Sciences, Aligarh Muslim University, Aligarh-202002, India
3
Gujarat Forest Department, Wildlife Circle, Junagadh-362001, India.
4
Gujarat Forest Department, Wildlife Division, Sasan-Gir, Junagadh-362135, India.
#
Current address: BCRLIP-GIR, Wildlife Division, Sasan-Gir, Junagadh-362135, India.
$
Current address: Director, GEER Foundation, Gandhinagar- 382007, India.
*
Corresponding author (Email: [email protected])
Abstract- The management, development and conservation of a protected area require vast knowledge of forest resources, its distribution and utilization pattern by its flora and fauna. Application of remote sensing and GIS as a tool, has assumed immense significance in assessment of these information. These applications are now widely used in conservation and management of protected areas across the globe. Forest canopy density is one of the important parameters in the management of a forest. And advancement of geospatial technologies provides a method to evaluate forest cover in the inaccessible and remote areas. In this study, the forest canopy density of Gir National Park and Sanctuary a tropical forest area was evaluated using remote sensing and GIS. The satellite imagery was utilized to generate spatial data of forest density of this protected area. Approximately 63.5percent of forest area was found as covered with forest canopy density of less than 10–40%, while 35.89percent forest area was found with the density class of 40 to more than 70%. These techniques are very much cost effective; provide information at a satisfactory accuracy level which will be beneficial for the biodiversity management and planning specially the forestry sector.
Index Terms- Forest density, Gir National Park and Sanctuary, Remote Sensing, GIS, NDVI
I. INTRODUCTION
n understanding of the relationship between spatial distribution of animals and their habitats plays an important role in conservation and management of a protected area (Lecis & Norris, 2003). Remote sensing is a technology of gathering information about objects without being in physical contact with them while using different wavelength regions of electromagnetic spectrum (Kushwaha, 2005). All the remote sensing systems, capture radiations of different wavelengths reflected by the earth surface features and record it either directly on the film as in case of aerial photography or on a digital medium such as tape; which further can be used to generate the image. Remote sensing and Geographic Information System (GIS) can be used as tool for obtaining information about the quality and status of a protected area and its utilization pattern by various wildlife species. These informations are very crucial while managing a protected area for the conservation of wildlife species. Remote sensing and GIS also help in monitoring areas of
land for their suitability to wild species, through integration of various habitat variables of both spatial and non-spatial nature (Davis et al., 1990). The outputs of such systems are usually simple, easily understandable and can be used for the assessment of environmental impacts or prioritization of conservation efforts in a timely and cost-effective manner (Kushwaha et al., 2004).
Tropical forests are usually being rich in biodiversity with a variety of species richness and diversity (Alwyn & Calaway, 1987; Jacobs, 1988). These areas are also recognized as dense forests due to the high density of vegetation formed by clumped distribution of individuals and also enormously tangled undergrowth of different herbs, shrubs and climbers. Detailed and accurate maps of these forests condition and structure are required for assessment of the floral and faunal diversity as well as for sustainable forest management (Blodgett et al., 2000). Assessment of forest density and its evaluation is one of the important aspects of management and long term monitoring of protected area for meaningful biodiversity conservation. It is also helpful in planning and implementation of forest rehabilitation programs (Rikimaru et al., 2002). It has been suggested that canopy density is an essential parameter to assess and analyze the factors affecting forest growth, its regeneration and to ensure on management initiatives outputs (Chauhan, 2004). The traditional way of ground monitoring for these estimation can be costly and time consuming, whilst the use of GIS and remote sensing, as a platform for estimating the density of protected areas, may speed up the process and provide for a more efficient option (Blodgett et al., 2000). Geospatial technologies including remote sensing, GIS and Global Positioning System (GPS) provide factual data and information on quality and forest canopy density status of forest area (Schamberger & Krohn, 1982).
Various species requires different resources in terms of food, shelter and mate. Some species need dense forest cover while some need open or degraded habitat, which also governs the resource partitioning between the different species for their survival. The degree of forest canopy cover, a species required in their habitat, is crucial for suitability of the area for a particular species. The higher the resources, the better are the chances for the survival of species. Development in geospatial technologies provides a method to evaluate forest cover in the inaccessible and remote areas. The satellite remote sensing is best suited for analysis of canopy closures, as elucidated by Roy et al. (1994).
The concept of habitat analysis started with the development of habitat evaluation procedure by the U.S. Fish and Wildlife Service. Evaluation of wildlife habitats based on ecological principles is well-established in USA in connection with environmental impact assessments, where the aim was to ensure that appropriate consideration is given to the development planning process (U.S. Fish and Wildlife Service, 1981). At the same time, there has been considerable pressure for the use of standardized procedures for habitat evaluation, both for economical as well as ecological reasons, among various organizations and professionals. Many authors have used remotely sensed data along with other ecological parameters to assess the habitat in many areas (Bright, 1984; Kelly, 1987; Lyon, 1983; Parihar et al., 1986; Roy et al., 1995; Alam, 2011).
II. STUDYAREA
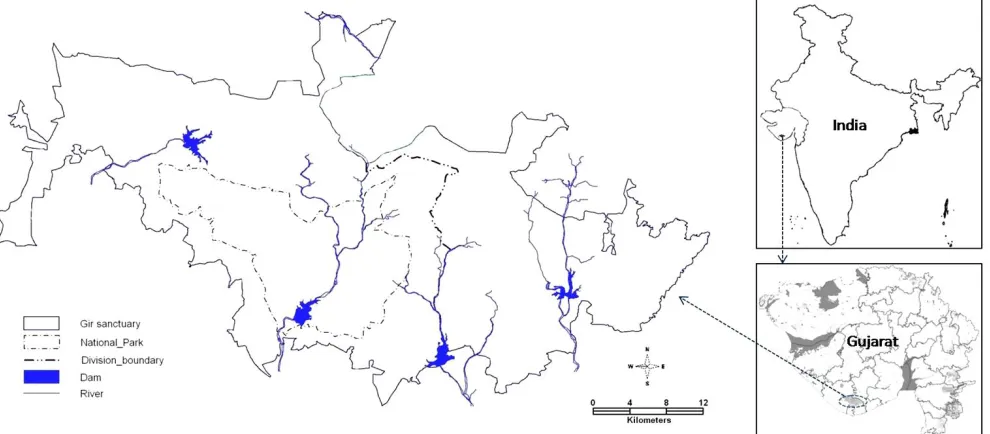
This study was carried out in the Gir National Park and Sanctuary (GNPS), located in Gujarat province of India (Fig. 1). GNPS is well-known for only wild population of Asiatic lion (Panthera leo persica) in the world. The total area of GNPS is 1412.13 km² of which the National Park comprises of 258.71 km² surrounded by 1153.41 km² of Sanctuary. It also supports a rich biodiversity viz., 606 recorded flowering plant species, 39 mammal species, 37 reptiles, 300 species of birds and more than 2000 species of insects (Singh & Kamboj, 1996; Alam, 2011; Meena & Kumar, 2012). Apart from the Asiatic lion, other carnivores such as leopard (Panthera pardus), jungle cat (Felis chaus), striped hyena (Hyaena hyaena), jackal (Canis aureus), Indian fox (Vulpes benghalensis), ratel (Mellivora capensis), mongoose (Herpestes edwardsi), and rusty spotted cat (Prionailurus rubiginosus) are found in GNPS. Major herbivores include chital (Axis axis), sambar (Cervus unicolor), nilgai (Boselaphus tragocamelus), four horned antelope (Tetracerus quadricornis), langur (Presbytis entellus) and chinkara (Gazella gazella). The GNPS falls under the type 5A/Cla, i.e., very dry teak forest (Champion & Seth, 1968). The area is comprised of low hills of volcanic origin with an altitudinal range of 83-524 m.
GNPS (20°40' to 21°50' N to 70°50' to 71°15' E), lies around 40 km away from the coast in the Kathiawar or Saurashtra peninsula of Gujarat state of India. It stretches over a length of about 70 km from west to east and 40 km from north to south. The sanctuary is narrowest in the east and west. Major portion of Gir forest falls in Junagadhand Gir-Somnath districts, and the remaining in Amreli district. Three different management units can be recognized in GNPS. They are sanctuary west, national park and sanctuary east. These management units differ in terms of vegetation, topography, rainfall and degradation. The climatic condition of Gir is generally hot with an erratic monsoon. Seasons in Gir are fairly distinct. June through September is monsoon, followed by a post monsoon season. Late November to early March is winter season. It is followed by a hot dry season from mid March to mid June. The maximum and minimum temperature is 45°C in summer and 7°C in winter. Rainfall is erratic and unevenly distributed. The maximum and minimum annual rainfall being 1866 mm and 199 mm respectively, average being 980 mm. There are 45 small settlements known as Nesses are occupied by Maldharies (pastoral grazers) in some part of Gir Sanctuary.
[image:2.612.64.559.499.716.2]The most important aspect of Gir forest is that it has become a very stable ecosystem with tremendous regenerating, self supporting and self sustaining capacity due to its rich and diverse fauna and flora. This ecosystem forms a part of south central highlands in Saurashtra region and is a catchment of important rivers like Shetrunji, Hiran, Saraswati, Shingoda, Machhundri, Raval and Datardi. The forest of GNPS helps in recharge the water table due to infiltration and percolation in conjunction with soil and moisture conservation. The continuous forest covers over a large tract also exert significant moderating effect on the climate in the region. The GNPS also helps in reducing the salinity problem on the southern coast of Saurashtra. Thus, GNPS is a boon to farmers inhabiting the peripheral environs by ensuring sustained agricultural and horticultural production to them.
III. DATAANDMETHODOLOGY
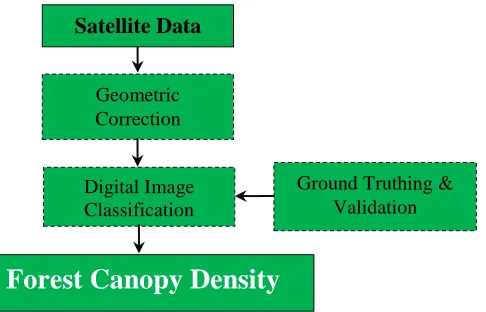
The study was divided into two stages; the first stage was field survey (2007 to 2009), collection and processing of collateral and satellite data to create spatial data base on forest canopy density, while the second stage was geospatial analysis (Fig. 2). Random stratified vegetation sampling was carried out during the research project. Each sampling point was marked with GPS and data on canopy cover was recorded throughout the study area. In this study, computer software ERDAS Imagine 9.1, ArcGIS 9.3, ArcView 3.2a were used for data processing and GIS analysis.
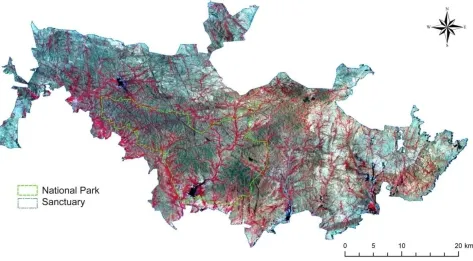
Satellite data of Landsat-TM dated 15th May 2009, path-row: 149-45 was downloaded from http://glovis.usgs.gov/. A map with various attributes of GNPS with high resolution was co-registered using geometric correction techniques. This data was re-projected into Universe Transverse Mercator (UTM) World Geodetic System-84 (WGS 84) projection for further analysis. A study Area of Interest (AOI) was built around the Gir Sanctuary boundary and co-registered with sub-pixel accuracy for accurate estimation of areas. The geo-coded FCC of Landsat-TM dated 15th May 2009 (Fig. 3) was digitally analyzed. The forest canopy density of the area was prepared
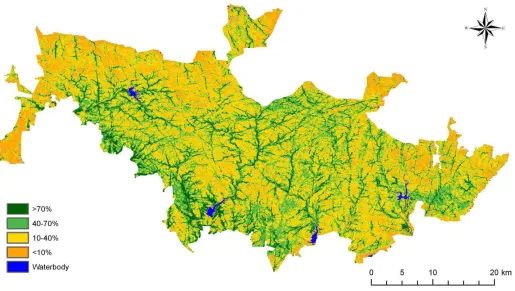
[image:3.612.229.472.369.525.2]through digital analysis of satellite data using Normalized Difference Vegetation Index (NDVI) (Richardson & Wiegand, 1977; Huete, 1988; Crippen, 1990; Weier & Herring, 2000). The NDVI values were grouped into four canopy density classes viz., <10% (non-forest), 10–40% (open), 40–70% (medium) and >70% (dense). Image elements like tone, texture, shape, size, shadow, control location and association were evaluated for this purpose. These data was validated by the ground truthing and expert field experience. NDVI is a method of measuring and mapping the density of green vegetation. For its measurement satellite sensors used that observe the distinct wavelengths of visible and near-infrared sunlight which is absorbed and reflected by the plants, then the ratio of visible and near-infrared light reflected back up to the sensor is calculated. The ratio gives a number from minus one (−1) to plus one (+1). An NDVI value of zero means no green vegetation and close to +1 (0.8–0.9) indicates the highest possible density of green leaves (Weier & Herring, 2000). The ‘normalized difference vegetation index’ is calculated by the formula: NDVI = (IR−R)/ (IR + R), where IR = infrared and R = red. Values for forest canopy density were recorded and specified as categorical variables.
Figure 2 Paradigm of the study.
IV. RESULTSANDDISCUSSION
The present study highlights that extensive field work, sound database was utilized in predicting the forest canopy density of a protected area with acceptable accuracy. Further, the study revealed that GNPS supports diversified wildlife habitats. The forest density of the area is fairly good for biodiversity of GNPS. Result reveled that approximately 9.16 % of forest area is covered by forest canopy density of more than 70%, while 26.73 % with the density class of 40–70 %, 49.96 % with the density class of 10-40% and 13.60 % with the density class of less than 10 % (Table 1). Asiatic lion the endangered and flagship species
of GNPS (Alam, 2011; Meena & Kumar, 2012), and other major prey species preferred to live in open forest habitat. And availability of more than 46.96 percent area as open forest supports the good quantity of habitat for both prey and predators. The high forest density areas are also adequately present to provide shelter and food availability to wild animals in the scares summer periods. GNPS falls in semi-arid zone of Gujarat state in India, is one of the well protected forests, having open and thorn forests that provide favorable resources for the survival and protected safe refuge for the shelter with adequate forest cover, which is the factor supporting the high density of faunal diversity in the GNPS (Meena & Kumar, 2012).
Forest Canopy Density
Geometric Correction
Satellite Data
Digital Image Classification
Figure 3 Landsat-TM, False Color Composite (FCC) of Gir National Park and Sanctuary.
It is suggested that further investigations will be beneficial focusing forest type wise density analysis whilst documenting the entire forest area only. The present analysis supports the significant result of the conservation and management work carried out in the GNPS since last many decades, improved the forest density of GNPS. The present result will be helpful to the managers for considering different conservation zones of priorities for management. There is a change in vegetation density and species composition after 1972 in GNPS due to regeneration and good growth of teak (Tectona grandis) coppice crop. The assessment of forest cover based on visual and digital interpretation of the satellite data, dense forest areas with crown density of 40% and above recorded in Amreli and Junagadh districts were 107 km² and 1028 km², respectively and major part of dense forest in two districts fall in GNPS (Meena & Kumar, 2012). Forest canopy density of GNPS was analyzed in this study using satellite data using geospatial techniques also validate the previous information (Jadav et al., 2002).
Forest canopy density is one of the important parameters in the management of a forest or protected area (Rikimaru et al., 2002). It has been suggested that canopy density is an essential parameter to assess and analyze the factors affecting forest growth, its regeneration and to keep a check on management initiatives in areas of plantations and regeneration status (Chauhan, 2004). The multi-spectral earth observation data with appropriate ground measurements can suitably extrapolate across a large geographic region, and this has significant advantages for forest management, especially in areas where forests are in remote locations or are inaccessible (Blodgett et al. 2000). Also, the geospatial techniques to measure the forest canopy density have been illustrated from different regions using a wide array of spatial and spectral resolutions (Roy et al., 1990& 1996; Rikimaru & Miyatake, 1997; Katul & Albertson, 1998; Harding et al., 2001; Marshall et al., 2002; Singh et al., 2003).
Table 1 Different category of forest canopy density in Gir National Park and Sanctuary.
Category Area in km² Percentage area
< 10% 191.98 13.60
10 - 40% 705.54 49.96
40 - 70% 377.42 26.73
> 70% 129.32 9.16
Waterbody 7.87 0.56
[image:4.612.145.486.621.732.2]Figure 4 Forest canopy density map of GNPS generated using geospatial technique.
Advancement in geospatial technologies provides a medium to evaluate forest cover in the inaccessible and remote areas. This can also enable a multi-scalar assessment of the associated ecosystem parameters (forest canopy density, habitat diversity, etc.). The satellite remote sensing is best suited for analysis of forest canopy density (Roy et al., 1994) whilst modelling the biophysical spectral response for forest density stratification especially in dry deciduous forests.
The approach for measuring forest density is valuable whilst managing fragile and unique ecosystems of a protected area (Prasad et al., 2009). In this direction, the thematic information extracted and further fitted into ecological models would highlight and define the fundamental parameters governing biodiversity viz. fragmentation, disturbance and biological richness (Chauhan, 2004; Prasad, 2006). Moreover, the density stratification provides a baseline study to improvise the existing conservation policies and accordingly prioritizing the conservation needs of an area. Proper management operations that can derive basis from the present analysis can facilitate the forest managers, conservationists and scientists to maintain the diversity as well as density of forest areas.
ACKNOWLEDGMENT
We are thankful to Ministry of Environment & Forests, Government of India for financial support and Gujarat State Forest Department for permission to carry out study. We are
thankful to Department of Wildlife Sciences, Aligarh Muslim University for logistic and institutional support. Field assistants are also acknowledged for helping in the field work.
REFERENCES
[1] Alwyn, H. G.& Calaway, D., (1987). Contribution of non trees to species richness of a tropical rain forest. Biotropica, 19(2), 149–156. doi:10.2307/2388737.
[2] Alam, M.S., (2011). Status, ecology and conservation of striped hyena (Hyaena hyaena) in Gir National Park and Sanctuary, Gujarat. Ph.D. Thesis, Aligarh Muslim University, Aligarh, India.
[3] Bright, L.R., (1984). Assessment of elk habitat for resource management and planning activities from Landsat mapping products. In: Renewable ResourcesManagement. American Society of Photogrammetry and Remote Sensing, Falls Church, Virginia, USA, pp. 101–108.
[4] Blodgett, C., Jakubauskas, M., Price, K., & Martinko, E., (2000). Remote sensing-based geostatistical modelling of forest canopy structure. ASPRS 2000, Annual Conference, Washington, DC, May 22–26.
[5] Champion, H.G. & Seth, S.K., (1968). A revised survey of forest types of India. Manager of Publication, Government of India, New Delhi, India. [6] Chavan, S.A.,(1993). Vegetation and wildlife studies in Gir forests. Ph.D.
Thesis, M.S. University, Baroda, India.
[7] Chauhan, N.,(2004). Mapping, monitoring and modelling of landscape for biodiversity characterization in Baratang Forest Division, Andaman and Nicobar Islands. Ph.D. Thesis, University of Pune and Indian Institute of Remote Sensing, India.
[8] Crippen, R. E. 1990. Calculating the Vegetation Index Faster, Remote Sensing of Environment, vol 34., pp. 71-73.
K.L.N.,Thakker,P.S.,Kandya, A.K.& Kimothi, M.M.,(2002). Baseline mapping of Gir Protected Area. FED, ISRO, SAC-Ahmedabad.
[10] Harding, D., Lefsky, M. A., Parker, G. G., & Blair, B., (2001). Laser altimetry canopy height profiles: Methods and validation for closed-canopy, broadleaved forests. Remote Sensing of Environment, 76, 283–297. [11] Huete, A. R., (1988). A soil-adjusted vegetation index (SAVI). Remote
Sensing of Environment, 25, 53-70.
[12] Jacobs, M.,(1988). The tropical rainforests: A first encounter. Berlin: Springer, 295 pp.
[13] Jadav, R., Sastry, K.L.N., Thakker,P.S., Kandya, A.K.& Kimothi, M.M.,(2002). Baseline mapping of Gir Protected Area. FED, ISRO, SAC-Ahmedabad.
[14] Khan, J.A.,(1993). Ungulate habitat relationship in Gir forest ecosystem and its management implications. Ph.D. Thesis, Aligarh Muslim University, Aligarh, India.
[15] Katul, G. G., & Albertson, J. D., (1998). An investigation of higher order closure models for a forested canopy. Boundary-Layer Meteorology, 89, 47–74.
[16] Kaufman, Y. J. & Tanre, D., (1992). Atmospherically resistant vegetation index (ARVI) for EOS-MODIS, in Proc. IEEE Int. Geosci. and Remote Sensing Symp. 92, IEEE, New York, 261-270.
[17] Kushwaha, S.P.S., Khan, A., Habib, B., Quadri, A.,& Singh, A., (2004). Evaluation of sambar and muntjac habitats using geostatistical modelling. Curr. Sci. 86 (10), 390–1400.
[18] Kushwaha, S.P.S.,(2005). Geospecial technology for forest resources management. International Journal of Ecology and Environemtal Sciences. 31(1):9-20.
[19] Lyon, J.G., (1983). Landsat derived land cover classifications for locating potential kestrel nesting habitat. Photogramm. Eng. Remote Sensing 49, 245–250.Parihar et al. 1986,
[20] Lecis, R.& Norris, K., (2003). Habitat correlates of distribution and local population decline of the endemic Sardinian new Euproctus platycephalus. Biol. Conserv. 115, 303–317. In:
[21] Marshall, B. J., Wood, C. J., Gardiner, B. A., & Belcher, R. E., (2002). Conditional sampling of forest canopy gusts. Boundary-Layer Meteorology, 102, 225–251.
[22] Meena, R.L. & Kumar, S., (2012). Management Plan for Gir Protected Areas. Vol.1. Gujarat Forest Department, Gujarat, India.
[23] Prasad, R. C.,(2006). Phytodiversity assessment of tropical rainforest of North Andaman Islands using remote sensing and GIS. Ph.D. Thesis, Osmania University, and National Remote Sensing Agency (Department of Space, Government of India), India.
[24] Prasad, P.R.C., Nagabhatla, N., Reddy, C. S., Gupta, S., Rajan, K.S., Raza, S.H. and Dutt,C.B.S.,(2009). Assessing forest canopy closure in a geospatial medium to address management concerns for tropical islands— Southeast Asia. Environmental Monitoring and Assessment DOI 10.1007/s10661-008-0717-4. Report No:IIIT/TR/2009/80
[25] Qureshi, Q., & Shah, N.,(2004). Vegetation and habitat monitoring. Page 8-14.In: Jhala, Y.V.,(2004). Monitoring of Gir. Atechnical report submitted to Gujarat Forest Department under DEF-India Ecodevelopment Program, Wildlife Institute of India, Dehradun. RR-04/002.
[26] Richardson, A. J. & Wiegand, C. L., (1977). Distinguishing vegetation from soil background information. Photogrammetric Engineering and Remote Sensing, 43, 1541-1552.
[27] Rikimaru, A., & Miyatake, S., (1997). Development of forest canopy density mapping and monitoring model using indices of vegetation, bare soil and shadow. GIS Development Retrieved 25 February 2008 from http://www.gisdevelopment.net.
[28] Rikimaru, A., Roy, P. S. & Miyatake, S., (2002). Tropical forest cover density mapping 2002. Tropical Ecology, 43(1), 39–47.
[29] Roy, P. S., Diwakar, P. G., Vohra, T. P. S.& Shan, S. K., (1990). Forest resource management using Indian remote sensing satellite data. Asian-Pacific Remote Sensing Journal, 3, 11–22.
[30] Roy, P. S., Diwakar, P. G., Singh, I. J.&Bhan, S. K., (1994). Evaluation of microwave remote sensing data for forest stratification and canopy characterisation. Journal of Indian Society of Remote Sensing (Photonirvachak), 22(1), 31–44.
[31] Roy, P.S., Ravan, S.A., Rajadnya,N., Das, K.K., Jain, A. & Singh, S., (1995). Habitat suitability analysis of Nemorhaedus goral—a remote
sensing and geographic information system approach. Curr. Sci. 69, 685– 691.Alam 2011
[32] Roy, P. S., Miyatake, S.& Rikimaru, A., (1996). Biophysical spectral response modelling approach for forest density stratification. GIS Development. Retrieved 25 February 2008 from http://www.gisdevelopment.net.
[33] Schamberger, M. & Krohn, W.B., (1982). Status of the habitat evaluation procedures. Trans. North Am. Wildl. Nat. Resour. Conf. 47, 154–164.Roy et al., 1994
[34] Sharma, D., Johnsingh, A.J.T. & Mathur, V.B.,(1999). Establishing Geographical Information System Data base for Gir PA. Technical Report, WII, Dehradun. In: Jhala, Y.V.,(2004). Monitoring of Gir. Atechnical report submitted to Gujarat Forest Department under DEF-India Ecodevelopment Program, Wildlife Institute of India, Dehradun. RR-04/002.
[35] Singh, H.S. &Kamboj, R.D., (1996). Bio-diversity Conservation Plan for Gir Vol.-I, Forest Department Gujarat state, India.
[36] Singh, I. J., Das, K. K. & Kushwaha, S. P. S.,(2003). Forest stock assessment using IRS LISS III and PAN merged data in Timli Forest Range, Dehradun. Journal of Indian society of Remote Sensing, 31(1), 49– 56.
[37] US Fish & Wildlife Service, (1981). Standards for the development of habitat suitability models for use in the Habitat Evaluation Procedures. USDIFWS, ESM 103, Washington, DC.Kelly 1987.
[38] Weier, J. & Herring, D., (2000). Measuring Vegetation (NDVI & EVI). Earth Observatory. Retrieved 24th Februry, 2014 from http://earthobservatory.nasa.gov.
AUTHORS
First Author – M. Shamshad Alam, Ph.D., Department of
Wildlife Sciences, Aligarh Muslim University, Aligarh-202002, India. Presently he is working as Regional Planner in BCRLI Project of Gir Learning Centre with Gujarat Forest Department.
Second Author – Jamal A. Khan, Ph.D., is Professor &
Chairman of Department of Wildlife Sciences, Aligarh Muslim University, Aligarh-202002, India.
Third Author – Bharat J. Pathak, M.Sc., IFS., Conservator of
Forests, Gujarat Forest Department, Wildlife Circle, Junagadh-362001, India. Presently he is Director of GEER Foundation, Gandhinagar.
Fourth Author – Sandeep Kumar, Ph.D., IFS., is serving as
Deputy Conservator of Forests, Gujarat Forest Department, Wildlife Division, Sasan-Gir, Junagadh-362135, India.
Correspondence Author – M. Shamshad Alam, Email: