Multiplexed Hydrolysis Probes for Detection and Quantification of
Theileria orientalis
Isolates and Differentiation of Clinically Relevant
Subtypes
D. R. Bogema,a,bA. T. Deutscher,bS. Fell,bD. Collins,bG. J. Eamens,bC. Jenkinsa,b
ithree institute, University of Technology, Sydney, Ultimo, NSW, Australiaa; Elizabeth Macarthur Agricultural Institute, NSW Department of Primary Industries, Menangle, NSW, Australiab
Theileria orientalisis an emerging pathogen of cattle in Asia, Australia, and New Zealand. This organism is a vector-borne he-moprotozoan that causes clinical disease characterized by anemia, abortion, and death, as well as persistent subclinical infec-tions. Molecular methods of diagnosis are preferred due to their sensitivity and utility in differentiating between pathogenic and apathogenic genotypes. Conventional PCR (cPCR) assays forT. orientalisdetection and typing are laborious and do not provide an estimate of parasite load. Current real-time PCR assays cannot differentiate between clinically relevant and benign genotypes or are only semiquantitative without a defined clinical threshold. Here, we developed and validated a hydrolysis probe quantita-tive PCR (qPCR) assay which universally detects and quantifiesT. orientalisand identifies the clinically associated Ikeda and Chitose genotypes (UIC assay). Comparison of the UIC assay results with previously validated universal and genotype-specific cPCR results demonstrated that qPCR detects and differentiatesT. orientaliswith high sensitivity and specificiy. Comparison of quantitative results based on percent parasitemia, determined via blood film analysis and packed cell volume (PCV) revealed significant positive and negative correlations, respectively. One-way analysis of variance (ANOVA) indicated that blood samples from animals with clinical signs of disease contained statistically higher concentrations ofT. orientalisDNA than animals with subclinical infections. We propose clinical thresholds to assist in classifying high-, moderate-, and low-level infections and de-scribe how parasite load and the presence of the Ikeda and Chitose genotypes relate to disease.
T
heileria orientalisis a vector-borne hemoprotozoan that infectscattle and buffalo and is generally spread by ticks of the
Haemaphysalisgenus (1–3). Historically, this organism has been
referred to asTheileria sergenti,Theileria buffeli, or theT.
orienta-lis/T. sergenti/T. buffelicomplex; however, the nameT. sergentiis
now considered invalid (4), andT. orientalisis commonly used to refer to all (5). From a clinical perspective,T. orientaliscan cause anemia, lethargy, jaundice, fever, abortion, and mortality in cattle (6). Clinical infection can also result in decreased milk production in dairy cattle (7).T. orientalisis a conditional pathogen, and while pathogenic forms are largely limited to Eastern Asia and Austral-asia (5,6,8–10), it is frequently detected in asymptomatic animals; these benign forms are globally spread (5,11–14). Analysis of the most common genotyping locus (p32), encoding the variable ma-jor piroplasm surface protein (MPSP), currently identifies 11 dis-tinctT. orientalisgenotypes (13,15,16). Of these genotypes, type 2 (Ikeda) and to a lesser extent type 1 (Chitose) are typically found in association with clinical disease (6,9,10,17–22). The presence of pathogenic and benign forms ofT. orientalisgreatly complicates its clinical diagnosis, with standard blood film analysis unable to identify the pathogenic genotypes.
Multiple conventional PCR (cPCR) assays have been pub-lished for the identification ofT. orientalisin blood samples (9,21,
23,24). The most commonly cited assays detect and genotypeT.
orientalisby amplifying unique regions of the MPSP gene (21).
These assays use two universal primers to detectT. orientalis in-fection and specific forward primers to identify the Ikeda, Chitose, and Buffeli genotypes. While this method is highly sensitive and has been validated in prior studies (19,21), it is not multiplexed
and is highly susceptible to PCR inhibitors (6), which are often found in nucleotide extractions obtained from blood (25,26). To overcome inhibition, undiluted and diluted nucleotide extracts can be examined in parallel to prevent false-negative results (6,19,
27). However, if multiple reactions per sample are required to determine the presence of infection, the procedure becomes both expensive and time-consuming. Furthermore, cPCR does not give an accurate representation of parasite load and therefore cannot provide an indication of the severity ofT. orientalisinfection. A recently developed multiplexed tandem PCR (28) is able to dis-criminate between four genotypes ofT. orientalis, but it is only semiquantitative and therefore cannot be used to define a clinical threshold.
Hydrolysis probe quantitative PCR (qPCR) assays employ se-quence-specific, fluorescently labeled probes attached to
duplex-Received26 November 2014Returned for modification4 January 2015
Accepted7 January 2015
Accepted manuscript posted online14 January 2015
CitationBogema DR, Deutscher AT, Fell S, Collins D, Eamens GJ, Jenkins C. 2015. Development and validation of a quantitative PCR assay using multiplexed hydrolysis probes for detection and quantification ofTheileria orientalisisolates and differentiation of clinically relevant subtypes. J Clin Microbiol 53:941–950. doi:10.1128/JCM.03387-14.
Editor:P. H. Gilligan
Address correspondence to C. Jenkins, [email protected].
Copyright © 2015, American Society for Microbiology. All Rights Reserved.
doi:10.1128/JCM.03387-14
on May 16, 2020 by guest
http://jcm.asm.org/
stabilizing molecules and are frequently used to accurately iden-tify and quaniden-tify genetic sequences within clinical samples (29– 32). These assays can be multiplexed by using multiple sequence-specific probes attached to fluorescent molecules with unique and distinguishable emission spectra (33). While one hydrolysis probe qPCR assay was previously developed forT. orientalisdetection, that assay did not identify genotypes associated with clinical dis-ease (34). In this study, we describe the development and valida-tion of a multiplex hydrolysis probe qPCR which can detectT.
orientalisinfection, quantify parasite load, and identify the two
genotypes associated with clinical disease.
MATERIALS AND METHODS
Samples.Conventional and quantitative PCR analyses were performed on 318 blood samples that were separated into sensitivity and specificity panels. The sensitivity panel comprised 237 samples that were positive for T. orientalisin any of the four cPCR assays used for detection and typing of T. orientalis(19,21). These samples were either derived from animals and/or herds that had clinical cases consistent with theileriosis or from herds that were screened as part of aTheileriasurveillance program. Sam-ples were derived from diverse geographic regions of Australia, including the states of New South Wales, Victoria, Queensland, and Western Aus-tralia. Clinical signs considered consistent with theileriosis were a combi-nation of some or all of the following: lethargy, ataxia, increased respira-tory rate, fever, pale and/or jaundiced mucous membranes, and abortion in pregnant animals. Hematological measures were also considered and comprised anemia, as determined by packed cell volume (PCV) and a blood film positive forTheileriapiroplasms and for erythrocytic changes consistent with regenerative anemia (e.g., nucleated erythrocytes, poikilo-cytosis, polychromasia, and Howell-Jolly bodies).
The specificity panel was composed of 81 samples that were identified asT. orientalisnegative by previous cPCR analysis. Of these samples, 50 were sourced from areas with no history ofT. orientalisoutbreaks at the time of sampling (South Australia) and from cattle without any clinical symptoms ofT. orientalisinfection. A further 31 samples, used for analyt-ical specificity testing, were also free ofT. orientalis(as confirmed by cPCR); however, 25 of these samples were sourced from cattle known to be infected withBabesia bigeminaorBabesia bovis, causative agents of the clinically similar disease tick fever. The remaining 6 samples were derived from cattle immunized with a live vaccine strain ofAnaplasma centrale, which is used for controlling anaplasmosis. All samples were collected in
vacuum blood tubes containing either EDTA (309 samples) or lithium-heparin (9 samples). Blood was decanted into sterile sample tubes and stored at⫺20°C for later extraction.
DNA extraction.Purification of sample DNA was performed using the DNeasy blood and tissue kit (Qiagen, Hilden, Germany) with a 100-l starting volume of blood and a 100-l elution volume. Ten-fold dilutions of template DNA were made in molecular-grade water (Sigma-Aldrich, St. Louis, MO, USA). Negative extraction controls were included at a ratio of at least 1 per 20 DNA extractions as a quality control measure.
Primer and TaqMan probe design.Dual-labeled TaqMan hydrolysis probes were used for the qPCR assay. A triplex qPCR (UIC triplex) was designed that consisted of a quantitative universal (U) assay for the detec-tion allT. orientalistypes and two type-specific semiquantitative assays aimed at differentiating the Ikeda (I) and Chitose (C) genotypes. A single primer set was used for amplification, with the hydrolysis probes confer-ring specificity in each channel of the assay. This assay design was chosen to avoid interactions between primer sets and allow for accurate quanti-fication in the universal component of the assay. The forward primer was designed to target a highly conserved sequence within the 3=end of the MPSP gene, while the reverse primer was similar to the TsR primer de-signed and validated in prior studies (19,21). Each probe was 5=labeled with a fluorophore (6-carboxyfluorescine [FAM], VIC, and NED for the U, I, and C components, respectively) and 3=labeled with a nonfluores-cent quencher (NFQ). All probes contained an MGB moiety to confer additional probe specificity and were purchased from Life Technologies (Carlsbad, CA, USA). All primer and probe sequences are listed inTable 1. Anin silicoanalysis was performed on all primers and probes via compar-ison with existing sequence data in GenBank. TheT. orientalisU probe was designed as a 100% match for⬎95% of all availableT. orientalisMPSP gene sequences. Similarly, the I and C probes were designed to maximize detection of their respective subtypes. In the case of the Chitose probe, a degenerate design was used to account for a polymorphism present in some of the Chitose sequences (Table 1).
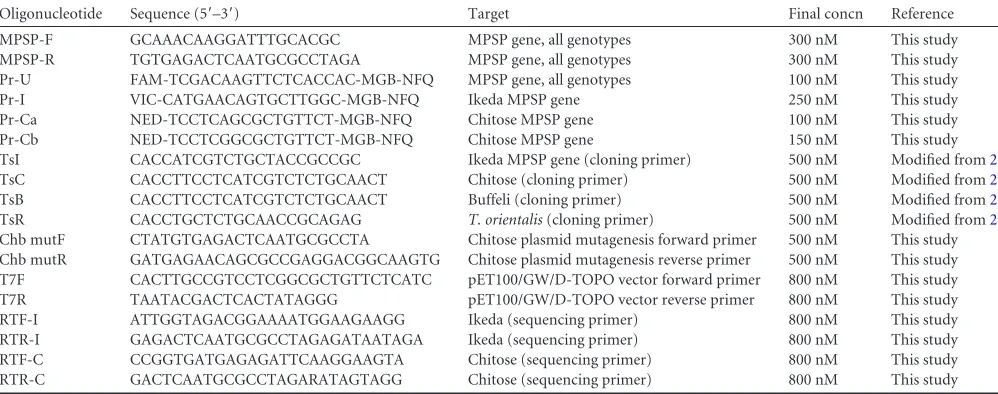
[image:2.585.41.540.78.275.2]cPCR.cPCR analysis was performed on all samples used in the study to provide a benchmark for comparison of the qPCR assay. cPCR is con-sidered a gold standard forT. orientalisdetection and differentiation. The cPCR assay used in this study detected⬎50% of blood smear-negative animals (19) and has been validated in prior studies (21,27). The speci-ficity of the cPCR has also been independently verified in our laboratory via DNA sequencing of PCR products from each genotype assay (unpub-lished data). The cPCR was performed as 6 separate assays (one each for universal [p32] and the Ikeda and Chitose genotypes on both undiluted TABLE 1Oligonucleotides used in this study
Oligonucleotide Sequence (5=–3=) Target Final concn Reference
MPSP-F GCAAACAAGGATTTGCACGC MPSP gene, all genotypes 300 nM This study
MPSP-R TGTGAGACTCAATGCGCCTAGA MPSP gene, all genotypes 300 nM This study
Pr-U FAM-TCGACAAGTTCTCACCAC-MGB-NFQ MPSP gene, all genotypes 100 nM This study
Pr-I VIC-CATGAACAGTGCTTGGC-MGB-NFQ Ikeda MPSP gene 250 nM This study
Pr-Ca NED-TCCTCAGCGCTGTTCT-MGB-NFQ Chitose MPSP gene 100 nM This study
Pr-Cb NED-TCCTCGGCGCTGTTCT-MGB-NFQ Chitose MPSP gene 150 nM This study
TsI CACCATCGTCTGCTACCGCCGC Ikeda MPSP gene (cloning primer) 500 nM Modified from21
TsC CACCTTCCTCATCGTCTCTGCAACT Chitose (cloning primer) 500 nM Modified from21
TsB CACCTTCCTCATCGTCTCTGCAACT Buffeli (cloning primer) 500 nM Modified from21
TsR CACCTGCTCTGCAACCGCAGAG T. orientalis(cloning primer) 500 nM Modified from21
Chb mutF CTATGTGAGACTCAATGCGCCTA Chitose plasmid mutagenesis forward primer 500 nM This study
Chb mutR GATGAGAACAGCGCCGAGGACGGCAAGTG Chitose plasmid mutagenesis reverse primer 500 nM This study
T7F CACTTGCCGTCCTCGGCGCTGTTCTCATC pET100/GW/D-TOPO vector forward primer 800 nM This study
T7R TAATACGACTCACTATAGGG pET100/GW/D-TOPO vector reverse primer 800 nM This study
RTF-I ATTGGTAGACGGAAAATGGAAGAAGG Ikeda (sequencing primer) 800 nM This study
RTR-I GAGACTCAATGCGCCTAGAGATAATAGA Ikeda (sequencing primer) 800 nM This study
RTF-C CCGGTGATGAGAGATTCAAGGAAGTA Chitose (sequencing primer) 800 nM This study
RTR-C GACTCAATGCGCCTAGARATAGTAGG Chitose (sequencing primer) 800 nM This study
on May 16, 2020 by guest
http://jcm.asm.org/
and 10-fold dilutions of DNA extracts). A Buffeli-specific cPCR was also performed to account for samples that were positive in the p32 assay but negative in the Ikeda and Chitose assays. All cPCRs were performed as previously described (27), except that GelRed (Biotium, Hayward, CA, USA) was used as a DNA stain in place of ethidium bromide due to its improved biosafety and sensitivity characteristics.
Generation of plasmid standards.Plasmid DNA standards were gen-erated by PCR from blood samples sourced from New South Wales and Queensland known to contain the Ikeda, Chitose, and Buffeli genotypes (GenBank accession numbersKM624619toKM624621). Type-specific forward primers and a universal reverse primer targeting the MPSP genes of each genotype (Table 1) (21) were modified to facilitate cloning into the pET100/GW/D-TOPO vector (Life Technologies). MPSP gene PCR products were cloned, as described previously, intoEscherichia coliTOP10 cells (35). To account for the Chitose polymorphism mentioned above, a plasmid standard variant (Chitose B) was generated by site-directed mu-tagenesis of the original Chitose plasmid (Chitose A), as described in reference36and using mutagenic primers (Table 1). Plasmids were ex-tracted from transformant colonies with the QIAprep Spin miniprep kit (Qiagen). All plasmids were examined with conventional dye terminator sequencing to confirm correct sequences using T7 forward and reverse primers (Table 1). Plasmid DNA was quantified by spectrophotometry at 260 and 280 nm. Plasmid standards were prepared as serial 10-fold dilu-tions in (1:250) tRNA fromSaccharomyces cerevisiae(Sigma-Aldrich).
qPCRs.All qPCRs were performed in parallel with cPCR analyses using the same nucleotide extracts. UIC multiplex qPCRs were prepared by combining TaqMan Environmental MasterMix 2.0 (final concentra-tion, 1⫻; Life Technologies) with primers and probes described inTable 1. Reagent mixes were aliquoted into MicroAmp Fast Optical 96-well reaction plates (catalog number 4346906; Life Technologies), and 2l of extracted DNA sample was added, to yield a total volume of 20l. Plates were subsequently sealed with optical adhesive covers (catalog number 4360954; Life Technologies). Thermal cycling was performed in a 7500 Fast real-time PCR system (Life Technologies) with an initial holding stage of 95°C for 10 min followed by a cycling stage (95°C for 15 s and then 60°C for 1 min) for 45 cycles.
Probe specificity was tested using purified single and pairwise combi-nations of the different plasmid standards (Ikeda, Chitose A and B, and Buffeli plasmids). Buffeli plasmid was included in the standards to ensure that the universal component of the assay efficiently detected this preva-lent (albeit benign) genotype. To test for equivapreva-lent quantification of all targets in the U component of the assay, single and pairwise combinations of 10-fold serial dilutions of the different plasmid standards ranging from 3⫻101to 3⫻107MPSP gene copies/l (GC/l) were tested.
Equimolar and unequal pairwise combinations (10- to 1,000-fold dif-ferences in concentration) of the plasmids were used to determine whether the I and C assays were efficient at detecting the dominant geno-type in a given template mix. These assays were performed in triplicate.
The limit of detection (LOD) was defined as the limit where 95% of qPCRs were successful (37), and it was experimentally estimated by test-ing 8 replicates of an equimolar mixture of Ikeda, Chitose (A and B), and Buffeli plasmid DNA at dilutions of 15,000, 1,500, 150, 50, 15, 5, 1.5, and 0.5 MPSP GC/l against each probe in uniplex and multiplex, followed by probit analysis.
Potential PCR inhibition from blood components was tested during UIC assay development (using a cocktail containing 900 nM primers and 250 nM U probe) by testing both undiluted and 10-fold-diluted DNA extracts from the samples in the specificity panel (n⫽237). In addition, PCR inhibition in the final UIC assay was tested in a 10-fold dilution series of Ikeda, Chitose (A and B), and Buffeli plasmids (1.5⫻101to 1.5⫻107 MPSP GC/l) spiked into a pool of 10Theileria-negative DNA extracts. The negative extracts were derived from EDTA blood samples from cattle located in areas whereTheileriawas not enzootic (i.e., negative samples from the specificity panel) and that were further confirmed to beT. ori-entalisnegative by both cPCR and qPCR.
Data analysis.Data were collected and analyzed using the Life Tech-nologies 7500 software v2.3. Threshold cycle (CT) values were determined by calculating the cycle number when fluorescence reached a⌬Rn (i.e., fluorescence of the reporter dye relative to that of a passive reference dye) of 0.1. The universal component of the UIC assay was quantified by com-parison to a standard curve generated from a 10-fold dilution series rang-ing from 1.5⫻101to 1.5⫻107MPSP GC/l of an equimolar mix of Ikeda, Chitose (50% Chitose A and 50% Chitose B), and Buffeli plasmids. Quality acceptance parameters for each of the standard curves were anR2 value of⬎0.98 and an amplification efficiency between 90 and 110%. Nucleic acid concentrations used for analytical and diagnostic statistics (MPSP GC/l) were obtained using plasmid molecular masses, calculated from plasmid sequences as previously described (38). McNemar’s test was used to determine whether there was a significant difference in the pro-portion of positives between the two tests between pairs of treatments (cPCR versus qPCR). Discrepant results were resolved via Sanger se-quencing at the Australian Genome Research Facility (AGRF) by using the relevant sequencing primers detailed inTable 1. Confidence intervals (CIs) for the sensitivity and specificity were calculated using the Clopper-Pearson method (39). The values for GC/l and GC/l packed erythro-cytes (PE) were used for correlations with parasitemia and the PCV. GC/l PE values were calculated to account for variable erythrocyte con-centrations (i.e., calculated from the GC/l by multiplying it by the nu-cleotide extraction volume [100l]/PCV). Correlations were examined using Spearman’s method; two-tailedPvalues are listed in the Results section.
Comparison with clinical data.To determine whether there was a significantly higher concentration of parasite DNA in clinically affected animals, samples were divided into four groups based on their individual case histories and herd status: (i) subclinical animals from herds without clinical cases; (ii) clinically affected individuals; (iii) recovering animals; (iv) in-contact animals. Animals were considered subclinical (n⫽55) if they were positive via cPCR but belonged to herds that did not display any cases consistent with clinical theileriosis at the time of sampling (e.g., surveillance samples). Animals were considered clinically affected (n⫽ 110) if they displayed a combination of symptoms consistent with theile-riosis at the time of sampling (anemia, jaundice, depression, ataxia, leth-argy tachypnoea, tachycardia, pyrexia, or late-term abortion) and tested positive forT. orientalis in cPCR. Cases with potentially confounding diagnoses were excluded from this group. Recovering animals (n⫽25) were those that had symptoms consistent with theileriosis in the preced-ing weeks but had recovered at the time of samplpreced-ing and were positive in cPCR. Many of these animals also had evidence of regenerative anemia on blood smears, indicating prior illness. In-contact animals (n⫽24) were cohorts of clinically affected animals at the time of sampling that were not displaying obvious symptoms of disease themselves. MPSP allele concen-trations (GC/l) for each group were compared using one-way analysis of variance (ANOVA), a Kruskal-Wallis test, and Dunn’s multiple compar-ison posttest within Prism 4.0 (GraphPad Software, La Jolla, CA, USA).
RESULTS
Analytical sensitivity and specificity.The linear dynamic range and analytical sensitivity statistics were determined in multiplex and uniplex for each probe used in the UIC qPCR assay. The linearity of each standard curve from reactions performed in uni-plex and multiuni-plex is demonstrated inFig. 1A. For the U probe, a linear range is observed between 3.0⫻101and 9.0⫻107MPSP
GC/l in both uniplex and multiplex. Similarly, the I and C com-ponents of the UIC assay exhibited a linear range between 1.5⫻ 101and 1.5⫻107MPSP GC/l in both uniplex and multiplex. All linear ranges were observed with a coefficient of determination greater than 99.5% (Table 2). Detection of single and pairwise combinations of the Ikeda, Chitose (A and B), and Buffeli plas-mids within the universal (quantitative) component of the UIC
on May 16, 2020 by guest
http://jcm.asm.org/
assay was linear over the previously defined linear range (R2for
each combination ranged from 0.997 to 0.999) (Fig. 1B). Further-more, the means of each plasmid combination at each serial dilu-tion were detected within a coefficient of variadilu-tion (CV) of⬍20%, which is consistent with existing PCR assays that are considered quantitative (40,41). The specificity of each probe for its target was confirmed using plasmids containing Ikeda, Chitose (A and B), and Buffeli MPSP gene sequences (data not shown). In addition, 31 samples collected from cattle cPCR negative forT.
orientalisthat were infected with eitherAnaplasma centrale,
Babe-sia bigemina, orBabesia boviswere all negative in the UIC assay
(Table 3).
The LOD for each assay was defined as the point where 95% of replicate assays were positive, and the LODs were determined for each probe in uniplex and when run in the UIC multiplex format. LODs were shown to be of the same order of magnitude when the assay was run in uniplex or multiplex (Table 2).
Diagnostic sensitivity and specificity.The use of qPCR for the detection of infection requires the identification of a diagnostic threshold for the delineation of animals which are positive or neg-ative for the presence of the organism. To identify this threshold, the sensitivity and specificity of the U component of the UIC qPCR assay was examined against potential diagnostic thresholds. A diagnostic threshold above the calculated LOD (Table 2) was selected that maximized both sensitivity and specificity of the U probe. From this analysis, a diagnostic threshold of 30 MPSP GC/l was selected.
Next, 237 samples determined via cPCR to beT. orientalis in-fected were analyzed, and of these, 233 returned a positive result with the U component of the UIC qPCR assay (Table 3). Samples were considered qPCR positive if the concentration calculated from the U component was above the diagnostic threshold of 30 MPSP GC/l. To rigorously test the detection limits of the qPCR assays used in this study, we examined samples that were weakly positive in the cPCR. Twenty-nine samples with very faint bands in cPCR were also identified as positive in qPCR (⬍1,000 MPSP GC/l), demonstrating that the UIC qPCR compares very well with the corresponding cPCR assays at low concentrations. An overall sensitivity of 98.3% was observed for the detection ofT.
orientalisinfection, and the specificity was 100.0%. No significant
difference in the proportion of positives between the two tests was identified between the UIC qPCR assay andT. orientalisinfection status as determined by cPCR using McNemar’s test (Table 3). While the sensitivity of the U probe was very high, a small number
ofT. orientalis-infected samples (n⫽4) did not test positive in the
UIC qPCR assay (Table 3) but were weakly positive (faint bands observed) in the p32 cPCR. Of these four samples, three demon-strated detectable amplification in the UIC qPCR but fell below the diagnostic threshold. DNA sequencing indicated that two of these three samples were of the Buffeli genotype and the remain-ing sample was of the Chitose genotype. The fourth sample was negative upon retest in the p32 cPCR. Conversely, two samples included in theT. orientalis-infected group, which were detected as cPCR positive for Chitose and Buffeli but were negative when
means. (B) Means and ranges of the U component from triplicate UIC assays performed on serial dilutions of all possible combinations of Ikeda, Chitose, and Buffeli plasmids (ICB, IC, IB, CB, I, C, and B).R2values for each
combi-nation ranged from 0.997 to 0.999. FIG 1The U component of the UIC assay is quantitative. (A) Linear dynamic
range for the hydrolysis probe qPCR, produced from four replicate assays using U (top), I (middle), and C (bottom) probes. All qPCRs were performed using an equimolar mixture of Ikeda, Chitose (A and B), and Buffeli plasmids. Data from qPCRs performed in multiplex (⫻) and in uniplex (o) are com-pared. Lines of best fit for multiplex and uniplex data are shown as solid and broken lines, respectively. Error bars represent standard deviations from
on May 16, 2020 by guest
http://jcm.asm.org/
[image:4.585.60.269.60.656.2]tested with the p32 cPCR, were positive when tested with the U component of the UIC qPCR assay. Both of these samples subse-quently yielded positive results in the p32 cPCR assay upon retest-ing, and both samples were confirmed to be genuine Chitose and Buffeli positives upon DNA sequencing.
Subtype differentiation.To detect the presence ofT. orientalis
genotypes associated with clinical disease, two probes were in-cluded in the UIC assay to detect the Ikeda and Chitose genotypes. A diagnostic threshold of 30 GC/l was similarly selected for the I and C components of the UIC assay, as this was above the limits of detection (Table 2) and maximized the sensitivity and specificity of these components. In preliminary experiments with plasmid, detection of the I and C genotypes was found to be nearly identical for equimolar mixtures of template. In the case of unequal con-centrations of template, the dominant genotype was detected in all cases (data not shown). The minor (nondomimant) genotype was detected in the majority of reaction mixtures in which the domi-nant type was up to 3 orders of magnitude higher in concentration than the minor genotype (data not shown). The abilities of the I and C assays to detect each genotype were then assessed against the genotype-specific cPCRs by using the 237T. orientalis-infected blood samples from the sensitivity and specificity panels. Of the 181 samples that tested positive for the Ikeda type in cPCR, 180 were Ikeda positive in qPCR. The remaining sample yielded an amplicon in the I component of the UIC assay but fell below the diagnostic threshold and was therefore scored as negative. The UIC assay detected a further two samples that tested Ikeda nega-tive in the cPCR. These samples were later confirmed as genuine positives by DNA sequencing. The overall sensitivity of the I com-ponent of the UIC assay was 99.4%, and the specificity was 96.4%
(Table 4). A total of 144/237 samples were positive when tested
with the Chitose type-specific cPCR, and of these 129 were posi-tive with the C component of the UIC qPCR assay, giving a sensi-tivity of 89.6%. The samples testing Chitose negative in the qPCR but positive in the cPCR were all from samples with mixed infec-tions containing extremely high levels of the Ikeda genotype, sug-gesting that competition for reagents was a factor in the lower sensitivity of the C component of the UIC assay. Despite this, the C component of the UIC assay detected a further 7 positives that tested negative in the Chitose-specific cPCR, yielding a specificity
of 92.6% (Table 4). These 7 samples were later confirmed to be genuine positives via DNA sequencing. Although the number of Chitose-positive samples detected by the UIC was lower overall, there was no statistical difference in the number of samples testing positive in cPCR (n⫽144) versus qPCR (n⫽136) (P⬍0.05).
Investigation of potential PCR inhibition.Previous studies identified that neat DNA extracts and 10-fold dilutions of sam-ple must be run in parallel when performing theT. orientalis
[image:5.585.42.547.77.142.2]cPCR assays to account for PCR-inhibiting contaminants present within nucleic acid extracts prepared from blood (6,19,27). To overcome this, we used a DNA polymerase master mix that has been demonstrated to be effective at reducing contaminant-based inhibition (TaqMan environmental master mix) (42). We as-sessed the efficacy of this master mix in reducing or eliminating the effects of PCR inhibition during development of the UIC as-say. No additional positive reactors were detected when 10-fold-diluted extracts of the 237 samples from the sensitivity panel were examined in the UIC assay. Evidence of inhibition in the cPCR assays (i.e., no or significantly less PCR product observed in un-diluted extracts compared to levels in the 10-fold dilutions) was observed in 10 of the 237 extracts from the specificity panel. All 10 cPCR-inhibited samples were positive in both undiluted and 10-fold-diluted extracts when tested with the UIC assay. Further-more, a higher MPSP allele concentration was observed in the quantitative U component of the UIC assay for all undiluted ex-tracts compared to their respective 10-fold dilutions. To further examine whether PCR inhibition had an effect on assay quantifi-cation, we prepared serially diluted plasmid DNA containing the Ikeda, Chitose, and Buffeli alleles and spiked these into nucleic acid extracts of samples from regions whereT. orientaliswas not enzootic and that were also confirmed negative by both cPCR and qPCR. Plasmids were serially diluted 10-fold to concentrations spanning 1.5⫻101to 1.5⫻107MPSP GC/l. In all experiments, the qPCR-predicted concentrations were comparable to those de-termined by spectrophotometry (data not shown). Together, these data indicate that PCR inhibition is not significant for this assay. Nonetheless, it is recommended that a positive control, or a negative control spiked with plasmid DNA, be included in each DNA extraction run, along with a negative-control sample as a batch control measure.
TABLE 2Analytical sensitivity of U, I, and C assays run in multiplex and uniplex
Parameter
U I C
Multiplex Uniplex Multiplex Uniplex Multiplex Uniplex
R2 0.999 0.999 0.998 0.995 0.998 0.998
% efficiency (95% CI) 95.0 (93.7–96.4) 95.4 (94.1–96.8) 95.2 (92.8–97.8) 96.7 (93.0–100.7) 100.0 (97.5–102.7) 97.1 (95.5–99.5)
LOD (GC/l) (95% CI) 17 (8–45) 28 (14–60) 27 (8–90) 16 (6–46) 20 (6–65) 16 (7–38)
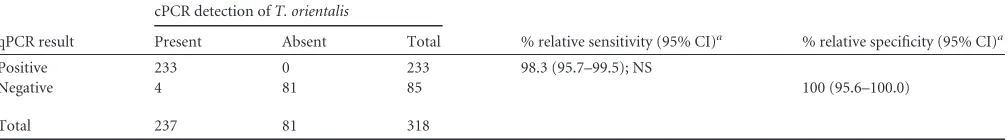
TABLE 3Contingency tables and descriptive statistics comparing detection ofT. orientalisinfection using the UIC qPCR assay with infection status determined by the 6 cPCR assays (Universal, Ikeda, and Chitose at two dilutions)
qPCR result
cPCR detection ofT. orientalis
% relative sensitivity (95% CI)a % relative specificity (95% CI)a
Present Absent Total
Positive 233 0 233 98.3 (95.7–99.5); NS
Negative 4 81 85 100 (95.6–100.0)
Total 237 81 318
aThe statistical significance (at aPlevel of⬍0.05) is also reported. NS, not significant.
on May 16, 2020 by guest
http://jcm.asm.org/
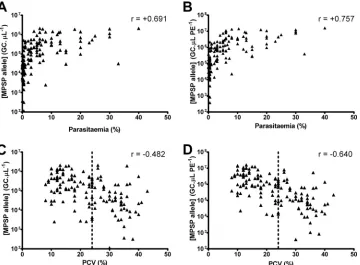
[image:5.585.42.546.645.715.2]Correlation with parasitemia and PCV.Of the 237 samples from the specificity panel, 135 had corresponding data for the PCV and parasitemia, and these were used for comparative analyses with the total MPSP allele concentration determined by the U component of the UIC qPCR (Fig. 2). Because blood films were scored as the percentage of erythrocytes containing piroplasms (percent parasitemia), a correction factor (de-scribed in Materials and Methods) was also applied to the qPCR data to account for variable erythrocyte levels, yielding an erythrocyte-independent measure, the number of gene cop-ies perl of packed erythrocytes (GC/l PE). Strong and sig-nificant positive correlations (P⬍0.0001) were observed be-tween MPSP allele concentrations (in GC/l and GC/l PE) and the percent parasitemia (Fig. 2AandB). A moderate neg-ative correlation (r⫽ ⫺0.482,P⬍0.0001) was observed when MPSP allele concentrations expressed in the erythrocyte con-centration-dependent measure (GC/l) were compared with PCV values (Fig. 2C). This correlation was stronger when MPSP allele concentrations were corrected for erythrocyte concentration (r⫽ ⫺0.640,P⬍0.0001) (Fig. 2D).
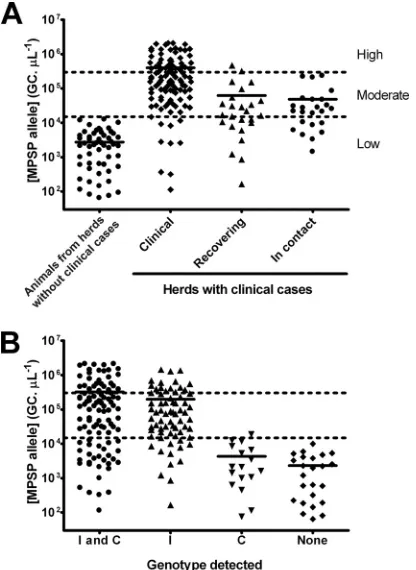
Determination of a clinical threshold.As total MPSP allele concentration strongly correlates with parasitemia and PCV, we investigated whether the UIC qPCR could be used to define a clinical threshold forT. orientalisinfection. Samples from the sensitivity panel were divided into four groups based on the over-all clinical presentation of the donor animals as well as herd status
(Fig. 3A). One-way ANOVA demonstrated that animals that were
[image:6.585.41.538.78.131.2]clinically affected at the time of sampling (n⫽110) had signifi-cantly higher mean MPSP allele concentrations (GC/l) than re-covering (n⫽25) or in-contact (n⫽24) animals from herds with clinical cases, as well as subclinical (butTheileria-positive) ani-mals from herds without clinical cases (n⫽55) (P⬍0.001). In addition, recovering and in-contact animals displayed signifi-cantly higher MPSP allele concentrations than the subclinical an-imals from the herds without clinical cases (P⬍0.001). Recover-ing and in-contact animals from herds with clinical cases did not have statistically different MPSP allele concentrations (P⬎0.05). Based on these data, we propose three groups ofT. orientalis in-fection severity, as determined in the UIC qPCR. The first group contains high-levelT. orientalisinfection strongly associated with
TABLE 4Comparison of UIC multiplex qPCR and type-specific cPCR for the detection ofT. orientalissubtype
Type
No. with qPCR/cPCR results
% relative sensitivity (95% CI) % relative specificity (95% CI)
Statistical differencea
⫹/⫹ ⫹/⫺ ⫺/⫹ ⫺/⫺
Ikeda 180 2 1 54 99.4 (96.6–100.0) 96.4 (87.9–99.6) NS
Chitose 129 7 15 86 89.6 (83.4–94.1) 92.6 (85.3–97.0) NS
aThe statistical significance (at aPlevel of⬍0.05) is reported. NS, not significant.
FIG 2MPSP allele concentrations determined by the UIC assay correlate with blood film analysis and PCV. (A and B) Correlation of the MPSP allele concentration (calculated from the U component of the UIC qPCR multiplex) expressed in measures dependent on (A) or independent of (B) erythrocyte concentration with parasitemia, as determined by blood film examination. (C and D) Correlation of MPSP allele concentration (calculated from the U component of the UIC qPCR multiplex), expressed in measures dependent on (C) or independent of (D) erythrocyte concentration with PCV. Anemia corresponds to a PCV of⬍24% and is represented by the vertical dotted lines.
on May 16, 2020 by guest
http://jcm.asm.org/
[image:6.585.115.475.407.672.2]clinical signs of disease and corresponding to GC/l levels of⬎3.0
⫻105(Fig. 3). The second group consists of samples from animals
with a moderate levelT. orientalisinfection corresponding to a GC/l of⬎1.5⫻104but ⱕ3.0⫻105. Samples from the third group were defined by a low level ofT. orientalisDNA correspond-ing to GC/l levels ofⱕ1.5⫻104. Using these thresholds, 100% of animals (n⫽55) from herds without clinical cases were classified into the low-level infection group. In contrast, 91% (100/110) of animals that displayed clinical symptoms at the time of sampling were within the moderate- to high-level ranges. Above the upper threshold of 3⫻105MPSP GC/l (high-level infection), 95% of
animals (42/44) were clinically affected. In addition, the majority of animals (23/25) that were recovering from clinical theileriosis fell within the low and moderate ranges, while all in-contact ani-mals (n⫽24) fell within the low and moderate ranges.
Associations of Ikeda and Chitose genotypes with parasite load.The relationships between the presence of the Ikeda and Chitose genotypes and MPSP allele concentration were examined by scoring each sample positive in each of the three channels of the UIC assay (Fig. 3B). The samples that tested positive in the
U assay only (n⫽24) were all identified as Buffeli positives in the cPCR assay. Animals harboring the Ikeda type only (n⫽
69) or the Ikeda type in combination with the Chitose type (n⫽
103) had significantly higher MPSP allele concentrations than animals that were Chitose-only positive or samples in which no pathogenic genotype was detected (P ⬍ 0.001). The mean MPSP allele concentrations of the C-only and U-only positive samples were not significantly different (P⬎0.05). Similarly, the mean allele concentrations of the I- and IC-positive sam-ples were not statistically different (P⬎0.05). These data sug-gest that the Ikeda genotype in particular is associated with higher overall parasite loads. Indeed, 100% of samples col-lected from clinically affected and recovering animals exam-ined in this study were found to be I-only positive or both I and C positive. Semiquantitative data from the I and C assays indi-cated thatT. orientalisIkeda was the dominant genotype in 58% of mixed Ikeda-Chitose infections. Of animals that tested C posi-tive only (n⫽18), 16 were from subclinical herds, while the re-maining 2 samples were derived from in-contact animals within clinically affected herds.
DISCUSSION
Bovine theileriosis caused byT. orientalisis a serious problem for cattle producers in Eastern Asia and is an emerging disease in Australia and New Zealand, causing significant losses to meat and milk production (6,7). Disease outbreaks have been closely asso-ciated with the Ikeda type ofT. orientalisand to a lesser extent the Chitose type (6,10,18). The ubiquity of benignT. orientalis geno-types, which are morphologically and serologically indistinguish-able from the clinically associated types (19,27), necessitates the use of molecular tests for clinical diagnosis of bovine theileriosis. Furthermore, due to the high prevalence of subclinical carriers of
T. orientalisIkeda and Chitose, a quantitative test that can provide
an accurate estimate of parasite load is essential.
The multiplex qPCR assay developed and validated in this study represents the first quantitative assay forT. orientalis detec-tion that incorporates a clinical genotyping component. While real-time assays that detectT. orientalishave been developed, most have focused on species-level detection (not discrimination of ge-notypes) (34), discrimination of differentTheileriaspp. (43,44), or are only semiquantitative (28). The UIC multiplex qPCR assay developed here was both sensitive and specific forT. orientalis
detection compared to cPCR and reliably identified the clinically relevant Ikeda and Chitose genotypes. Furthermore, the UIC assay was more specific and had near-identical sensitivity to that re-ported for a recently published multiplexed tandem PCR assay (28). The U component of the UIC multiplex targets highly con-served regions of the MPSP gene in order to account for the geno-typic diversity withinT. orientalis(11 types observed currently) (13,15,16). Therefore, the U component allows for additional flexibility in detecting any genotypes not typically associated with disease or for which the clinical relevance has not been fully estab-lished (45).
Quantitative PCR has previously been used to determine par-asite load within clinical blood samples (34,46). In this study, we observed a strong and significant correlation between MPSP allele concentration and parasitemia (as determined by blood film), demonstrating the utility of the U component of the UIC assay in quantifying parasite load. While the correlation between total MPSP allele concentration and PCV was also significant, it was not
FIG 3(A) Association of MPSP allele concentration with clinical data allows the delineation of clinical thresholds. MPSP allele concentrations (calculated from the U component of the UIC qPCR multiplex) were separated into 4 clinical groups: subclinical animals from herds without clinical cases (i.e., herds with no clinical cases of theileriosis but situated in areas whereT. orien-talisis enzootic), animals with clinical symptoms consistent with theileriosis at time of sampling (clinical), animals that had exhibited clinical symptoms prior to sampling (recovering), and animals in contact with theileriosis-affected animals but not exhibiting clinical symptoms at time of sampling (in contact). Clinical thresholds are shown as dotted lines. (B) Association of MPSP allele concentration with clinical genotype detected. MPSP allele concentrations (calculated from the U component of the UIC qPCR multiplex) were separated into 4 groups based on genotype, detected by the I and C components. Clinical thresholds are shown as dotted lines.
on May 16, 2020 by guest
http://jcm.asm.org/
[image:7.585.61.269.67.352.2]as strong as the correlation observed between total MPSP allele concentration and parasitemia. This observation could be due to the cyclical nature of apicomplexan infections, which can recru-desce periodically (46, 47). Furthermore, a lag period between peak parasitemia and minimum PCV has been observed in prior studies of bothBabesiaandTheileriaspecies (46, 47). In field-based studies ofT. orientalisinfection, we have observed that par-asitemia can peak up to 8 days before cattle become anemic and up to 15 days before minimum PCV is reached (unpublished obser-vations).
In this study, we present the first comprehensive comparison of MPSP allele concentration and genotype with clinical data from
T. orientalis-positive animals. Indeed, the quantitative data
de-rived from the UIC assay were found to be strongly associated with individual clinical presentation and herd status, enabling the es-tablishment of clinical thresholds for the assay. MPSP allele con-centrations of ⬎1.5 ⫻ 104 GC/l (moderate infection) were
strongly associated with clinical theileriosis at the herd level and within individuals. Furthermore, 95% of animals with MPSP al-lele concentrations in excess of 3⫻105(high-level infection) dis-played symptoms of clinical theileriosis. In contrast, 100% of sub-clinical animals from herds without sub-clinical cases had MPSP allele concentrations below 1.5 ⫻ 104 (low-level infection). These
thresholds can be applied as a guide in the differential diagnosis of theileriosis caused byT. orientalis, in addition to information de-rived from the genotyping components of the UIC assay. Based on the samples tested, there was strong evidence for the association of the Ikeda genotype, alone or in combination with the Chitose genotype, with clinical disease (100% of clinical cases examined). Where the Chitose genotype occurred as a sole infection, it was most often associated with herds having only subclinical cases. These findings are consistent with prior cPCR studies (6,18) in-vestigating the association of MPSP genotypes with clinical cases in New South Wales, Australia. Nonetheless, other studies con-ducted elsewhere have implicated the Chitose genotype as a direct cause of disease (10,22); therefore, the role of this genotype in clinical cases, in the presence or absence of the Ikeda genotype, warrants further investigation.
Due to the persistent nature of infection,T. orientalisIkeda or Ikeda/Chitose genotypes are frequently detected at low or mod-erate levels in convalescent animals. Similarly,T. orientaliscan be detected at low or moderate levels in clinically normal animals that have recently become infected through contact with clinically diseased animals. The UIC assay accurately quantifies parasite load and also detects clinically associated genotypes, which allows for the detection of potential early stage clinical infections. In these instances, knowledge of herd infection status and history is critical, and monitoring of these animals and their cohorts (in-cluding follow-up qPCR testing) is warranted in the event that clinical signs develop. Previously, repeat cPCR testing of herds whereT. orientalishad already been detected was considered un-rewarding due to the long-term nature of infection (19); however, the additional information provided by qPCR may be useful for monitoring parasite loads within at-risk animals, particularly given that stress is a known factor in disease recrudescence.
In summary, the UIC qPCR assay presented here exploits hydrolysis probe (TaqMan) chemistry, enabling detection of multiple products in a single well, thereby circumventing labo-rious processes involved in running multiple screening and genotyping PCR assays. In addition, the assay can be adapted to
any platform allowing multiple fluorophore-based detection. As a genuine multiplex assay, the UIC qPCR can be applied to high-throughput clinical testing, enabling hundreds of UIC as-says to be performed in a single day. The UIC qPCR also offers a considerable advantage over other available assays which re-quire dilution of DNA extracts to overcome PCR inhibition (6,
9,27,28). Indeed, the number of assays required per sample to achieve a result is reduced from six, via cPCR detection, to just a single assay with the UIC qPCR. This represents a consider-able (approximately 75%) reduction in turnaround time. The UIC assay is also cost-effective, at an estimated A$10 to A$15 per sample, including standards and batch controls, depending on the number of samples per run (i.e., within a range of 10 to 80 samples). Inclusion of a non-MGB probe-based internal control in the red spectrum may be feasible with additional optimization; however, the inclusion of a positive extraction control is a cost-effective alternative in batches ofⱖ4 samples. Finally, the quantitative data from the U assay, combined with those from the IC genotyping assays, provide veterinarians with a powerful tool for clinical diagnosis of bovine theileriosis caused by
T. orientalisthat can inform herd management.
ACKNOWLEDGMENTS
This work was funded by Meat and Livestock Australia (project B.AHE.0213) and by the McGarvie Smith Trust.
We are particularly grateful to Philip Carter of the Tick Fever Centre (Wacol, Queensland, Australia) for providing samples for analytical spec-ificity testing. We acknowledge Jocelyn Gonsalves and Brendon O’Rourke for contributing to the early phases of assay development. We are also grateful to the various private and district veterinarians who submitted samples forTheileriatesting, some as part of theileriosis surveillance pro-grams.
REFERENCES
1.Fujisaki K, Kawazu S, Kamio T. 1994. The taxonomy of the bovine Theileriaspp. Parasitol Today10:31–33.http://dx.doi.org/10.1016/0169 -4758(94)90355-7.
2.Kamio T, Ito Y, Fujisaki K, Minami T.1990. Infection rates ofTheileria sergentiinHaemaphysalis longicornisticks collected from the field in Ja-pan. Jpn J Vet Sci52:43– 48.http://dx.doi.org/10.1292/jvms1939.52.43. 3.Higuchi S.1986. The development ofTheileriasergentiin the salivary
glands of the tick,Hemaphysalis longicornis. Jpn J Vet Sci48:801– 807. http://dx.doi.org/10.1292/jvms1939.48.801.
4.Uilenberg G.2011.Theileria sergenti. Vet Parasitol175:386 –386.http: //dx.doi.org/10.1016/j.vetpar.2010.09.029.
5.Sivakumar T, Hayashida K, Sugimoto C, Yokoyama N.2014. Evolution and genetic diversity ofTheileria. Infect Genet Evol27:250 –263.http://dx .doi.org/10.1016/j.meegid.2014.07.013.
6.Eamens GJ, Gonsalves JR, Jenkins C, Collins D, Bailey G.2013. Thei-leria orientalisMPSP types in Australian cattle herds associated with out-breaks of clinical disease and their association with clinical pathology find-ings. Vet Parasitol191:209 –217.http://dx.doi.org/10.1016/j.vetpar.2012 .09.007.
7.Perera PK, Gasser RB, Firestone SM, Anderson GA, Malmo J, Davis G, Beggs DS, Jabbar A.2014. Oriental theileriosis in dairy cows causes a significant milk production loss. Parasit Vectors7:73.http://dx.doi.org/10 .1186/1756-3305-7-73.
8.Kang SW, Lien TKN, Noh J H, Reddy KE, Kweon CH, Choe SE.2012. Phylogenetic analysis of benignTheileriaspecies based on major piro-plasm surface protein (MPSP) genes from ticks of grazing cattle in Korea. Vet Parasitol 189:145–152. http://dx.doi.org/10.1016/j.vetpar.2012.04 .038.
9.Ota N, Mizuno D, Kuboki N, Igarashi I, Nakamura Y, Yamashina H, Hanzaike T, Fujii K, Onoe S, Hata H, Kondo S, Matsui S, Koga M, Matsumoto K, Inokuma H, Yokoyama N.2009. Epidemiological survey ofTheileria orientalis infection in grazing cattle in the eastern part of
on May 16, 2020 by guest
http://jcm.asm.org/
Hokkaido, Japan. J Vet Med Sci71:937–944.http://dx.doi.org/10.1292 /jvms.71.937.
10. McFadden AMJ, Rawdon TG, Meyer J, Makin J, Morley CM, Clough RR, Tham K, Mullner P, Geysen D.2011. An outbreak of haemolytic anaemia associated with infection ofTheileria orientalisin naive cattle. N Z Vet J59:79 – 85.http://dx.doi.org/10.1080/00480169.2011.552857. 11. Kakuda T, Shiki M, Kubota S, Sugimoto C, Brown WC, Kosum C,
Nopporn S, Onuma M.1998. Phylogeny of benignTheileriaspecies from cattle in Thailand, China and the U.S.A. based on the major piroplasm surface protein and small subunit ribosomal RNA genes. Int J Parasitol 28:1261–1267.http://dx.doi.org/10.1016/S0020-7519(98)00113-1. 12. Sivakumar T, Yoshinari T, Igarashi I, Kothalawala H, Abeyratne SAE,
Vimalakumar SC, Meewewa AS, Kuleswarakumar K, Chandrasiri ADN, Yokoyama N.2013. Genetic diversity withinTheileria orientalisparasites detected in Sri Lankan cattle. Ticks Tick Borne Dis4:235–241.http://dx .doi.org/10.1016/j.ttbdis.2012.11.009.
13. Jeong W, Yoon SH, An DJ, Cho SH, Lee KK, Kim JY.2010. A molecular phylogeny of the benignTheileriaparasites based on major piroplasm surface protein (MPSP) gene sequences. Parasitology137:241–249.http: //dx.doi.org/10.1017/S0031182009991090.
14. Wang CT, Kubota S, Kakuda T, Kuo CC, Hsu TL, Onuma M.1998. Survey ofTheileriaparasite infection in cattle in Taiwan. J Vet Med Sci 60:253–255.http://dx.doi.org/10.1292/jvms.60.253.
15. Kim SJ, Tsuji M, Kubota S, Wei Q, Lee JM, Ishihara C, Onuma M.1998. Sequence analysis of the major piroplasm surface protein gene of benign bovineTheileriaparasites in East Asia. Int J Parasitol28:1219 –1227.http: //dx.doi.org/10.1016/S0020-7519(98)00095-2.
16. Khukhuu A, Dinh TBL, Long PT, Ueno A, Li Y, Luo YZ, de Macedo ACC, Matsumoto K, Inokuma H, Kawazu SI, Igarashi I, Xuan XN, Yokoyama N.2011. Molecular epidemiological survey ofTheileria orien-talisin Thua Thien Hue Province, Vietnam. J Vet Med Sci73:701–705. http://dx.doi.org/10.1292/jvms.10-0472.
17. Kakuda T, Kubota S, Sugimoto C, Baek BK, Yin H, Onuma M.1998. Analysis of immunodominant piroplasm surface protein genes of benign Theileriaparasites distributed in China and Korea by allele-specific poly-merase chain reaction. J Vet Med Sci60:237–239.http://dx.doi.org/10 .1292/jvms.60.237.
18. Kamau J, de Vos AJ, Playford M, Salim B, Kinyanjui P, Sugimoto C. 2011. Emergence of new types ofTheileria orientalisin Australian cattle and possible cause of theileriosis outbreaks. Parasit Vectors4:22.http://dx .doi.org/10.1186/1756-3305-4-22.
19. Eamens GJ, Bailey G, Jenkins C, Gonsalves JR.2013. Significance of Theileria orientalistypes in individual affected beef herds in New South Wales based on clinical, smear and PCR findings. Vet Parasitol196:96 – 105.http://dx.doi.org/10.1016/j.vetpar.2012.12.059.
20. Yokoyama N, Sivakumar T, Ota N, Igarashi I, Nakamura Y, Yamashina H, Matsui S, Fukumoto N, Hata H, Kondo S, Oshiro M, Zakimi S, Kuroda Y, Kojima N, Matsumoto K, Inokuma H.2012. Genetic diver-sity ofTheileria orientalisin tick vectors detected in Hokkaido and Oki-nawa, Japan. Infect Genet Evol12:1669 –1675.http://dx.doi.org/10.1016 /j.meegid.2012.07.007.
21. Zakimi S, Kim J Y, Oshiro M, Hayashida K, Fujisaki K, Sugimoto C. 2006. Genetic diversity of benignTheileriaparasites of cattle in the Oki-nawa prefecture. J Vet Med Sci68:1335–1338.http://dx.doi.org/10.1292 /jvms.68.1335.
22. Islam MK, Jabbar A, Campbell BE, Cantacessi C, Gasser RB. 2011. Bovine theileriosis: an emerging problem in south-eastern Australia? In-fect Genet Evol11:2095–2097.http://dx.doi.org/10.1016/j.meegid.2011 .08.012.
23. Cufos N, Jabbar A, de Carvalho LM, Gasser RB.2012. Mutation scan-ning-based analysis ofTheileria orientalispopulations in cattle following an outbreak. Electrophoresis 33:2036 –2040. http://dx.doi.org/10.1002 /elps.201200082.
24. Tanaka M, Onoe S, Matsuba T, Katayama S, Yamanaka M, Yonemichi H, Hiramatsu K, Baek BK, Sugimoto C, Onuma M.1993. Detection of Theileriasergentiinfection in cattle by polymerase chain reaction amplifi-cation of parasite specific DNA. J Clin Microbiol31:2565–2569. 25. Al-Soud WA, Radstrom P.2001. Purification and characterization of
PCR-inhibitory components in blood cells. J Clin Microbiol39:485– 493. http://dx.doi.org/10.1128/JCM.39.2.485-493.2001.
26. Al-Soud WA, Jonsson LJ, Radstrom P.2000. Identification and charac-terization of immunoglobulin G in blood as a major inhibitor of diagnos-tic PCR. J Clin Microbiol38:345–350.
27. Eamens GJ, Bailey G, Gonsalves JR, Jenkins C.2013. Distribution and temporal prevalence ofTheileria orientalismajor piroplasm surface pro-tein types in eastern Australian cattle herds. Aust Vet J91:332–340.http: //dx.doi.org/10.1111/avj.12078.
28. Perera PK, Gasser RB, Firestone SM, Smith L, Roeber F, Jabbar A.2015. Semiquantitative multiplexed tandem PCR for detection and differentia-tion of fourTheileria orientalisgenotypes in cattle. J Clin Microbiol53:79 – 87.http://dx.doi.org/10.1128/JCM.02536-14.
29. Maaroufi Y, Heymans C, De Bruyne JM, Duchateau V, Rodriguez-Villalobos H, Aoun M, Crokaert F.2003. Rapid detection ofCandida albicansin clinical blood samples by using a TaqMan-based PCR assay. J Clin Microbiol41:3293–3298.http://dx.doi.org/10.1128/JCM.41.7.3293 -3298.2003.
30. Nwakanma DC, Gomez-Escobar N, Walther M, Crozier S, Dubovsky F, Malkin E, Locke E, Conway DJ.2009. Quantitative detection of Plasmo-dium falciparumDNA in saliva, blood, and urine. J Infect Dis199:1567– 1574.http://dx.doi.org/10.1086/598856.
31. Plain KM, Marsh IB, Waldron AM, Galea F, Whittington AM, Saunders VF, Begg DJ, de Silva K, Purdie AC, Whittington RJ. 2014. High-throughput direct fecal PCR assay for detection ofMycobacterium avium subsp.paratuberculosisin sheep and cattle. J Clin Microbiol52:745–757. http://dx.doi.org/10.1128/JCM.03233-13.
32. Kim C, Iseki H, Herbas MS, Yokoyama N, Suzuki H, Xuan X, Fujisaki K, Igarashi K.2007. Development of TaqMan-based real-time PCR assays for diagnostic detection ofBabesia bovisandBabesia bigemina. Am J Trop Med Hyg77:837– 841.
33. Veron V, Simon S, Carme B.2009. Multiplex real-time PCR detection of P. falciparum,P. vivaxandP. malariaein human blood samples. Exp Parasitol121:346 –351.http://dx.doi.org/10.1106/j.exppara.2008.12.012. 34. Jeong W, Kweon CH, Kang SW, Paik SG.2003. Diagnosis and
quanti-fication ofTheileria sergentiusing TaqMan PCR. Vet Parasitol111:287– 295.http://dx.doi.org/10.1016/S0304-4017(02)00388-6.
35. Deutscher AT, Jenkins C, Minion FC, Seymour LM, Padula MP, Dixon NE, Walker MJ, Djordjevic SP.2010. Repeat regions R1 and R2 in the P97 paralogue Mhp271 ofMycoplasma hyopneumoniaebind heparin, fi-bronectin and porcine cilia. Mol Microbiol78:444 – 458.http://dx.doi.org /10.1111/j.1365-2958.2010.07345.x.
36. Fisher CL, Pei GK.1997. Modification of a PCR-based site-directed mutagenesis method. Biotechniques23:570 –571.
37. Bustin SA, Benes V, Garson JA, Hellemans J, Huggett J, Kubista M, Mueller R, Nolan T, Pfaffl MW, Shipley GL, Vandesompele J, Wittwer CT.2009. The MIQE guidelines: minimum information for publication of quantitative real-time PCR experiments. Clin Chem55:611– 622.http: //dx.doi.org/10.1373/clinchem.2008.112797.
38. Stothard P.2000. The sequence manipulation suite: JavaScript programs for analyzing and formatting protein and DNA sequences. Biotechniques 28:1102–1104.
39. Clopper CJ, Pearson ES.1934. The use of confidence or fiducial limits illustrated in the case of the binomial. Biometrika26:404 – 413.http://dx .doi.org/10.1093/biomet/26.4.404.
40. Armbruster DA, Pry T.2008. Limit of blank, limit of detection and limit of quantitation. Clin Biochem Rev29(Suppl 1):S49 –S52.
41. Buh Gasparic M, Cankar K, Zel J, Gruden K.2008. Comparison of different real-time PCR chemistries and their suitability for detection and quantification of genetically modified organisms. BMC Biotechnol8:26. http://dx.doi.org/10.1186/1472-6750-8-26.
42. Cao Y, Griffith JF, Dorevitch S, Weisberg SB.2012. Effectiveness of qPCR permutations, internal controls and dilution as means for minimiz-ing the impact of inhibition while measurminimiz-ing Enterococcus in environ-mental waters. J Appl Microbiol113:66 –75.http://dx.doi.org/10.1111/j .1365-2672.2012.05305.x.
43. Chaisi ME, Janssens ME, Vermeiren L, Oosthuizen MC, Collins NE, Geysen D.2013. Evaluation of a real-time PCR test for the detection and discrimination ofTheileriaspecies in the African buffalo (Syncerus caffer). PLoS One 8:e75827. http://dx.doi.org/10.1371/journal.pone .0075827.
44. Yang Y, Mao Y, Kelly P, Yang Z, Luan L, Zhang J, Li J, El-Mahallawy HS, Wang C.2014. A pan-TheileriaFRET-qPCR survey forTheileriaspp. in ruminants from nine provinces of China. Parasit Vectors7:413.http: //dx.doi.org/10.1186/1756-3305-7-413.
on May 16, 2020 by guest
http://jcm.asm.org/
45. Aparna M, Ravindran R, Vimalkumar MB, Lakshmanan B, Rameshkumar P, Kumar KGA, Promod K, Ajithkumar S, Ravishankar C, Devada K, Subrama-nian H, George AJ, Ghosh S.2011. Molecular characterization ofTheileria orientaliscausing fatal infection in crossbred adult bovines of South India. Parasitol Int60:524 –529.http://dx.doi.org/10.1016/j.parint.2011.08.002. 46. Ros-Garcia A, Nicolas A, Garcia-Perez AL, Juste RA, Hurtado A.2012.
Development and evaluation of a real-time PCR assay for the quantitative detection ofTheileria annulatain cattle. Parasit Vectors5:171.http://dx .doi.org/10.1186/1756-3305-5-171.
47. Sasaki M, Fujii Y, Iwamoto M, Ikadai H.2013. Effect of sex steroids on Babesia microtiinfection in mice. Am J Trop Med Hyg88:367–375.http: //dx.doi.org/10.4269/ajtmh.2012.12-0338.