International Journal of Emerging Technology and Advanced Engineering
Website: www.ijetae.com (ISSN 2250-2459, ISO 9001:2008 Certified Journal, Volume 2, Issue 12, December 2012)
84
Noise Dispersion Modelling in Small Urban Areas with
CUSTIC 3.2 Software
Marija Hadzi-Nikolova
1, Dejan Mirakovski
2, Todor Delipetrov
3, Pance Arsov
4 1Assistant, 2Assistant Professor, 3Full Professor, Faculty of Natural and Technical Sciences, University “Goce Delcev” Stip, Macedonia
4 Head of Sector for Control, Agency of Financial Support of Agriculture and Rural Development, Skopje, Macedonia
Abstract- Noise pollution is genuine threat to human health and the quality of life and presents one of serious factors that local agencies and state authorities have to consider in development planning. Noise dispersion modeling can be helpful in the planning and decision making processes for reducing the noise pollution. Noise dispersion models are used to assess and monitor the influence of the noise effects and for land-use planning as one of the method of effective and economic noise
control. In this paper Noise dispersion model has been
developed using the possibilities of low costs CUSTIC 3.2, Noise Pollution Modelling Software, produced by the Spanish company Canarina, and according to noise level measurements in the central part of Stip, in Eastern Macedonia that is typical, and thus representative, of most smaller urban areas in this region.
Keywords - CUSTIC, Noise, Model, Modelling, Software.
I. INTRODUCTION
Noise, as a major risk factor affecting the environment, has been an area of concern and research subject for considerable length of time, especially in major urban commercial and residential areas where the levels of noise exposure are high and the problem is already visible. The effects of rapid urbanization and rising standard of living, especially in smaller communities have created a major problem affecting their central residential, public and commercial areas.
Noise pollution, both in large and small urban areas is regarded as a growing problem of communities. There are various factors that contribute to increase of noise levels. One of main factors is increasing urban population, which contributes to higher traffic volume and intensity. In most urban areas, the corridors are developed in a close proximity to residential areas, due to limited space thus increase the number of high rise buildings. Numerous countries have implemented new technologies to control noise pollution in urban areas.
For example, low noise generating engines, changes in quality of tyres, changes in road material. These technologies have proven to reduce the noise on individual scale. However, the overall noise pollution in urban areas is still increasing because of increasing traffic volume.
The Green Paper estimates that, in terms of the number of people affected by noise, 20% of the population (i.e., 120 million people) suffers from unacceptable noise levels that cause sleep disturbance, annoyance and adverse health effects [3]. An additional 170 million citizens in Europe live in areas where noise levels cause serious annoyance during the daytime. In financial terms, environmental noise costs society an estimated 0.2% to 2% of the Gross Domestic Product. Even the lower of these figures represents an immense cost.
Noise Dispersion Models (NDM) simulates outdoor sound propagation and predicts noise levels from known noise sources for close and distant locations.
Commercially available NDM software’s are usually cumbersome, data dependent (a lot of input data not readily available), expensive and only extensively trained users can utilize them.
Completely opposite, CUSTIC 3.2 is simple to use, low cost software solution which certainly does not have all possibilities and precision of standard NDM solutions, but can be used as indicative toll for basic modeling purposes. Example of CUSTIC 3.2 application in noise dispersion modeling in small urban areas is discussed below.
II. CUSTIC 3.2NOISE POLLUTION MODELLING SOFTWARE
International Journal of Emerging Technology and Advanced Engineering
Website: www.ijetae.com (ISSN 2250-2459, ISO 9001:2008 Certified Journal, Volume 2, Issue 12, December 2012)
85 It must be noted that only approximate values are obtained, since the noise dispersion is a complex physical
phenomenon (that involves turbulences, non-linear
dynamics and thermodynamics of irreversible processes) that the simulations software must represent with simple equation.
The basis of this mathematical model is linear sound propagation equation, which is used to model simple point source emissions from vehicles, industries, aircrafts…
CUSTIC model calculates attenuation due to noise source enclosures and other noise control measures, the distance from the source to the receiver, the noise source size, type and directivity, barriers and natural topographical features and sound absorption in the air.
Excess attenuation from ground absorption effects such as those due to vegetation, bare ground or hard surfaces are derived using the most recently available scientific theories. Weather conditions such as wind speed and direction, relative humidity and the vertical temperature gradient of the atmosphere are also accounted for.
The CUSTIC 3.2 Software accepts meteorological data records to define the conditions for sound propagation. The model estimates the noise level for each source/receptor combination and calculates user-selected averages.
This software allows for creation of robust and useful numerical simulations that fully make use of the graphical user interface.
[image:2.612.325.561.136.394.2]Fig. 1 presents the input and output data of the CUSTIC 3.2 software.
FIGURE 1. INPUT AND OUTPUT DATA OF THE SOFTWARE
As shown on the figure above input data include: type of source (point, line ore area), ambient (climate) data, grid size and scale. Based on data entered the software calculates noise levels and presents those levels in form of iso-lines, numerical grid or color gradient.
International Journal of Emerging Technology and Advanced Engineering
Website: www.ijetae.com (ISSN 2250-2459, ISO 9001:2008 Certified Journal, Volume 2, Issue 12, December 2012)
[image:3.612.66.272.135.386.2]86 FIGURE 2. AMBIENT DATA
[image:3.612.338.551.136.352.2]If the source size is small compared with the size of the area included in simulation, that source presents point source. Point source data entry window is shown on figure below (Fig. 3).
FIGURE 3. POINT SOURCE DATA
[image:3.612.63.274.442.656.2]Traffic roads presents line noise source. If road traffic noise level data are available, then we can easily enter them through the window shown below (Fig.4).
FIGURE 4. LINE SOURCE DATA
Also with very simple and convenient tool, road traffic noise levels can be estimated through average vehicle velocity and vehicles number data (Fig.5).
In our specific case, road traffic noise levels are
estimated with following assumptions; maximum
permissible speed of vehicles 40 km/h and average
number of vehicles per hour 1000.
[image:3.612.344.546.450.682.2]International Journal of Emerging Technology and Advanced Engineering
Website: www.ijetae.com (ISSN 2250-2459, ISO 9001:2008 Certified Journal, Volume 2, Issue 12, December 2012)
87 In order to increase model precision, spot noise level measurements were performed in the vicinity of the buildings at the most exposed facade. All data from the measurements were entered in the model as s point sources.
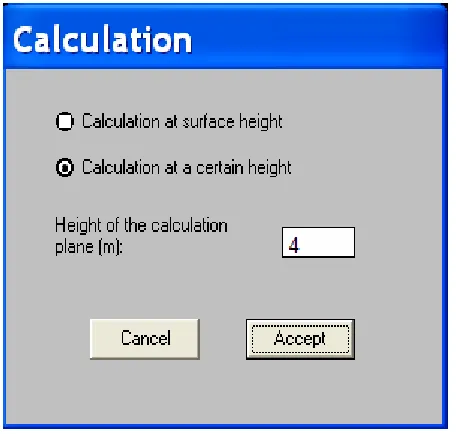
[image:4.612.55.283.209.426.2]Calculations of noise dispersion was performed at 4 meters height from the surface (Fig.6).
FIGURE 6. SOFTWARE CORRECTION OF THE DATA OF EQUIVALENT HEIGHT OF 4 M
[image:4.612.325.564.413.575.2]As two different models (Classical CUSTIC model and ISO- 9613) are included in the software, through the option Calculation Models (Fig.7) user can select which calculation method will be used. The ISO calculation is mostly used for point sources considering humidity, temperature and the solid angle for the source. In the case of roads, only angle solid effects will be considered when the ISO option is activated.
FIGURE 7.CALCULATION MODELS
III. ROLE OF GISFOR NOISE DISPERSION MODEL
Through a simple GIS set of tools CUTIC 3.2 allows for storing and retrieving, transforming and displaying spatial data from the real world for particular set purposes. A cataloguing and metadata management system of GIS could be used to track data manipulation at each stage of process. These include: changes in input data, data simplification, interpolation methods, calculation methods, calculation settings, other factors, which could influence the accuracy of results. Also GIS facilitates the visual presentation of the noise effects and an additional tool for analyzing the results. Proper integration of GIS with noise prediction models provides fast and accurate assessment of the environmental impact of noise.
Noise contours generated with interpolation techniques available are presented through included GIS tools, thus making possible to generate a continuous spatial model of noise levels within software windows.
IV. NOISE DISPERSION MODEL OF STIP
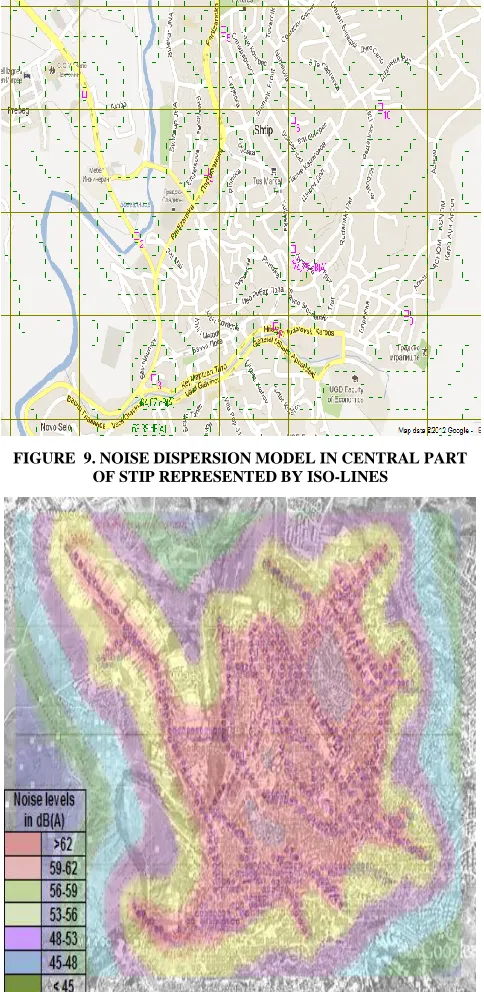
Fig.8 presents central part of Stip for which we have developed noise level dispersion modeling, using CUSTIC 3.2.
FIGURE 8.SATELLITE IMAGE ON THE CENTRAL PART OF
STIP
Based on estimated and measured data for different point and line sources within the Stip City Center, this software generated noise levels model which can be presented in form of iso-lines, numerical grid or color gradient.
[image:4.612.47.289.553.704.2]International Journal of Emerging Technology and Advanced Engineering
Website: www.ijetae.com (ISSN 2250-2459, ISO 9001:2008 Certified Journal, Volume 2, Issue 12, December 2012)
[image:5.612.48.292.123.365.2]88 FIGURE 9. NOISE DISPERSION MODEL IN CENTRAL PART
OF STIP REPRESENTED BY ISO-LINES
FIGURE 10. NOISE DISPERSION MODEL IN CENTRAL PART OF STIP REPRESENTED BY COLOUR GRADIENT
V. CONCLUSION
CUSTIC 3.2 Noise Pollution Modeling Software can be used to model different types of noise, such as industrial noise, traffic noise and aircraft noise. It provides a range of prediction algorithms easily selected and applied by the user.
In the same time CUSTIC 3.2 is low cost and simple tool that allows fast and easy simulation of the process of noise pollution, this making him ideal for day to day usage.
This modeling toll can be with easy used for indications of areas affected by noise, determining the number of sensitive buildings, new project development decisions and so on. Although not so sophisticated this indicative toll can point to the problems in early stages and determine need of further analyses and protection measures, thus saving time and labor.
REFERENCES
[1] Burrough, P.A. 1986. Principles of Geographic Information System for LandResource Assessment,. Oxford Clarendon Press, London. [2] CUSTIC 3.2 Noise Pollution Modeling Software, Manuel, 2004.
Canarina Algorithos Numericos, S.L.
[3] Environmental Noise, Booklet, 2000. Bruel & Kjaer.
[4] Lawrence, K.W., Norman, C.P., Yung-Tce Hung 2005. Advanced Air and Noise Pollution Control, Humana Press Inc. Totowa, New Jersey.
[5] Mirakovski, D., Hadzi-Nikolova, M., Ristovic, I., Despodov, Z., Panov, Z. 2011. Modeling of Noise Impact Assessment on the Aggregate Surface Mines, Integrated International Symposium TIORIR`11, Zlatibor, Republic of Serbia.
[image:5.612.48.290.143.639.2]