INTRODUCTION
Despite rapid advancements in both pharmacological and in-terventional treatment options, coronary heart disease re-mains the most common cause of death in Europe, accounting for 1.8 million deaths each year.1 Investigation of new
thera-pies to improve left ventricular (LV) function and clinical out-comes after acute myocardial infarction (AMI) is actively ongo-ing. Experimental studies have been performed to investigate whether bone marrow cells (BMCs) transplantation post AMI could regenerate or repair damaged heart and vessels.2,3 The safety and feasibility of cell therapy has been established by a great many of studies using unselected bone marrow mono-nuclear cells (BMMC), progenitor cells, stem cells, or other mo-bilized cells.4-6 However, the clinical outcomes of each indi-vidual study have remained in controversy. Some studies have found positive effects for BMC therapy in the recovery of glob-al and regionglob-al LV function. Others identified no favorable ef-fects in a BMC group when compared with controls.
The conflicting results among trials may in part be explained by differences in patient selection, routes of cell administration, cell types, timing of cell infusion, dose of cells injection, and imaging modalities used in the evaluation of the treatment effect. Received: December 1, 2017 Revised: February 25, 2018
Accepted: March 14, 2018
Corresponding author: Wenxia Zong, MD, PhD, Department of Cardiovascular Medicine, The Third People’s Hospital of Hubei Province, No. 26 Zhongshan Road, Qiaokou District, Wuhan City, Hubei 430033, China.
Tel: 86-027-8374570, Fax: 86-027-83745674, E-mail: [email protected]
•The authors have no financial conflicts of interest.
© Copyright: Yonsei University College of Medicine 2018
This is an Open Access article distributed under the terms of the Creative Com-mons Attribution Non-Commercial License (http://creativecomCom-mons.org/licenses/ by-nc/4.0) which permits unrestricted non-commercial use, distribution, and repro-duction in any medium, provided the original work is properly cited.
Bone Marrow Mononuclear Cells Transfer for Patients
after ST-Elevated Myocardial Infarction:
A Meta-Analysis of Randomized Control Trials
Jingyi Zhang, Li Lin, and Wenxia Zong
Department of Cardiovascular Medicine, The Third People’s Hospital of Hubei Province, Hubei, China.
Purpose: Results on the clinical utility of cell therapy for ST-elevated myocardial infarction (STEMI) are controversial. This study sought to analyze the efficacy of treatment with intracoronary bone marrow mononuclear cells (BMMC) on left ventricular (LV) function and remodeling and LV diastolic and systolic function in patients with STEMI.
Materials and Methods: Literature search of PubMed and EMBASE databases between 2004 and 2017 was performed for ran-domized controlled trials in STEMI patients who underwent successful percutaneous coronary intervention and received intra-coronary BMMC therapy. The defined end points were left ventricular ejection fraction (LVEF), left ventricular end-diastolic vol-ume (LVEDV), and left ventricular end-systolic volvol-ume (LVESV). Also, sensitivity analysis and several subgroup analyses based on follow-up duration, timing of injection, doses of cells, and imaging modalities were conducted to strengthen the statistic pow-er of the study.
Results: A total of 22 trials with 1360 patients were available for the current meta-analysis. The pooled statistics showed a signifi-cant improvement in LVEF {2.58 [95% confidence interval (CI), 1.32, 3.84]; p<0.001}, LVEDV [-3.73, (95% CI, -6.94, -0.52), p=0.02], and LVESV [-4.67, (95% CI, -7.07, -2.28), p<0.001] in the BMMC group, compared with the control group. However, in sensitivity analysis, a significant reduction in LVEDV disappeared, while the outcomes of LVEF and LVESV remained unchanged. The same results were presented in the subgroup analysis adjusting for imaging modalities and timing of cells injection.
Conclusion: BMMC transplantation in patients with STEMI was found to lead to improvement in LVEF, LVEDV, and LVESV pa-rameters, indicating that cell therapy has a potential beneficial effect on LV remodeling and function.
Key Words: ST elevation myocardial infarction, stroke volume, bone marrow transplantation, left ventricular dysfunction pISSN: 0513-5796 · eISSN: 1976-2437
To overcome the limitations of individual studies and increase statistical power, several meta-analyses have been performed.7-9 A meta-analysis in 2012 demonstrated that intracoronary BMCs therapy after AMI had a modest, but significant, improvement in left ventricular ejection fraction (LVEF) at 6 months after treatment (2.87%). Similar trends for LV end systolic volume (LVESV) and LV end diastolic volumes (LVEDV) were also concluded. Another meta-analysis in 2014 also showed mod-est increases in LVEF for the overall period (2.10%) and a re-duction in LVESV. In contrast, a recent meta-analysis in 2015, selected individual patient data from 12 randomized clinical trials, and reported no beneficial effect at 1-year follow-up in LVEF, LVEDV, or LVESV. Taken together, these studies suggest that there remains a discrepancy in regards to the improve-ment of LV function.10 Furthermore, long-term follow-up data on LV diastolic function and LV systolic function are also im-portant for further evaluation of safety and for more compre-hensive understanding of the process of repairing and remod-eling after AMI and BMCs therapy.
Accordingly, the current meta-analysis involved a large amount of studies focusing solely on patients with ST-elevated myocar-dial infarction (STEMI) treated with intracoronary infusion of BMMC after percutaneous coronary intervention (PCI) aiming to assess LV diastolic function and LV systolic function after cell therapy.
MATERIALS AND METHODS
Information sources and search strategy
To identify relevant trials for our analysis, the electronic data-bases PudMed and EMBASE were searched with the follow-ing terms: bone marrow mononuclear cells, bone marrow cells, BMC, myocardial infarction, acute myocardial infarction, ST-elevation myocardial infarction, AMI, STEMI, cell therapy, ran-domized control trials, and all possible combinations. The in-cluded studies were limited to English and human experiments trials. Furthermore, reference lists of identified articles, re-cently published editorials, and reviews on the topic for further eligible trials were also hand searched by reviewers for addi-tional studies. No duplicated data were used in this analysis. Inclusion and exclusion criteria
The inclusion criteria were as follows: 1) randomized con-trolled trials (RCTs) comparing patients treated with BMMC and control therapy; 2) selected patients with STEMI; 3) pa-tients under successful PCI before cell transplantation; 4) in-cluded proper outcomes of LVEF, LVEDV, and LVEDV; and 5) no other restrictions in terms of time, doses, or number of times of cell infusion.
The exclusion criteria were 1) nonhuman studies, 2) non-RCTs, 3) duplicated reports, 4) transplanted cells were not BMMC or circulating/ peripherals progenitor cells were
mo-bilized by granulocyte colony stimulating factor from bone marrows, 5) lack of control group, and 6) no available data. Data extraction and quality assessment
Data abstraction and analysis was performed by two different researchers independently and reported on standardized forms, including the first author, year of publication, patient population characteristics, study design (blinded or unblinded), injection time of cell therapy post STEMI, timing between cell aspira-tion and injecaspira-tion, type and dose of cells transplanted, measur-ing modality, follow-up duration, infracted territory, treatment option for control patients and cardiac parameters of LVEF, LVEDV, and LVESV. The mean changes in LVEF, LVEDV, and LVESV were taken as our primary endpoints. Data on cardiac parameters measured by echocardiography (ECHO), mag-netic resonance imaging (MRI), LV angiography, and single photon emission computed tomography (SPECT) were con-sidered equivalent. When two or more modalities were used and data were available, MRI data or ECHO data was prefer-entially used. Additional subgroup analyses were performed within the clinical trials investigating BMMC therapy in an at-tempt to gain more insight into possible discriminating param-eters or differential conditions that might improve clinical out-comes in future experiments.
Subgroup analyses performed included 1) follow-up dura-tion of 4 months, 6 months, 12 months, and 18 to 48 months; 2) different imaging modalities that were used to measure LVEF, LVEDV, and LVESV parameters; 3) BMMC injection time after STEMI onset symptom (within 24 hours, 2 to 14 days, and >14 days); and 4) doses of cells administrated (<10 millions, 10–100 millions, and >100 millions).
Data analysis
analyses were performed using RevMan 5.3 analysis software (The Nordic Cochrane Centre, The Cochrane Collaboration, Copenhagen, Denmark).
RESULTS
Search results
The search identified 934 potential publications, and we
[image:3.595.56.554.196.347.2]fur-ther screened these articles according to our inclusion and ex-clusion criteria. Based on the titles and abstracts of each text, 868 studies were excluded due to duplication and non-related topics. Sixty-six articles were applied for full-text analysis. De-mographic characteristics and LVEF, LVEDV, and LVESV pa-rameters were our outcomes of interest. Of the 66 studies that underwent full-text analysis, 44 studies were further excluded owing to other types of study subjects, regarding bone mesen-chymal cells therapy (n=6), granulocyte-colony stimulating
Table 1. Population Characteristics
Author BMMC
(n)
Control (n)
Follow-up
(month) Doses Injection time
Aspiration to injection
Infarcted
territory Imaging
Assmus, et al.12 91 85 4 198×106 3–7 days Same day - Angiography
Beitnes, et al.13 50 50 3, 6, 12, 36 68×106 4–8 days Same day Anterior wall ECHO
Benedek, et al.14 9 9 48 1.66±0.32×10⁹ 3 weeks–3 months Same day Anterior wall Angiography
Cao, et al.15 41 45 1, 3, 6, 12, 48 5±1.2×10⁷ 7 days Same day Anterior wall ECHO
Colombo, et al.16 5 5 12 5.9×10⁶ 10–14 days Same day Anterior wall ECHO
Dill, et al.17 27 27 4, 12 236±174×106 3–8 days Same day - MRI
Hirsch, et al.18 66 69 4 296±164×106 3–8 days Same day Anterior wall MRI
Hu, et al.19 11 14 6, 12 10×107 Day 5 24 h after
harvested Anterior wall ECHO Huang, et al.20 26 25 6, 12 4.9×10⁸ 3–7 days, 7–30 days Same day Anterior wall ECHO
Huikuri, et al.21 40 40 6 360×106 2–6 days Same day Anterior wall ECHO
Janssens, et al.22 33 34 4 304×106 Within 24 hours Same day Anterior wall MRI
Lunde, et al.23 50 50 6 68×106 4–8 days 24 h after
harvested Anterior wall SPECT Meyer, et al.24 30 30 6, 18 24.6±9.4×10⁸ 4.8±1.3 days Same day Anterior wall MRI
Piepoli, et al.25 19 19 1, 6, 12 418×106 4±1 days Same day Anterior wall Rest SPECT
San Roman, et al.26 30 31 12 83×106 3–5 days Same day Anterior wall MRI/angiography
Schaefer, et al.27 30 29 6, 18 25±2×10⁹ Within 5 days Same day Anterior wall ECHO
Skalicka, et al.28 17 10 4, 24 26.4×10⁸ 4–11 days Same day Anterior wall ECHO
Srimahachota, et al.29 11 12 6 420±221×106 57.2±122.8 days Same day - MRI/ ECHO
Tendera, et al.30 46 20 6 1.78×10⁸ 3-12 days Same day Anterior wall MRI
Traverse, et al.31 30 10 6 150×106 15.5–20 days Same day Anterior wall MRI
Wollert, et al.32 30 30 6 24±6×10⁸ 4–8 days Same day - MRI
Yao, et al.33 12 12 6, 12 1.9±1.2×10⁸ 3–7 days Same day Anterior wall MRI
BMMC, bone marrow mononuclear cells; MRI, magnetic resonance imaging; ECHO, echocardiography; SPECT, single photon emission computed tomography.
934 records identified after duplicates removed
66 studies met all inclusion criteria
22 studies included in the systematic review and quantitative analysis
[image:3.595.58.555.401.725.2]Excluded (n=868) Review 73 Letter 60 Editorial 22 Case report 324 Retrospective cohort 297 Prospective cohort 92
Fig. 1. Flow diagram of the literature search process and meta-analysis. BMMC, bone marrow mononuclear cell; G-CSF, granulocyte-colony stimulat-ing factor; BMSC, bone mesenchymal cell.
73 records identified from PubMed 913 records identified from EMBASE
17 excluded because of trial on comparison between BMMC therapy and progenitor cell therapy or G-CSF or BMSC or peripheral blood cells 15 excluded because of unable to extract
data
factor treatment (n=7), peripheral blood cells (n=4), lack of available data (n=15), and no baseline data or only treatment group data (n=12) (Fig. 1). Finally, 22 RCTs enrolling a total of 1360 participants, of which 704 patients were treated with BMMC therapy, were used in this meta-analysis.
Study characteristics
The relevant study characteristics of each individual study that were thought to be an impact factor for the outcomes are sum-marized in Table 1. The recruited articles were published from 2004 to March 2015. Most studies used a 1:1 randomization scheme and studies sizes ranged from 10 to 176 patients. The follow-up duration ranged from 1 week to 48 months.12-33 Num-ber of cells injected ranged from <108 to >109, and infusion time after STEMI onset was between less than 24 hours and 2 weeks later. Eighteen studies announced that patients suffered from STEMI of the anterior wall; another four did not clarify infarcted territory. Most of the studies performed BMCs aspi-ration and injection at the same day; two studies infused BMMC 24 hours after harvested. All of the selected trials ap-plied freshly isolated BMMC by density gradient separation of autologous bone marrow aspirates, and cell injections were performed through intracoronary infusion after successful PCI post STEMI. All of the enrolled patients received BMMC infusion one-time-only. In the selected studies, LVEF, LVEDV, and LVESV were measured with MRI, SPECT, ECHO, and
quan-titative LV angiography. If one trial had applied several mea-surement tools, data measured by ECHO or MRI were prefer-entially used.
Overall effects of BMMC therapy on LVFE, LVEDV, and LVESV
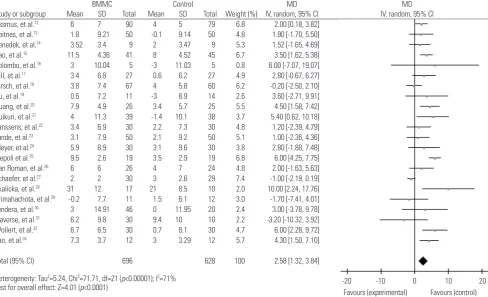
According to the combined data of 22 studies, cell therapy im-proved LVEF by 2.58 (95% CI, 1.32, 3.84; p<0.001; I2=71%) (Fig. 2), compared with controls. Due to the considerable high degree of heterogeneity among the studies, we conducted a sensitivity analysis using the one study remove method to seek out the het-erogeneity sources, as well as to confirm the statistical power of the study. The initial result did not change when we omitted the studies one by one. However, we observed that, when re-moving the study by Piepoli, et al.25 and Schaefer, et al.,27 the I2 value changed from 71% to 60% and from 71% to 48%, respec-tively. When we omitted both studies, the I2 value further dropped from 71% to 25%. Therefore, we hypothesized the two studies might be the sources of heterogeneity.
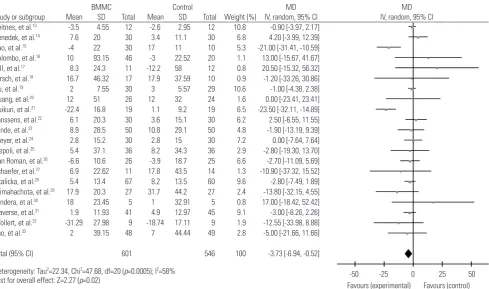
The calculated data showed a significant reduction in LVEDV [-3.73, (95% CI, -6.94, -0.52), p=0.02, I2=58%] (Fig. 3). Because I2>50%, one factor at a time sensitivity analysis was also per-formed. When removing the studies by Cao, et al.15 and Hui-kuri, et al.,21 the only two studies that found significant improve-ment in LVEDV, the I2 value dropped to 0%. However, the positive effect of BMMC in LVEDV also disappeared [-1.24, (95% CI,
BMMC Control MD MD
Study or subgroup Mean SD Total Mean SD Total Weight (%) IV, random, 95% CI IV, random, 95% CI
Assmus, et al.12 6 7 90 4 5 79 6.8 2.00 [0.18, 3.82]
Beitnes, et al.13 1.8 9.21 50 -0.1 9.14 50 4.8 1.90 [-1.70, 5.50]
Benedek, et al.14 3.52 3.4 9 2 3.47 9 5.3 1.52 [-1.65, 4.69]
Cao, et al.15 11.5 4.36 41 8 4.52 45 6.7 3.50 [1.62, 5.38]
Colombo, et al.16 3 10.04 5 -3 11.03 5 0.8 6.00 [-7.07, 19.07]
Dill, et al.17 3.4 6.8 27 0.6 6.2 27 4.9 2.80 [-0.67, 6.27]
Hirsch, et al.18 3.8 7.4 67 4 5.8 60 6.2 -0.20 [-2.50, 2.10]
Hu, et al.19 0.6 7.2 11 -3 8.9 14 2.6 3.60 [-2.71, 9.91]
Huang, et al.20 7.9 4.9 26 3.4 5.7 25 5.5 4.50 [1.58, 7.42]
Huikuri, et al.21 4 11.3 39 -1.4 10.1 38 3.7 5.40 [0.62, 10.18]
Janssens, et al.22 3.4 6.9 30 2.2 7.3 30 4.8 1.20 [-2.39, 4.79]
Lunde, et al.23 3.1 7.9 50 2.1 9.2 50 5.1 1.00 [-2.36, 4.36]
Meyer, et al.24 5.9 8.9 30 3.1 9.6 30 3.8 2.80 [-1.88, 7.48]
Piepoli et al.25 9.5 2.6 19 3.5 2.9 19 6.8 6.00 [4.25, 7.75]
San Roman, et al.26 6 6 26 4 7 24 4.8 2.00 [-1.63, 5.63]
Schaefer, et al.27 2 2 30 3 2.6 29 7.4 -1.00 [-2.19, 0.19]
Skalicka, et al.28 31 12 17 21 8.5 10 2.0 10.00 [2.24, 17.76]
Srimahachota, et al.29 -0.2 7.7 11 1.5 6.1 12 3.0 -1.70 [-7.41, 4.01]
Tendera, et al.30 3 14.91 46 0 11.95 20 2.4 3.00 [-3.78, 9.78]
Traverse, et al.31 6.2 9.8 30 9.4 10 10 2.2 -3.20 [-10.32, 3.92]
Wollert, et al.32 6.7 6.5 30 0.7 8.1 30 4.7 6.00 [2.28, 9.72]
Yao, et al.33 7.3 3.7 12 3 3.29 12 5.7 4.30 [1.50, 7.10]
Total (95% CI) 696 628 100 2.58 [1.32, 3.84]
Heterogeneity: Tau2=5.24, Chi2=71.71, df=21 (p<0.00001); I2=71%
Test for overall effect: Z=4.01 (p<0.0001)
Favours (experimental) Favours (control)
[image:4.595.48.537.413.710.2]-20 -10 0 10 20
-2.90, 0.43), p=0.14, I2=0%].
In the evaluation of LVESV, pooled data showed significant improvement in treatment groups, compared with controls
[-4.67, (95% CI, -7.07, -2.28), p<0.001, I2=59%] (Fig. 4). The same sensitivity analysis was conducted, and no conflicting results were found. A decrease in I2 was observed went
re-BMMC Control MD MD
Study or subgroup Mean SD Total Mean SD Total Weight (%) IV, random, 95% CI IV, random, 95% CI
Beitnes, et al.13 -3.5 4.55 12 -2.6 2.95 12 10.8 -0.90 [-3.97, 2.17]
Benedek, et al.14 7.6 20 30 3.4 11.1 30 6.8 4.20 [-3.99, 12.39]
Cao, et al.15 -4 22 30 17 11 10 5.3 -21.00 [-31.41, -10.59]
Colombo, et al.16 10 93.15 46 -3 22.52 20 1.1 13.00 [-15.67, 41.67]
Dill, et al.17 8.3 24.3 11 -12.2 58 12 0.8 20.50 [-15.32, 56.32]
Hirsch, et al.18 16.7 46.32 17 17.9 37.59 10 0.9 -1.20 [-33.26, 30.86]
Hu, et al.19 2 7.55 30 3 5.57 29 10.6 -1.00 [-4.38, 2.38]
Huang, et al.20 12 51 26 12 32 24 1.6 0.00 [-23.41, 23.41]
Huikuri, et al.21 -22.4 16.8 19 1.1 9.2 19 6.5 -23.50 [-32.11, -14.89]
Janssens, et al.22 6.1 20.3 30 3.6 15.1 30 6.2 2.50 [-6.55, 11.55]
Lunde, et al.23 8.9 28.5 50 10.8 29.1 50 4.8 -1.90 [-13.19, 9.39]
Meyer, et al.24 2.8 15.2 30 2.8 15 30 7.2 0.00 [-7.64, 7.64]
Piepoli, et al.25 5.4 37.1 36 8.2 34.3 36 2.9 -2.80 [-19.30, 13.70]
San Roman, et al.26 -6.6 10.6 26 -3.9 18.7 25 6.6 -2.70 [-11.09, 5.69]
Schaefer, et al.27 6.9 22.62 11 17.8 43.5 14 1.3 -10.90 [-37.32, 15.52]
Skalicka, et al.28 5.4 13.4 67 8.2 13.5 60 9.6 -2.80 [-7.49, 1.89]
Srimahachota, et al.29 17.9 20.3 27 31.7 44.2 27 2.4 -13.80 [-32.15, 4.55]
Tendera, et al.30 18 23.45 5 1 32.91 5 0.8 17.00 [-18.42, 52.42]
Traverse, et al.31 1.9 11.93 41 4.9 12.97 45 9.1 -3.00 [-8.26, 2.26]
Wollert, et al.32 -31.29 27.98 9 -18.74 17.11 9 1.9 -12.55 [-33.98, 8.88]
Yao, et al.33 2 39.15 48 7 44.44 49 2.8 -5.00 [-21.66, 11.66]
Total (95% CI) 601 546 100 -3.73 [-6.94, -0.52]
Heterogeneity: Tau2=22.34, Chi2=47.68, df=20 (p=0.0005); I2=58%
Test for overall effect: Z=2.27 (p=0.02)
Favours (experimental) Favours (control)
[image:5.595.63.553.119.408.2]-50 -25 0 25 50
Fig. 3. Forest plot of the difference in change left ventricular end-diastolic volume from baseline to follow-up. BMMC, bone marrow mononuclear cell; MD, mean difference; SD, standard deviation; CI, confidence interval.
BMMC Control MD MD
Study or subgroup Mean SD Total Mean SD Total Weight (%) IV, random, 95% CI IV, random, 95% CI
Assmus, et al.12 -0.7 19 90 2 20 79 6.9 -2.70 [-8.60, 3.20]
Beitnes, et al.13 0 31.75 48 6 33.65 49 2.6 -6.00 [-19.02, 7.02]
Cao, et al.15 -13.2 8.32 41 -6.9 9.24 45 9.3 -6.30 [-10.01, -2.59]
Dill, et al.17 5.8 17.7 27 17.8 35.3 27 2.1 -12.00 [-26.90, 2.90]
Hirsch, et al.18 -0.5 13.4 67 1.2 11.7 60 8.6 -1.70 [-6.07, 2.67]
Hu, et al.19 -6.8 13.7 11 16.8 26.7 14 1.9 -23.60 [-39.76, -7.44]
Huang, et al.20 -19.6 11.1 26 -6.4 15.9 25 5.5 -13.20 [-20.75, -5.65]
Huikuri, et al.21 -10 30.3 36 -1.2 11.5 36 3.6 -8.80 [-19.39, 1.79]
Janssens, et al.22 -1.1 11.2 30 0.6 11.6 30 7.1 -1.70 [-7.47, 4.07]
Meyer, et al.24 -0.5 16.5 30 0.4 12.5 30 5.6 -0.90 [-8.31, 6.51]
Piepoli, et al.25 -12.5 10.1 19 -0.5 4.4 19 7.9 -12.00 [-16.95, -7.05]
San Roman, et al.26 -3 26 26 2 24 24 2.4 -5.00 [-18.86, 8.86]
Schaefer, et al.27 -1 6.56 30 -2 4.36 29 10.2 1.00 [-1.83, 3.83]
Skalicka, et al.28 -2.6 38.98 17 -1.8 38.7 10 0.6 -0.80 [-31.11, 29.51]
Srimahachota, et al.29 5.9 22.2 11 -19.8 65.8 12 0.4 25.70 [-13.77, 65.17]
Tendera, et al.30 -1 60.13 46 9 29.01 20 1.1 -10.00 [-31.53, 11.53]
Traverse, et al.31 -7 3.3 30 -2 8.4 10 7.5 -5.00 [-10.34, 0.34]
Wollert, et al.32 -0.6 14.9 30 2 11.1 30 6.2 -2.60 [-9.25, 4.05]
Yao, et al.33 -6.1 2.9 12 -4.5 3.25 12 10.6 -1.60 [-4.06, 0.86]
Total (95% CI) 627 561 100 -4.67 [-7.07, -2.28]
Heterogeneity: Tau2=12.48, Chi2=44.42, df=18 (p=0.0005); I2=59%
[image:5.595.57.551.448.708.2]Test for overall effect: Z=3.82 (p=0.0001)
Fig. 4. Forest plot of the difference in change left ventricular end-systolic volume from baseline to follow-up. BMMC, bone marrow mononuclear cell; MD, mean difference; SD, standard deviation; CI, confidence interval.
Favours (experimental) Favours (control)
BMMC Control MD MD
Study or subgroup Mean SD Total Mean SD Total Weight (%) IV, random, 95% CI IV, random, 95% CI
1-week
Cao, et al.15 2.3 2.91 41 2.1 3.05 45 3.7 0.20 [-1.06, 1.46]
Subtotal (95% CI) 41 45 3.7 0.20 [-1.06, 1.46]
Heterogeneity: Not applicable Test for overall effect: Z=0.31 (p=0.76) 1-month
Cao, et al.15 4.5 3.1 41 3.7 3.1 45 3.7 0.80 [-0.51, 2.11]
Subtotal (95% CI) 41 45 3.7 0.80 [-0.51, 2.11]
Heterogeneity: Not applicable Test for overall effect: Z=1.20 (p=0.23) 3-month
Beitnes, et al.13 3.2 9.88 50 2.4 9.14 50 2.4 0.80 [-2.93, 4.53]
Cao, et al.15 5.9 3.05 41 4.9 3.4 45 3.7 1.00 [-0.36, 2.36]
Piepoli, et al.25 7 2.4 19 2.4 2 19 3.7 4.60 [3.20, 6.00]
Subtotal (95% CI) 110 114 9.8 2.31 [-0.52, 5.14]
Heterogeneity: Tau2=5.00, Chi2=13.97, df=2 (p<0.0009); I2=86%
Test for overall effect: Z=1.60 (p=0.11) 4-month
Assmus, et al.12 6 7 90 4 5 79 3.5 2.00 [0.18, 3.82]
Dill, et al.17 3.2 6.8 27 0.8 6.8 27 2.4 2.40 [-1.23, 6.03]
Hirsch, et al.18 3.8 7.4 67 4 5.8 60 3.2 -0.20 [-2.50, 2.10]
Janssens, et al.22 3.4 6.9 30 2.2 7.3 30 2.4 1.20 [-2.39, 4.79]
Skalicka, et al.28 15 5.9 17 19 7.6 10 1.6 -4.00 [-9.48, 1.48]
Subtotal (95% CI) 231 206 13.1 0.88 [-0.74, 2.49]
Heterogeneity: Tau2=1.09, Chi2=5.98, df=4 (p=0.20); I2=33%
Test for overall effect: Z=1.07 (p=0.29) 6-month
Beitnes, et al.13 3.1 10.11 50 2.1 9.55 50 2.3 1.00 [-2.85, 4.85]
Cao, et al.15 9.4 3.28 41 7.1 3.54 45 3.7 2.30 [0.86, 3.74]
Hu, et al.19 0.4 7.4 11 -4.9 7.1 14 1.5 5.30 [-0.44, 11.04]
Huang, et al.20 5.5 2.2 26 2.4 3.2 25 3.6 3.10 [1.59, 4.61]
Huikuri, et al.21 4 11.3 39 -1.4 10.1 38 1.9 5.40 [0.62, 10.18]
Lunde, et al.23 3.1 7.9 50 2.1 9.2 50 2.6 1.00 [-2.36, 4.36]
Piepoli, et al.25 8.4 2.1 19 2.2 2.9 19 3.6 6.20 [4.59, 7.81]
Schaefer, et al.27 -1 2 30 1 2 29 3.8 -2.00 [-3.02, -0.98]
Srimahachota, et al.29 -0.2 7.7 11 1.5 6.1 12 1.5 -1.70 [-7.41, 4.01]
Tendera, et al.30 3 14.91 46 0 11.95 20 1.2 3.00 [-3.78, 9.78]
Traverse, et al.31 6.2 9.8 30 9.4 10 10 1.1 -3.20 [-10.32, 3.92]
Wollert, et al.32 6.7 6.5 30 0.7 8.1 30 2.4 6.00 [2.28, 9.72]
Yao, et al.33 5.2 3.87 12 2.1 2.5 12 3.0 3.10 [0.49, 5.71]
Subtotal (95% CI) 395 354 32.3 2.41 [0.39, 4.42]
Heterogeneity: Tau2=10.01, Chi2=97.88, df=12 (p<0.00001); I2=88%
Test for overall effect: Z=2.34 (p=0.02) 12-month
Beitnes, et al.13 3 9.21 50 1.6 9.23 50 2.4 1.40 [-2.21, 5.01]
Cao, et al.15 9.2 3.89 41 6 3.82 45 3.6 3.20 [1.57, 4.83]
Colombo, et al.16 3 10.04 5 -3 11.03 5 0.4 6.00 [-7.07, 19.07]
Dill, et al.17 3.4 6.8 27 0.6 6.2 27 2.5 2.80 [-0.67, 6.27]
Hu, et al.19 0.6 7.2 11 -3 8.9 14 1.3 3.60 [-2.71, 9.91]
Huang, et al.20 6.9 3.9 26 3.4 5.7 25 3.0 3.50 [0.81, 6.19]
Piepoli, et al.25 9.5 2.6 19 3.5 2.9 19 3.5 6.00 [4.25, 7.75]
San Roman, et al.26 6 6 26 4 7 24 2.4 2.00 [-1.63, 5.63]
Yao, et al.33 7.3 3.7 12 3 3.29 12 2.9 4.30 [1.59, 7.10]
Subtotal (95% CI) 217 221 22.1 3.79 [2.72, 4.85]
Heterogeneity: Tau2=0.47, Chi2=9.78, df=8 (p=0.28); I2=18%
Test for overall effect: Z=6.97 (p<0.00001)
Favours (experimental) Favours (control)
[image:6.595.45.527.67.699.2]-20 -10 0 10 20
moving the studies by Piepoli, et al.25 and Schaefer, et al.,27 from 59% to 32%.
Effects of BMMC therapy over time
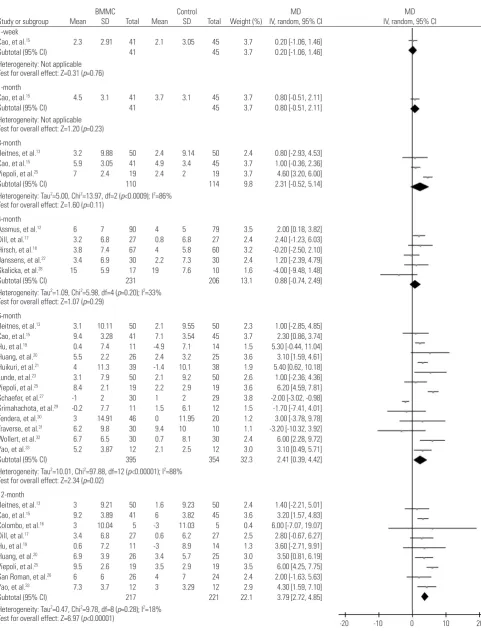
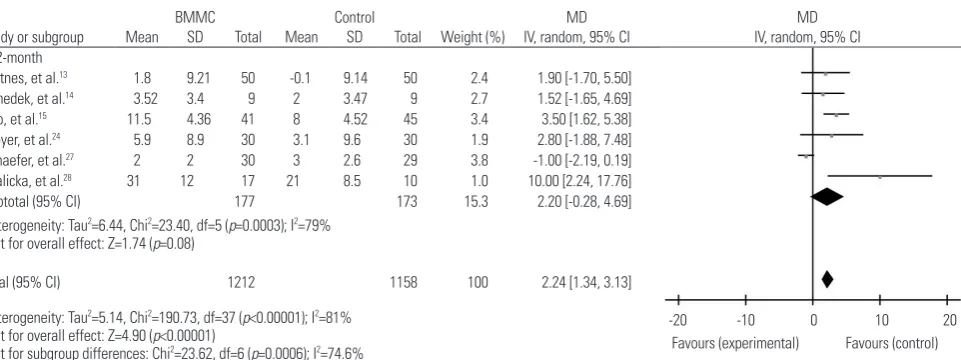
Pooled statistics revealed no beneficial effect toward BMMC groups at less than 6 months of follow up, when compared with control groups. The function of BMMC emerged at 6 months of follow up and sustained to 12 months by improving LVEF by 2.41 (95% CI, 0.39, 4.42; p=0.02; I2=88%) and 3.79 (95% CI, 2.72, 4.85; p<0.001; I2=18%), respectively. However, the favor-able effect seemed to disappear at 18 to 48 months of follow-up [2.20 (95% CI, -0.28, 4.69; p=0.08; I2=79%)] (Fig. 5). Sensitiv-ity analyses were performed in subgroups of 6 months and more than 12 months of follow-up. Again, no opposing out-comes were found when removing each study. On the other hand, when we deleted the results from Piepoli, et al.25 and Schaefer, et al.,27 the I2 value decreased in the 6-month group from 88% to 19%, and in the >12-month from 79% to 13%.
Subgroup analysis demonstrated that BMMC therapy was only effective at 3 months and 6 months of follow-up in the im-provement of LVEDV, with -3.63 (95% CI, -6.57, -0.68; p=0.02; I2=0%) and -4.20 (95% CI, -8.11, -0.29; p=0.04; I2=70%), respec-tively (Fig. 6). The results of 12 months and 18−48 months fol-low-up did not show any significant difference between treat-ment group and controls. The study by Piepoli, et al.25 was found to cause high heterogeneity in sensitivity analysis.
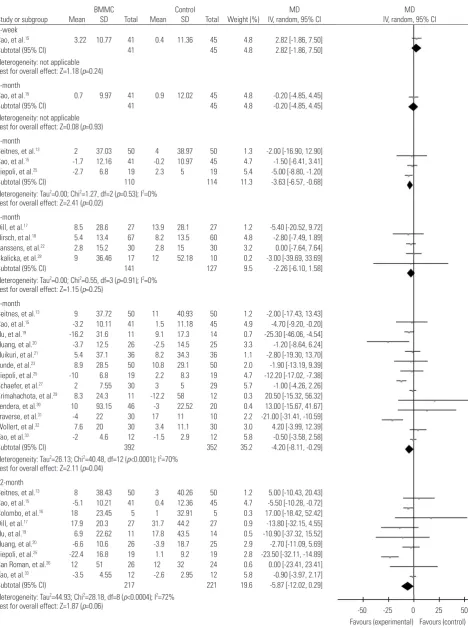
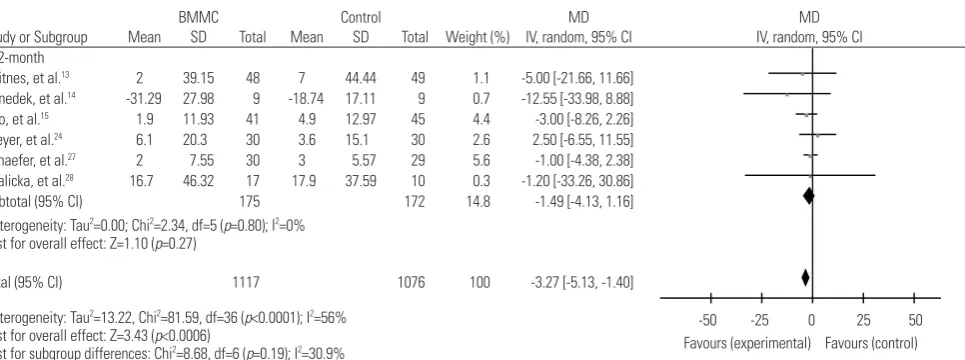
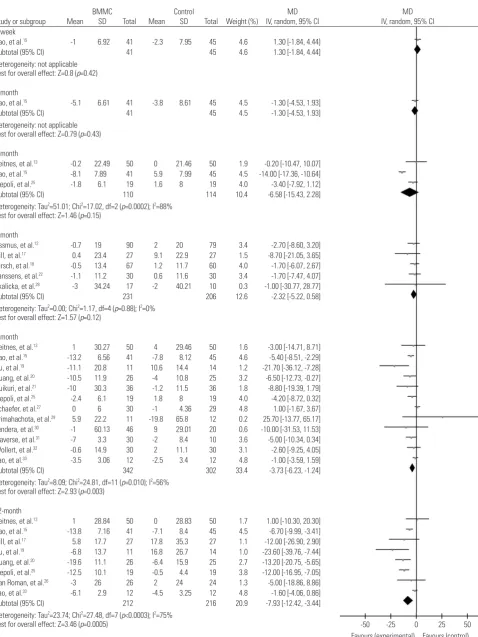
The effect of cell therapy in LVESV manifested at 6 months follow-up -3.73 (95% CI, -6.23, -1.24; p=0.003; I2=56%) and at 12 months follow-up -7.93 (95% CI, -12.42, -3.44; p=0.0005; I2= 75%) (Fig. 7). Whereas in short term follow-up of 3 months and 4 months, and in long term 18−48 months, BMMC treatment did not show superiority. As above, when removing the studies by Piepoli, et al.25 and Schaefer, et al.,27 the I2 value decreased to less than 50%.
Imaging modalities
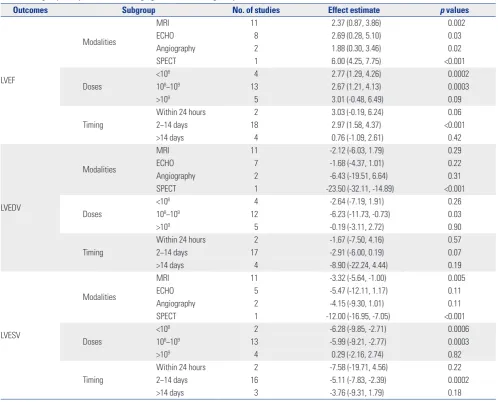
MRI is currently considered as the gold standard to assess LV function and volume. When subgroup analysis was performed based on MRI, the significant effect of BMMC therapy on LVEDV diminished [-2.12 (95% CI, -6.03, 1.79), p=0.29], while the significant improvement was still preserved in LVEF and LVESV (Table 2).
Doses of cells infusion
Based on our data, patients treated with an injection of more than 109 cells did not benefit more than patients with lower cell doses. More specifically, in studies that infused patients with less than 108 cells, LVEF and LVESV were significantly improved in treatment groups, compared with controls. Patients who received BMMC between 108 and 109 had significant improve-ment in LVEF, LVEDV, and LVESV. Whereas no such results were observed in the highest cell dose group (Table 2). Timing of cells infusion
BMMC transplantation within 2 to 14 days after STEMI onset resulted in a significant elevation in LVEF by 2.97 (95% CI, 1.58, 4.37; p<0.001) and a decrease in LVESV by -5.11 (95% CI, -7.83, -2.39; p=0.0002). Cell therapy that was performed within 24 hours or more than 2 weeks after STEMI still improved LVEF, LVEDV, and LVESV. However, the outcomes did not reach statis-tical significant when compared with control patients (Table 2).
DISCUSSION
In this meta-analysis, we assessed LVEF, LVEDV, and LVESV as our primary end points to evaluate the effectiveness of BMMC therapy on LV function, LV remodeling, LV diastolic function and LV systolic function in patient post STEMI. The summa-rized data suggested BMMC therapy is associated with the re-covery of LVEF and considerable reduction on LVEDV and
BMMC Control MD MD
Study or subgroup Mean SD Total Mean SD Total Weight (%) IV, random, 95% CI IV, random, 95% CI
>12-month
Beitnes, et al.13 1.8 9.21 50 -0.1 9.14 50 2.4 1.90 [-1.70, 5.50]
Benedek, et al.14 3.52 3.4 9 2 3.47 9 2.7 1.52 [-1.65, 4.69]
Cao, et al.15 11.5 4.36 41 8 4.52 45 3.4 3.50 [1.62, 5.38]
Meyer, et al.24 5.9 8.9 30 3.1 9.6 30 1.9 2.80 [-1.88, 7.48]
Schaefer, et al.27 2 2 30 3 2.6 29 3.8 -1.00 [-2.19, 0.19]
Skalicka, et al.28 31 12 17 21 8.5 10 1.0 10.00 [2.24, 17.76]
Subtotal (95% CI) 177 173 15.3 2.20 [-0.28, 4.69]
Heterogeneity: Tau2=6.44, Chi2=23.40, df=5 (p=0.0003); I2=79%
Test for overall effect: Z=1.74 (p=0.08)
Total (95% CI) 1212 1158 100 2.24 [1.34, 3.13]
Heterogeneity: Tau2=5.14, Chi2=190.73, df=37 (p<0.00001); I2=81%
Test for overall effect: Z=4.90 (p<0.00001)
Test for subgroup differences: Chi2=23.62, df=6 (p=0.0006); I2=74.6% Favours (experimental) Favours (control)
[image:7.595.66.547.70.250.2]-20 -10 0 10 20
BMMC Control MD MD
Study or subgroup Mean SD Total Mean SD Total Weight (%) IV, random, 95% CI IV, random, 95% CI
1-week
Cao, et al.15 3.22 10.77 41 0.4 11.36 45 4.8 2.82 [-1.86, 7.50]
Subtotal (95% CI) 41 45 4.8 2.82 [-1.86, 7.50]
Heterogeneity: not applicable Test for overall effect: Z=1.18 (p=0.24) 1-month
Cao, et al.15 0.7 9.97 41 0.9 12.02 45 4.8 -0.20 [-4.85, 4.45]
Subtotal (95% CI) 41 45 4.8 -0.20 [-4.85, 4.45]
Heterogeneity: not applicable Test for overall effect: Z=0.08 (p=0.93) 3-month
Beitnes, et al.13 2 37.03 50 4 38.97 50 1.3 -2.00 [-16.90, 12.90]
Cao, et al.15 -1.7 12.16 41 -0.2 10.97 45 4.7 -1.50 [-6.41, 3.41]
Piepoli, et al.25 -2.7 6.8 19 2.3 5 19 5.4 -5.00 [-8.80, -1.20]
Subtotal (95% CI) 110 114 11.3 -3.63 [-6.57, -0.68]
Heterogeneity: Tau2=0.00; Chi2=1.27, df=2 (p=0.53); I2=0%
Test for overall effect: Z=2.41 (p=0.02) 4-month
Dill, et al.17 8.5 28.6 27 13.9 28.1 27 1.2 -5.40 [-20.52, 9.72]
Hirsch, et al.18 5.4 13.4 67 8.2 13.5 60 4.8 -2.80 [-7.49, 1.89]
Janssens, et al.22 2.8 15.2 30 2.8 15 30 3.2 0.00 [-7.64, 7.64]
Skalicka, et al.28 9 36.46 17 12 52.18 10 0.2 -3.00 [-39.69, 33.69]
Subtotal (95% CI) 141 127 9.5 -2.26 [-6.10, 1.58]
Heterogeneity: Tau2=0.00; Chi2=0.55, df=3 (p=0.91); I2=0%
Test for overall effect: Z=1.15 (p=0.25) 6-month
Beitnes, et al.13 9 37.72 50 11 40.93 50 1.2 -2.00 [-17.43, 13.43]
Cao, et al.15 -3.2 10.11 41 1.5 11.18 45 4.9 -4.70 [-9.20, -0.20]
Hu, et al.19 -16.2 31.6 11 9.1 17.3 14 0.7 -25.30 [-46.06, -4.54]
Huang, et al.20 -3.7 12.5 26 -2.5 14.5 25 3.3 -1.20 [-8.64, 6.24]
Huikuri, et al.21 5.4 37.1 36 8.2 34.3 36 1.1 -2.80 [-19.30, 13.70]
Lunde, et al.23 8.9 28.5 50 10.8 29.1 50 2.0 -1.90 [-13.19, 9.39]
Piepoli, et al.25 -10 6.8 19 2.2 8.3 19 4.7 -12.20 [-17.02, -7.38]
Schaefer, et al.27 2 7.55 30 3 5 29 5.7 -1.00 [-4.26, 2.26]
Srimahachota, et al.29 8.3 24.3 11 -12.2 58 12 0.3 20.50 [-15.32, 56.32]
Tendera, et al.30 10 93.15 46 -3 22.52 20 0.4 13.00 [-15.67, 41.67]
Traverse, et al.31 -4 22 30 17 11 10 2.2 -21.00 [-31.41, -10.59]
Wollert, et al.32 7.6 20 30 3.4 11.1 30 3.0 4.20 [-3.99, 12.39]
Yao, et al.33 -2 4.6 12 -1.5 2.9 12 5.8 -0.50 [-3.58, 2.58]
Subtotal (95% CI) 392 352 35.2 -4.20 [-8.11, -0.29]
Heterogeneity: Tau2=26.13; Chi2=40.48, df=12 (p<0.0001); I2=70%
Test for overall effect: Z=2.11 (p=0.04) 12-month
Beitnes, et al.13 8 38.43 50 3 40.26 50 1.2 5.00 [-10.43, 20.43]
Cao, et al.15 -5.1 10.21 41 0.4 12.36 45 4.7 -5.50 [-10.28, -0.72]
Colombo, et al.16 18 23.45 5 1 32.91 5 0.3 17.00 [-18.42, 52.42]
Dill, et al.17 17.9 20.3 27 31.7 44.2 27 0.9 -13.80 [-32.15, 4.55]
Hu, et al.19 6.9 22.62 11 17.8 43.5 14 0.5 -10.90 [-37.32, 15.52]
Huang, et al.20 -6.6 10.6 26 -3.9 18.7 25 2.9 -2.70 [-11.09, 5.69]
Piepoli, et al.25 -22.4 16.8 19 1.1 9.2 19 2.8 -23.50 [-32.11, -14.89]
San Roman, et al.26 12 51 26 12 32 24 0.6 0.00 [-23.41, 23.41]
Yao, et al.33 -3.5 4.55 12 -2.6 2.95 12 5.8 -0.90 [-3.97, 2.17]
Subtotal (95% CI) 217 221 19.6 -5.87 [-12.02, 0.29]
Heterogeneity: Tau2=44.93; Chi2=28.18, df=8 (p<0.0004); I2=72%
Test for overall effect: Z=1.87 (p=0.06)
Favours (experimental) Favours (control)
[image:8.595.46.515.69.698.2]-50 -25 0 25 50
LVESV. Due to the high degree of heterogeneity in each group, sensitivity analysis was conducted using the one study remove method. We assumed that two studies, Piepoli, et al.25 and Schaefer, et al.,27 might be sources of heterogeneity, as upon omitting the two studies in the analyses of LVEF and LVESV, the I2 value decreased to less than 50% while no original outcomes had changed. A comparison was made between the charac-teristics of the two studies and the others to disclose the rea-sons for the discrepancy. We found that the study by Piepoli, et al.25 was the only to use SPECT for outcome measurement. However, no major difference was found between Schaefer, et al.27 and other studies. Thus, the use of these two studies in fu-ture meta-analysis needs to be carefully deliberated. Interest-ingly, in LVEDV, when removing the studies by Cao, et al.15 and Huikuri, et al.,21 not only did the I2 value drop to 0%, the signif-icant treatment effect on BMMC also disappeared. Therefore, the therapeutic effect of BMMC on LVEDV still remained con-troversial.
Whether cell therapy can provide a short-term or long-term effect is still in dispute. Many previous meta-analysis has ex-plored this area. Cong, et al.34 reported that bone marrow stem cells was effective in the amelioration of LVEF, LVEDV, and LVESV at 3 to 12 months investigation. Chen, et al.35 suggested that cell transplantation only had beneficial effects on LVEF, which could last at least 2 years. De Jong, et al.8 concluded that intracoronary infusion of BMMC improved LVEF at 6 months to 12 months follow-up, mostly by reduction of LVESV. This conclusion is in accordance with our findings, which reflected a profound increase in LVEF and a reduction in LVESV at 6 to 12 months.
In the subgroup analysis adjusting imaging methods, when data were corrected for use of MRI, the positive effect of cell therapy on LVEDV diminished. More precisely, the treatment effect on LVEDV disappeared in all three imaging subgroups, MRI, ECHO, and angiography (Table 2). Already in sensitivity analysis when omitting the results of Cao, et al.15 and Huikuri,
et al.,21 the effect on LVEDV became insignificant between BMMC and control patients. The finding of this subgroup fur-ther indicated that BMMC fur-therapy might have no superior ef-fect on LVEDV, compared with controls.
Prior studies put forward that poor cell engraftment and low survival of the transplanted BMMC are the major obsta-cles to the development of cell-based therapy.36,37 They also suggested that only a small proportion of infusion cells remain in the heart,38 and most of them die after a few days.39 There-fore, many researchers hypothesized the number of injected cells might influence the treatment effect in STEMI patients. De Jong, et al.8 found that patients treated with an infusion of <100 million cells did not benefit more or less than patients with higher cell doses. On the contrary, the pooled outcome of our study suggested that patients who receive an infusion of 10 to 100 million cells might achieve the best therapeutic effect from BMMC.
The optimal time frame for intracoronary BMMC infusion was also assessed. Given the biological time course of healing and the expression of multiple factors, some researchers have believed that the highest probability for cells nesting and sur-viving was in the period between day 3 and day 7.40 Several meta-analyses already elucidated that BMMC transfer at 3 to 7 days post AMI was the optimal time to enhance cardiac function in patients.41 Our study provided further evidence that cell therapy performed within 2 to 14 days after symptom on-set resulted in better recovery of LV function and volumes than patients receiving BMMC within 24 hours and after 14 days.
Some limitations need to be considered in this meta-analy-sis. Since the potential beneficial effects might be attributed to the combined effects of all infused mononuclear cells, rather than the small amount of progenitor cell or stem cell present in the bone marrow, our study restricted cell type to unselect-ed BMMC. The effectiveness of other stem cell types, such as bone mesenchymal cells, remains to be established. Other fac-tors, such as cells administrated routes, cell isolation
proto-BMMC Control MD MD
Study or Subgroup Mean SD Total Mean SD Total Weight (%) IV, random, 95% CI IV, random, 95% CI
>12-month
Beitnes, et al.13 2 39.15 48 7 44.44 49 1.1 -5.00 [-21.66, 11.66]
Benedek, et al.14 -31.29 27.98 9 -18.74 17.11 9 0.7 -12.55 [-33.98, 8.88]
Cao, et al.15 1.9 11.93 41 4.9 12.97 45 4.4 -3.00 [-8.26, 2.26]
Meyer, et al.24 6.1 20.3 30 3.6 15.1 30 2.6 2.50 [-6.55, 11.55]
Schaefer, et al.27 2 7.55 30 3 5.57 29 5.6 -1.00 [-4.38, 2.38]
Skalicka, et al.28 16.7 46.32 17 17.9 37.59 10 0.3 -1.20 [-33.26, 30.86]
Subtotal (95% CI) 175 172 14.8 -1.49 [-4.13, 1.16]
Heterogeneity: Tau2=0.00; Chi2=2.34, df=5 (p=0.80); I2=0%
Test for overall effect: Z=1.10 (p=0.27)
Total (95% CI) 1117 1076 100 -3.27 [-5.13, -1.40]
Heterogeneity: Tau2=13.22, Chi2=81.59, df=36 (p<0.0001); I2=56%
Test for overall effect: Z=3.43 (p<0.0006)
[image:9.595.65.548.70.250.2]Test for subgroup differences: Chi2=8.68, df=6 (p=0.19); I2=30.9%
Fig. 6. Forest plot of change in left ventricular end-diastolic volume of BMMC transplantation at different time durations. BMMC, bone marrow mono-nuclear cell; MD, mean difference; SD, standard deviation; CI, confidence interval.
Favours (experimental) Favours (control)
BMMC Control MD MD
Study or subgroup Mean SD Total Mean SD Total Weight (%) IV, random, 95% CI IV, random, 95% CI
1-week
Cao, et al.15 -1 6.92 41 -2.3 7.95 45 4.6 1.30 [-1.84, 4.44]
Subtotal (95% CI) 41 45 4.6 1.30 [-1.84, 4.44]
Heterogeneity: not applicable Test for overall effect: Z=0.8 (p=0.42)
1-month
Cao, et al.15 -5.1 6.61 41 -3.8 8.61 45 4.5 -1.30 [-4.53, 1.93]
Subtotal (95% CI) 41 45 4.5 -1.30 [-4.53, 1.93]
Heterogeneity: not applicable Test for overall effect: Z=0.79 (p=0.43)
3-month
Beitnes, et al.13 -0.2 22.49 50 0 21.46 50 1.9 -0.20 [-10.47, 10.07]
Cao, et al.15 -8.1 7.89 41 5.9 7.99 45 4.5 -14.00 [-17.36, -10.64]
Piepoli, et al.25 -1.8 6.1 19 1.6 8 19 4.0 -3.40 [-7.92, 1.12]
Subtotal (95% CI) 110 114 10.4 -6.58 [-15.43, 2.28]
Heterogeneity: Tau2=51.01; Chi2=17.02, df=2 (p=0.0002); I2=88%
Test for overall effect: Z=1.46 (p=0.15)
4-month
Assmus, et al.12 -0.7 19 90 2 20 79 3.4 -2.70 [-8.60, 3.20]
Dill, et al.17 0.4 23.4 27 9.1 22.9 27 1.5 -8.70 [-21.05, 3.65]
Hirsch, et al.18 -0.5 13.4 67 1.2 11.7 60 4.0 -1.70 [-6.07, 2.67]
Janssens, et al.22 -1.1 11.2 30 0.6 11.6 30 3.4 -1.70 [-7.47, 4.07]
Skalicka, et al.28 -3 34.24 17 -2 40.21 10 0.3 -1.00 [-30.77, 28.77]
Subtotal (95% CI) 231 206 12.6 -2.32 [-5.22, 0.58]
Heterogeneity: Tau2=0.00; Chi2=1.17, df=4 (p=0.88); I2=0%
Test for overall effect: Z=1.57 (p=0.12)
6-month
Beitnes, et al.13 1 30.27 50 4 29.46 50 1.6 -3.00 [-14.71, 8.71]
Cao, et al.15 -13.2 6.56 41 -7.8 8.12 45 4.6 -5.40 [-8.51, -2.29]
Hu, et al.19 -11.1 20.8 11 10.6 14.4 14 1.2 -21.70 [-36.12, -7.28]
Huang, et al.20 -10.5 11.9 26 -4 10.8 25 3.2 -6.50 [-12.73, -0.27]
Huikuri, et al.21 -10 30.3 36 -1.2 11.5 36 1.8 -8.80 [-19.39, 1.79]
Piepoli, et al.25 -2.4 6.1 19 1.8 8 19 4.0 -4.20 [-8.72, 0.32]
Schaefer, et al.27 0 6 30 -1 4.36 29 4.8 1.00 [-1.67, 3.67]
Srimahachota, et al.29 5.9 22.2 11 -19.8 65.8 12 0.2 25.70 [-13.77, 65.17]
Tendera, et al.30 -1 60.13 46 9 29.01 20 0.6 -10.00 [-31.53, 11.53]
Traverse, et al.31 -7 3.3 30 -2 8.4 10 3.6 -5.00 [-10.34, 0.34]
Wollert, et al.32 -0.6 14.9 30 2 11.1 30 3.1 -2.60 [-9.25, 4.05]
Yao, et al.33 -3.5 3.06 12 -2.5 3.4 12 4.8 -1.00 [-3.59, 1.59]
Subtotal (95% CI) 342 302 33.4 -3.73 [-6.23, -1.24]
Heterogeneity: Tau2=8.09; Chi2=24.81, df=11 (p=0.010); I2=56%
Test for overall effect: Z=2.93 (p=0.003)
12-month
Beitnes, et al.13 1 28.84 50 0 28.83 50 1.7 1.00 [-10.30, 20.30]
Cao, et al.15 -13.8 7.16 41 -7.1 8.4 45 4.5 -6.70 [-9.99, -3.41]
Dill, et al.17 5.8 17.7 27 17.8 35.3 27 1.1 -12.00 [-26.90, 2.90]
Hu, et al.19 -6.8 13.7 11 16.8 26.7 14 1.0 -23.60 [-39.76, -7.44]
Huang, et al.20 -19.6 11.1 26 -6.4 15.9 25 2.7 -13.20 [-20.75, -5.65]
Piepoli, et al.25 -12.5 10.1 19 -0.5 4.4 19 3.8 -12.00 [-16.95, -7.05]
San Roman, et al.26 -3 26 26 2 24 24 1.3 -5.00 [-18.86, 8.86]
Yao, et al.33 -6.1 2.9 12 -4.5 3.25 12 4.8 -1.60 [-4.06, 0.86]
Subtotal (95% CI) 212 216 20.9 -7.93 [-12.42, -3.44]
Heterogeneity: Tau2=23.74; Chi2=27.48, df=7 (p<0.0003); I2=75%
Test for overall effect: Z=3.46 (p=0.0005)
Favours (experimental) Favours (control)
[image:10.595.48.527.67.705.2]-50 -25 0 25 50
BMMC Control MD MD
Study or subgroup Mean SD Total Mean SD Total Weight (%) IV, random, 95% CI IV, random, 95% CI
>12-month
Beitnes, et al.13 0 31.75 48 6 33.65 49 1.4 -6.00 [-19.02, 7.02]
Cao, et al.15 -13.2 8.32 41 -6.9 9.24 45 4.3 -6.30 [-10.01, -2.59]
Meyer, et al.24 -0.5 16.5 30 0.4 12.5 30 2.8 -0.90 [-8.31, 6.51]
Schaefer, et al.27 -1 6.56 30 -2 4.36 29 4.7 1.00 [-1.83, 3.83]
Skalicka, et al.28 -2.6 38.95 17 -1.8 38.7 10 0.3 -0.80 [-31.11, 29.51]
Subtotal (95% CI) 166 163 13.5 -2.45 [-6.89, 1.99]
Heterogeneity: Tau2=11.98; Chi2=9.86, df=4 (p=0.04); I2=59%
Test for overall effect: Z=1.08 (p=0.28)
Total (95% CI) 1143 1091 100 -4.42 [-6.20, -2.64]
Heterogeneity: Tau2=15.36; Chi2=121.04, df=34 (p<0.00001); I2=72%
Test for overall effect: Z=4.88 (p<0.00001)
[image:11.595.64.551.71.239.2]Test for subgroup differences: Chi2=13.53, df=6 (p=0.04); I2=55.6%
Fig. 7. Forest plot of change in left ventricular end-systolic volume of BMMC transplantation at different time durations. BMMC, bone marrow mono-nuclear cell; MD, mean difference; SD, standard deviation; CI, confidence interval.
Favours (experimental) Favours (control)
-50 -25 0 25 50
Table 2. Subgroup Analyses based on Imaging Modalities, Timing of Injection and Doses of Cells Infusion
Outcomes Subgroup No. of studies Effect estimate p values
LVEF
Modalities
MRI 11 2.37 (0.87, 3.86) 0.002 ECHO 8 2.69 (0.28, 5.10) 0.03 Angiography 2 1.88 (0.30, 3.46) 0.02 SPECT 1 6.00 (4.25, 7.75) <0.001
Doses
<108 4 2.77 (1.29, 4.26) 0.0002
108−109 13 2.67 (1.21, 4.13) 0.0003
>109 5 3.01 (-0.48, 6.49) 0.09
Timing
Within 24 hours 2 3.03 (-0.19, 6.24) 0.06 2−14 days 18 2.97 (1.58, 4.37) <0.001 >14 days 4 0.76 (-1.09, 2.61) 0.42
LVEDV
Modalities
MRI 11 -2.12 (-6.03, 1.79) 0.29 ECHO 7 -1.68 (-4.37, 1.01) 0.22 Angiography 2 -6.43 (-19.51, 6.64) 0.31 SPECT 1 -23.50 (-32.11, -14.89) <0.001
Doses
<108 4 -2.64 (-7.19, 1.91) 0.26
108−109 12 -6.23 (-11.73, -0.73) 0.03
>109 5 -0.19 (-3.11, 2.72) 0.90
Timing
Within 24 hours 2 -1.67 (-7.50, 4.16) 0.57 2−14 days 17 -2.91 (-6.00, 0.19) 0.07 >14 days 4 -8.90 (-22.24, 4.44) 0.19
LVESV
Modalities
MRI 11 -3.32 (-5.64, -1.00) 0.005 ECHO 5 -5.47 (-12.11, 1.17) 0.11 Angiography 2 -4.15 (-9.30, 1.01) 0.11 SPECT 1 -12.00 (-16.95, -7.05) <0.001
Doses
<108 2 -6.28 (-9.85, -2.71) 0.0006
108−109 13 -5.99 (-9.21, -2.77) 0.0003
>109 4 0.29 (-2.16, 2.74) 0.82
Timing
Within 24 hours 2 -7.58 (-19.71, 4.56) 0.22 2−14 days 16 -5.11 (-7.83, -2.39) 0.0002 >14 days 3 -3.76 (-9.31, 1.79) 0.18
[image:11.595.56.555.284.686.2]cols, patient characteristics, including age, gender, and weight, can have an influence on the effectiveness of cell therapy in STEMI patients. Future evaluations should put these factors into consideration. Our study only applied surrogate markers (LVEF, LVEDV, and LVESV) to estimate the therapeutic effect of BMMC. Despite the advantages of surrogate markers in the assessment of disease mechanisms, drug effect, and disease response, their use remains under scrutiny following the lack of some of the most reliable markers to predict clinical benefit of therapeutic interventions.42 A meta-analysis reported that BMC therapy was associated with long-term clinical benefits, such as all-cause mortality, although the effects on LV func-tion and volumes were modest in short-term analyses.10 Fu-ture clinical trials should include clinical follow-up outcomes to validate the efficacy of cell therapy.
In conclusion, intracoronary infusion of BMMC leads to improvement of LVEF and reduction of LVESV, which indi-cates that cell therapy has a positive effect on LV function and can ameliorate adverse LV remolding. Further larger random-ized multicenter trials with different cell types, injection meth-ods, and timing and number of cell infusions are required to attain more accurate clinical evidence of cell therapy on STEMI.
ORCID
Jingyi Zhang https://orcid.org/0000-0002-4071-3596
Wenxia Zong https://orcid.org/0000-0002-7112-9173
REFERENCES
1. Lang CI, Wolfien M, Langenbach A, Müller P, Wolkenhauer O, Ya-vari A, et al. Cardiac cell therapies for the treatment of acute myo-cardial infarction: a meta-analysis from mouse studies. Cell Physiol Biochem 2017;42:254-68.
2. Asahara T, Murohara T, Sullivan A, Silver M, van der Zee R, Li T, et al. Isolation of putative progenitor endothelial cells for angiogen-esis. Science 1997;275:964-7.
3. Orlic D, Kajstura J, Chimenti S, Jakoniuk I, Anderson SM, Li B, et al. Bone marrow cells regenerate infarcted myocardium. Nature 2001; 410:701-5.
4. Strauer BE, Brehm M, Zeus T, Gattermann N, Hernandez A, Sorg RV, et al. [Intracoronary, human autologous stem cell transplan-tation for myocardial regeneration following myocardial infarc-tion]. Dtsch Med Wochenschr 2001;126:932-8.
5. Stamm C, Westphal B, Kleine HD, Petzsch M, Kittner C, Klinge H, et al. Autologous bone-marrow stem-cell transplantation for myo-cardial regeneration. Lancet 2003;361:45-6.
6. Assmus B, Schächinger V, Teupe C, Britten M, Lehmann R, Döbert N, et al. Transplantation of progenitor cells and regeneration en-hancement in acute myocardial infarction (TOPCARE-AMI). Cir-culation 2002;106:3009-17.
7. Fisher SA, Zhang H, Doree C, Mathur A, Martin-Rendon E. Stem cell treatment for acute myocardial infarction. Cochrane Database Syst Rev 2015;9:CD006536.
8. de Jong R, Houtgraaf JH, Samiei S, Boersma E, Duckers HJ. Intra-coronary stem cell infusion after acute myocardial infarction: a meta-analysis and update on clinical trials. Circ Cardiovasc Interv 2014;7:156-67.
9. Gyöngyösi M, Wojakowski W, Lemarchand P, Lunde K, Tendera M, Bartunek J, et al. Meta-Analysis of Cell-based CaRdiac stUdiEs (ACCRUE) in patients with acute myocardial infarction based on individual patient data. Circ Res 2015;116:1346-60.
10. Lee SH, Hong JH, Cho KH, Noh JW, Cho HJ. Discrepancy between short-term and long-term effects of bone marrow-derived cell therapy in acute myocardial infarction: a systematic review and meta-analysis. Stem Cell Res Ther 2016;7:153.
11. Hristov M, Heussen N, Schober A, Weber C. Intracoronary infusion of autologous bone marrow cells and left ventricular function af-ter acute myocardial infarction: a meta-analysis. J Cell Mol Med 2006;10:727-33.
12. Assmus B, Leistner DM, Schächinger V, Erbs S, Elsässer A, Haber-bosch W, et al. Long-term clinical outcome after intracoronary ap-plication of bone marrow-derived mononuclear cells for acute myocardial infarction: migratory capacity of administered cells determines event-free survival. Eur Heart J 2014;35:1275-83. 13. Beitnes JO, Gjesdal O, Lunde K, Solheim S, Edvardsen T, Arnesen
H, et al. Left ventricular systolic and diastolic function improve after acute myocardial infarction treated with acute percutaneous coronary intervention, but are not influenced by intracoronary in-jection of autologous mononuclear bone marrow cells: a 3 year se-rial echocardiographic sub-study of the randomized-controlled ASTAMI study. Eur J Echocardiogr 2011;12:98-106.
14. Benedek I, Bucur O, Benedek T. Intracoronary infusion of mono-nuclear bone marrow-derived stem cells is associated with a lower plaque burden after four years. J Atheroscler Thromb 2014;21: 217-29.
15. Cao F, Sun D, Li C, Narsinh K, Zhao L, Li X, et al. Long-term myo-cardial functional improvement after autologous bone marrow mononuclear cells transplantation in patients with ST-segment el-evation myocardial infarction: 4 years follow-up. Eur Heart J 2009;30:1986-94.
16. Colombo A, Castellani M, Piccaluga E, Pusineri E, Palatresi S, Lon-gari V, et al. Myocardial blood flow and infarct size after CD133+ cell injection in large myocardial infarction with good recanaliza-tion and poor reperfusion: results from a randomized controlled trial. J Cardiovasc Med (Hagerstown) 2011;12:239-48.
17. Dill T, Schächinger V, Rolf A, Möllmann S, Thiele H, Tillmanns H, et al. Intracoronary administration of bone marrow-derived pro-genitor cells improves left ventricular function in patients at risk for adverse remodeling after acute ST-segment elevation myocar-dial infarction: results of the Reinfusion of Enriched Progenitor cells And Infarct Remodeling in Acute Myocardial Infarction study (REPAIR-AMI) cardiac magnetic resonance imaging substudy. Am Heart J 2009;157:541-7.
18. Hirsch A, Nijveldt R, van der Vleuten PA, Tijssen JG, van der Gies-sen WJ, Tio RA, et al. Intracoronary infusion of mononuclear cells from bone marrow or peripheral blood compared with standard therapy in patients after acute myocardial infarction treated by pri-mary percutaneous coronary intervention: results of the random-ized controlled HEBE trial. Eur Heart J 2011;32:1736-47.
19. Hu X, Huang X, Yang Q, Wang L, Sun J, Zhan H, et al. Safety and efficacy of intracoronary hypoxia-preconditioned bone marrow mononuclear cell administration for acute myocardial infarction patients: The CHINA-AMI randomized controlled trial. Int J Car-diol 2015;184:446-51.
20. Huang R, Yao K, Sun A, Qian J, Ge L, Zhang Y, et al. Timing for in-tracoronary administration of bone marrow mononuclear cells after acute ST-elevation myocardial infarction: a pilot study. Stem Cell Res Ther 2015;6:112.