selection: ReliefF(-k) or extended
Correlation-based Feature Selection(eCFS)?
Antonio J. Tall´on-Ballesteros1, Lu´ıs Cavique2, and Simon Fong3 1
Department of Electronic, Computer Systems and Automation Engineering. University of Huelva, Huelva, Spain
2 Universidade Aberta, Lisboa, Portugal 3
Department of Computer and Information Science. University of Macau, Taipa, Macau SAR, China
Abstract. This paper tackles problems where attribute selection is not only able to choose a few features but also to achieve a low performance classification in terms of accuracy compared to the full attribute set. Correlation-based feature selection (CFS) has been set as the baseline attribute subset selection due to its popularity and high performance. Around hundred data sets have been collected and submitted to CFS; then the problems fulfilling simultaneously the conditions: a) a number of selected attributes lower than six and b) a percentage of selected at-tributes lower than a forty per cent, have been tested onto two directions. Firstly, in the scope of data selection at the feature level, some options proposed in a prior work as well as an advanced contemporary approach have been conducted. Secondly, the data-preprocessed and initial prob-lems have been tested with some sturdy classifiers. Moreover, this work introduces a new taxonomy of feature selection according to the solution type and the followed way to compute it. The test bed comprises seven problems, three out of them report a single selected attribute, another one with two extracted features and the three remaining data sets with four or five retained attributes, all of them by CFS; additionally, the feature set is between six and twenty nine and the complexity of the problems, in terms of classes, fluctuates between two and twenty one, throwing averages of sixteen and around five for both aforementioned properties. The contribution concluded that the advanced procedure is suitable for problems where only one or two attributes are selected by CFS; for data sets with more than two selected features the baseline method is preferable to the advanced one, although the considered fea-ture ranking method achieved intermediate results.
Keywords: Machine learning, correlation, feature subset selection, fea-ture ranking, extended feafea-ture subset selection
1
Introduction
Data pre-processing [15] is a major step inside CRISP-DM (CRoss Industry Standard Process for Data Mining, [17]) which is by its part integrated into Data Engineering [4]. Pre-processing aims at transforming the raw input data into an appropriate format for subsequent analysis [2]; because of the many ways data can be collected and store, data pre-processing is perhaps the most laborious and time-consuming [15] step in the overall CRISP-DM process.
This paper addresses the scenario reached when Correlation-based Feature Selection is able to only extract a few attributes and goals to mitigate this prob-lem via proposing a new feature selection method as well as using contemporary strategies. The rest of this paper is organised as follows: Section 2 provides a brief background. Section details the proposed procedure. Section 4 explains the experimentation via the algorithms, data preparation methods and their setting. Section 5 details and analyses the results. Finally, Section 6 states the conclu-sions
2
Background
The motivation to reduce the dimensionality of the feature space is closely related to the decreased time required to double information in the world every year. Surveys on feature selection methods can be found in [9]. The aim of feature selection is to find a subset of the attributes from the original set which are representative enough for the data, and the attributions in the subset are highly relevant to the prediction.
There are three basic models in feature selection: Filter, Wrapper and Hybrid model. In the Filter model the most popular independent criteria are consistency measures, distance measures, correlation measures and information measures. The Wrapper model is divided into two steps, but with strong interaction be-tween the feature selection phase and the learning phase, where the results of the prediction are used as a criterion of feature choice. Hybrid methods have been proposed to reduce features in classification by combining the advantages of the two previous methods.
3
The proposed approach
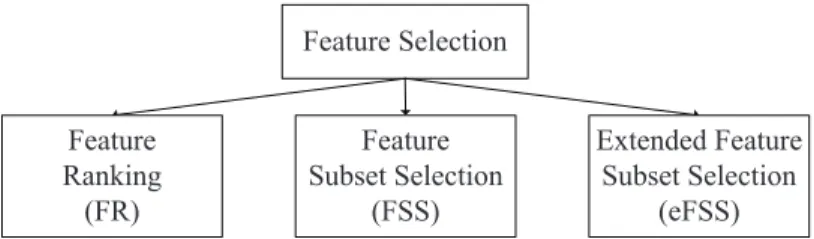
This contribution introduces a new possibility in the classical taxonomy of fea-ture selection according to the generation procedure which is inherently tied to the solution type. The traditional options are feature ranking and feature subset selection. Supported by the concept of logical complement which is a very con-venient operator in the branch of logic, the category of extended Feature Subset Selection (eFSS) is proposed, which comprises the combination of features that are extracted both the application of feature subset selection with the initial feature set and those features retained from the logical complement of the prior feature selection, i.e., the features which have not been selected from the first
step of feature selection. Basically, the new type of method is the application of a particular method of feature subset selection more than once with feature spaces overlapped partially. Figure 1 depicts the whole taxonomy of feature selection according to the operation mode as well as the solution type.
The current paper addresses how to cope with data sets where feature subset selection based on correlation only select a few attributes. Particularly, we focus on CFS method which is one the most outstanding methods in the data mining research. CFS may fail to select relevant features, however, when data contains strongly interacting features or features with values predictive of a small area of the instance space. Sometimes, CFS may retain a number of attributes lower or equal than five. A problem which described by one attribute and the label class may be thought not to be very interesting in terms of predictability; if for any unseen sample we need only one property to distinguish the class, two possible scenarios may happen: the first means that we are dealing with a very simple problem or the second represents an inaccurate application of feature selection. The reason which motivates us is the analysis of the complementary reduced set. After the application of the second step of feature subset selection on the negation reduced set, some extra features may be considered as relevant. In this way, we are dividing the search space and separating some potential interacting attributes. Moreover, instead of keeping a stand alone in the feature subset methods, the feature ranking approaches may be very suitable for the scenarios where FSS only retains a few attributes. Concretely, under this context the method ReliefF(-k) [13] -also named as Leave-k-out ReliefF- showed to be a good tool in the sense that some previous experiments where conducted and the behaviour was very acceptable. The values for k needed to be determined empirically, although the preliminary study is now very useful because we can compare a new method with one already published and initially tuned. The scope of this paper considers problems where feature subset selection via CFS is only able to choose between one and five features and additionally that the percentage of selected attributes is below a forty per cent. The last factor is taken into account to avoid especially data sets where the percentage of selected attributes is not in the range from almost the half feature set up to a close value to the whole feature set. Returning to the idea of applying a feature subset selection more than once, in a very paper we proposed a similar method to characterise the features as essential and important; nonetheless the scope is different because our purpose was to establish different levels in the pyramid of features according to the importance and also to assess the synergy that may be created from the interaction between essential and important features [12]. We deep more into eFSS in the context of CFS and we propose the method extended Correlation- based Feature Selection (eCFS) which is an extension of the original CFS method, a very prolific procedure which was introduced 20 years ago by Mark A. Hall [8].
!"#$%!&'!(!)#*+, -.#!,/!/& !"#$%!& '$01!#&'!(!)#*+,& 2! ''3 !"#$%!& '$01!#&'!(!)#*+,& 2 ''3 !"#$%!& 4",5*,6 2 43
Fig. 1.Taxonomy of feature selection methods according to the operation mode and solution type.
4
Experimentation
Several classifiers have been used to assess the current proposal. The machine learning algorithms, which have been chosen, belong to different typologies ac-cording to the way to represent the knowledge. As decision tree learner, the clas-sifier is C4.5 [10] which is an extension of the popular ID3 algorithm [11], one the classical approaches inside Artificial Intelligence. As lazy learning method, the candidate 1NN [1] which is a subtype of the algorithm k-nearest neighbours [5]. PART (PARTial Decision Tree) [6] is the option within the methods based on decision rules. Finally, SVM (Support Vector Machines) is a classifier which creates a hyperplane or set of hyper-planes [16]. From the above classifiers, C4.5 and 1NN has been tested traditionally in the scope of feature selection in several works such as a PhD Theses [8] or surveys [3]; additionally, the two aforemen-tioned methods as well as the classifiers PART and SVM have been tested in a personal review about feature selection which was dated in 2016 [14].
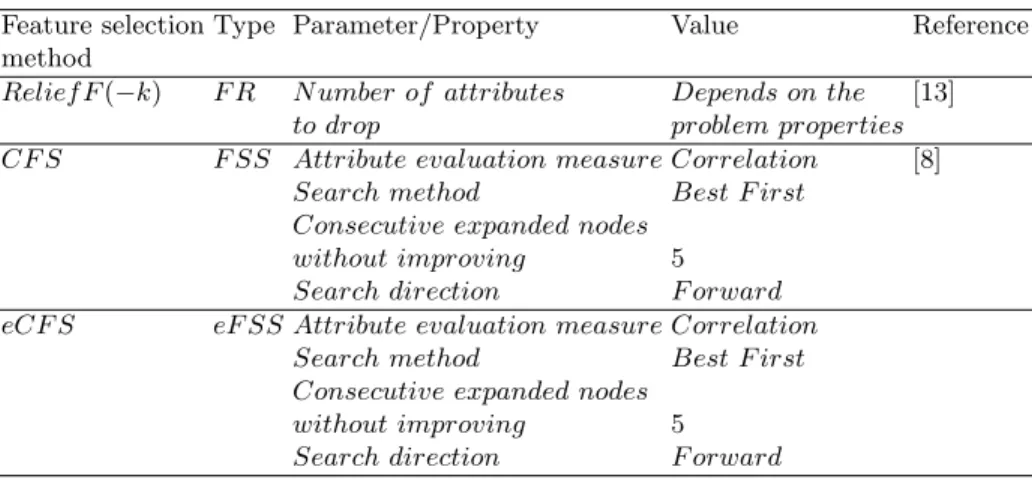
As feature selection methods, we have considered CFS and ReliefF(-k) as the baseline procedures. ReliefF(-k) is based on the Weka implementation of Reli-efF. The current proposal took CFS as the supporting and hence has been also implemented under the Weka (Waikato Environment for Knowledge Analysis) framework [7] which is an open source software created and maintained by the University of Waikato in New Zealand. For the classifiers we have conducted all the experiments with the default values since these are the recommendation of the own authors of the algorithms. Table 1 describes the setting of the at-tribute selection methods as well as some remarkable properties available in the implementations provided by the workbench Weka.
The test bed includes seven data sets available at the repository maintained by the University of California at Irvine which has been partitioned following a stratified hold-out procedure with three and one quarters, respectively for the training and testing sets. Table 2 gives count about the problems along with its properties; the rows are sorted in ascendent order for the number of features selected and then the number of labels.
Table 1.Feature selection procedures used in the experimentation
Feature selection Type Parameter/Property Value Reference
method
Relief F(−k) F R N umber of attributes Depends on the [13] to drop problem properties CF S F SS Attribute evaluation measure Correlation [8]
Search method Best F irst Consecutive expanded nodes
without improving 5 Search direction F orward eCF S eF SS Attribute evaluation measure Correlation
Search method Best F irst Consecutive expanded nodes
without improving 5 Search direction F orward
Table 2.Classification data sets
Data set Samples Labels F eatures
T otal T raining T esting N umber Selected percentage Original CF S eCF S CF S eCF S
Liver 345 259 86 2 6 1 2 16.7 33.3 Lenses 24 18 6 3 6 1 2 16.7 33.3 P ost−op 90 67 23 3 20 1 2 5.0 10.0 Hypo 3772 2829 943 4 29 2 4 6.9 13.8 Breast 286 215 71 2 15 4 5 26.7 33.3 Smoking 2855 2141 714 3 13 5 10 38.5 76.9 P rimary−tumor339 251 88 21 23 5 6 21.7 26.1 Average 1101.6 825.7 275.9 5.4 16.0 2.7 4.4 18.9 32.4
5
Results
This section reports the results which are measured in test accuracy. From the whole test-bed two different scenarios have been created to characterise, follow and understand the proposal. Firstly, we show the results for data sets where CFS extracts one or two features. Secondly, problems, where CFS retain more than two attributes and up to five, are analysed.
Table 3 details the results in the landscape where the final feature set after CFS comprises one or a couple of attributes. We have represented the results with the full feature set, after CFS as well as some variations of the method ReliefF(-k) -or R(-k) to shorten within the table- and the proposed method eCFS. It is of particular interest to mention that the alternative/s where chosen as where proposed as the recommendation is a previous contribution published in 2017. Moreover, in specific cases an extra alternative has been considered to compared the performance of eCFS, an eFSS method, with a solution with the same complexity based on FR such as ReliefF(-k). Just to have a global appear-ance, we have included a pairwise comparison. We have not represented the ties since there is a good number of them; we have included instead the improve-ments (+) or the deterioration (-). After the individual results for each problem and classifier, the average is computed to have other kind of value to compare more concretely. As eCFS is and enhanced version of CFS, we have compared the former and the latter, in this order, and the letter B in the row entitled Ind. Avg. (individual average) means that the first method (eCFS) is better than (CFS) in terms of average. The column with the label Summ. includes the wins, ties or losses (W/T/L) and is a very convenient metric to have a qualitative value to compare different approaches. The total row shows the global summation of the below W/T/L values. Going down in the table, we see the global and the partial averages; the first value has been obtained for the methods where all data sets have been assessed and the second one has been computed for the procedures where a subset (of at least two) of the whole test bed has been considered, e.g. R(-2) has been tested with Liver, Lenses and Post-op and hence the partial aver-ages of FULL, CFS and eCFS are useful to compare R(-2) with the competitors in the same situation. After having explained the contents of the table, it is time to provide some insights. eCFS is preferable to CFS in the situation I. By its part, conservative Relief(-k), i.e. ReliefF(-2) in the first three data sets where CFS selected one attribute or ReliefF(-3) for Hypo, is more convenient than eCFS although with a higher computation time since are discarding a couple of three attributes with Relief(-k). Additionally, eCFS gets a better than Relief(-k) with a similar complexity; clearly the advantage of eCFS is that is an almost parameter-free parameter method instead or requiring a very specific setting for different groups of data sets as ReliefF(-k) requires. In terms of classifiers and global results, eCFS is a very convenient option for 1NN, followed by C4.5 and PART with two wins; finally, for SVM only one win is got.
Table 4 shows the assessment in data sets where CFS retains four attributes, as in Breast or Smoking, or five features for Primary-tumor. The meaning of the different columns of the table is exactly as described in the previous table and we
do not repeat it due to space issues. Roughly speaking, eCFS is not able to keep, at least, same results as CFS. It represents that for problems where CFS selects more than three attributes is not undoubted that eCFS is better than CFS and a very careful analysis is hence necessary. Exceptionally, in Smoking there is one win and one loss for eCFS compared to CFS; although the average is higher for eCFS, it does not mean a better performance versus CFS as the rank-based methods assert. The good news is that eCFS performs better than Relief(-k) in global terms according to the qualitative values for the problems with four selected features by CFS. Unfortunately, for Primary-tumor the results without feature selection are better than with any dimensionality reduction procedure. It is very important to remind that there are 21 labels and 23 features in this problem which makes it very challenging. We move on to the performance of the different supervised machine learning algorithms. 1NN is the single classifier which takes advantage of eCFS compared to CFS; SVM keeps the same result twice although the third result is a loss. The remaining classifiers do not achieve competitive results and for these problems CFS is more convenient than eCFS.
6
Conclusions
This paper presented a new category inside the feature selection taxonomy, ac-cording to the generation procedure, which has been named eFSS which stands for extended FSS. As an interesting alternative to deal with problems where CFS only selects a few attributes, eCFS has been introduced. It is very noticeable that for data sets where CFS picks up one or two features eCFS is very recommend-able. On the contrary, for problems where CFS retains more than two features and up to five, eCFS is only a more convenient approach than ReliefF(-k) even with the fine-tuning for k parameter; nonetheless in this situation CFS is prefer-able to eCFS since a lower feature set is achieved and the performance is not always worse.
Acknowledgments This work has been partially subsidised by TIN2014-55894-C2-R and TIN2017-88209-C2-2-R projects of the Spanish Inter-Ministerial Com-mission of Science and Technology (MICYT), FEDER funds and the P11-TIC-7528 project of the ”Junta de Andaluc´ıa” (Spain).
8 T able 3. Situation I. T est classification results with p ossible approac hes for data sets where CFS selects one or tw o attributes D ata set C lassif ier F eatur e set P air w ise compar ison Al ter nativ e/s R emar k /s F U LL C F S R ( − 2) R ( − 3) R ( − 4) R ( − 5) eC F S eC F S eC F S v er sus v er s u s C F S Al t. 1 Al t. 2 Al t. 3 + / − S umm. + / − + / − + / − Liv er C 4 . 5 68 . 60 58 . 14 68 . 60 58 . 14 58 . 14 − R ( − 2) Al t. 2 : R ( − 4) 1 N N 61 . 63 39 . 53 54 . 65 51 . 16 54 . 65 + + simil ar compl exity P AR T 61 . 63 58 . 14 68 . 60 58 . 14 58 . 14 − to eC F S S V M 58 . 14 58 . 14 58 . 14 58 . 14 58 . 14 I nd. Av g . 62 . 50 53 . 49 62 . 50 56 . 40 57 . 27 B 1 / 3 / 0 Lenses C 4 . 5 66 . 67 50 . 00 66 . 67 66 . 67 66 . 67 + R ( − 2) Al t. 2 : R ( − 4) simil 1 N N 16 . 67 50 . 00 83 . 33 66 . 67 66 . 67 + − compl exity to eC F P AR T 66 . 67 50 . 00 66 . 67 66 . 67 66 . 67 + R ( − 4) sel ects same S V M 66 . 67 50 . 00 83 . 33 66 . 67 66 . 67 + − f eatur es as eC F S I nd. Av g . 54 . 17 50 . 00 75 . 00 66 . 67 66 . 67 B 4 / 0 / 0 P ost − op C 4 . 5 52 . 17 56 . 52 52 . 17 52 . 17 56 . 52 + + R ( − 2) Al t. 2 : R ( − 4) 1 N N 56 . 52 4 . 35 56 . 52 56 . 52 8 . 70 + − − simil ar compl exity P AR T 65 . 22 56 . 52 56 . 52 56 . 52 56 . 52 to eC F S S V M 56 . 52 56 . 52 56 . 52 56 . 52 56 . 52 I nd. Av g . 57 . 61 43 . 48 55 . 43 55 . 43 44 . 57 B 1 / 3 / 0 H y po C 4 . 5 99 . 15 96 . 92 99 . 26 99 . 26 98 . 94 97 . 56 + − − − R ( − 3) , R ( − 4) , R ( − 5) 1 N N 90 . 99 96 . 50 90 . 88 90 . 99 90 . 88 95 . 44 − + + + P AR T 98 . 83 96 . 92 98 . 83 98 . 83 98 . 73 97 . 35 + − − − S V M 93 . 85 93 . 32 93 . 85 93 . 85 93 . 85 93 . 32 − − − I nd. Av g . 95 . 70 95 . 92 95 . 71 95 . 73 95 . 60 95 . 92 2 / 1 / 1 T otal 8 / 7 / 1 Gl obal Av g . C 4 . 5 71 . 65 65 . 40 69 . 06 69 . 72 + 2 / 2 / 0 1 N N 56 . 45 47 . 60 66 . 33 56 . 36 + 3 / 0 / 1 P AR T 73 . 09 65 . 40 70 . 04 69 . 67 + 2 / 2 / 0 S V M 68 . 79 64 . 50 68 . 79 68 . 66 + 1 / 3 / 0 P ar tial A v g . C 4 . 5 62 . 48 54 . 89 62 . 48 60 . 44 + 1 N N 44 . 94 31 . 29 64 . 83 43 . 34 + P AR T 64 . 50 54 . 89 63 . 93 60 . 44 + S V M 60 . 44 54 . 89 66 . 00 60 . 44 + R ( − k ) stands f or R el ief F ( − k ) w her e k is a positiv e v al ue. Al t. r epr esents an al ter nativ e + means impr ov ement and − means d eter ior ation. B means B etter . S umm. is a summar y w hich is expr essed as W /T /L
9 T able 4. Situation II. T est classification results with p ossible approa ches for data sets where CFS selects more th an three attributes and less or equal than fiv e D ata set C lassif ier F eatur e set P air w ise compar ison Al ter nativ es R emar k F U LL C F S R ( − 2) R ( − 3) R ( − 4) R ( − 5) eC F S eC F S eC F S v er sus v er sus C F S Al t. 1 Al t. 2 Al t. 3 + / − S umm. + / − + / − + / − B r east C 4 . 5 70 . 42 69 . 01 70 . 42 70 . 42 70 . 42 64 . 79 − − − − R ( − 2) , R ( − 3) , R ( − 4) 1 N N 64 . 79 70 . 42 67 . 61 69 . 01 69 . 01 70 . 42 + + + P AR T 69 . 01 71 . 83 64 . 79 63 . 38 67 . 61 70 . 42 − + + + S V M 64 . 79 66 . 20 66 . 20 66 . 20 64 . 79 66 . 20 + I nd. Av g . 67 . 25 69 . 37 67 . 25 67 . 25 67 . 96 67 . 96 W or se 0 / 2 / 2 S mok ing C 4 . 5 68 . 63 69 . 47 67 . 65 69 . 47 69 . 47 69 . 47 + R ( − 2) , R ( − 3) , R ( − 4) 1 N N 54 . 76 38 . 52 56 . 86 50 . 28 50 . 14 50 . 28 + − + P AR T 61 . 48 67 . 36 62 . 75 61 . 76 66 . 11 62 . 18 − − + − S ummation f S V M 69 . 47 69 . 47 69 . 47 69 . 47 69 . 47 69 . 47 the al ter nativ I nd. Av g . 63 . 59 61 . 20 64 . 18 62 . 75 63 . 80 62 . 85 B etter 1 / 2 / 1 3 / 2 / 3 3 / 4 / 1 4 / 2 / 2 W /T /L : 10 / 8 P r imar y − tumor C 4 . 5 45 . 46 42 . 05 40 . 91 40 . 91 43 . 18 40 . 91 − − R ( − 3) , R ( − 4) , R ( − 5) 1 N N 36 . 36 30 . 68 36 . 36 37 . 50 37 . 50 30 . 68 − − − P AR T 43 . 18 42 . 05 40 . 91 39 . 77 38 . 64 38 . 64 − − − S V M 47 . 72 42 . 05 48 . 86 48 . 86 47 . 73 40 . 91 − − − − I nd. Av g . 43 . 18 39 . 20 41 . 76 41 . 76 41 . 76 37 . 78 W or se 0 / 1 / 3 T otal 1 / 5 / 6 Gl obal Av g . C 4 . 5 61 . 50 60 . 18 60 . 27 60 . 27 58 . 39 − 0 / 1 / 2 1 N N 51 . 97 46 . 54 51 . 88 52 . 22 50 . 46 + 1 / 2 / 0 P AR T 57 . 89 60 . 41 55 . 35 57 . 83 57 . 08 − 0 / 0 / 3 S V M 60 . 66 59 . 24 61 . 51 61 . 04 58 . 86 − 0 / 2 / 1 P ar tial A v g . C 4 . 5 61 . 50 60 . 18 69 . 03 1 N N 51 . 97 46 . 54 62 . 23 P AR T 57 . 89 60 . 41 63 . 77 S V M 60 . 66 59 . 24 67 . 83 R ( − k ) stands f or R el ief F ( − k ) w her e k is a positiv e v al ue. Al t. r epr esents an al ter nativ e + means impr ov ement and − means deter ior ation. S u m m. is a summar y w hich is expr essed as W /T /L
References
1. D.W. Aha, D. Kibler, and M.K. Albert. Instance-based learning algorithms.
Ma-chine learning, 6(1):37–66, 1991.
2. B Bilalli, A Abell´o, T Aluja-Banet, and R Wrembel. Intelligent assistance for data pre-processing. Computer Standards & Interfaces, 57:101–109, 2018.
3. Y Chen, Y Li, X-Q Cheng, and i Guo. Survey and taxonomy of feature selection algorithms in intrusion detection system. InInternational Conference on Informa-tion Security and Cryptology, pages 153–167. Springer, 2006.
4. S-B Cho and A J Tall´on-Ballesteros. Visual tools to lecture data analytics and
engineering. InInternational Work-Conference on the Interplay Between Natural
and Artificial Computation, pages 551–558. Springer, 2017.
5. T. Cover and P. Hart. Nearest neighbor pattern classification.Information Theory, IEEE Transactions on, 13(1):21–27, 1967.
6. E Frank and I H Witten. Generating accurate rule sets without global optimization.
In J. Shavlik, editor, Fifteenth International Conference on Machine Learning,
pages 144–151. Morgan Kaufmann, 1998.
7. M Hall, E Frank, G Holmes, B Pfahringer, P Reutemann, and I H Witten. The
weka data mining software: an update. ACM SIGKDD explorations newsletter,
11(1):10–18, 2009.
8. M A Hall. Correlation-based feature selection for machine learning. PhD thesis, University of Waikato, Hamilton, New Zealand, 1999.
9. J Miao and L Niu. A survey on feature selection. Procedia Computer Science,
91:919–926, 2016.
10. J R Quinlan. C4.5: programs for machine learning, volume 1. Morgan kaufmann,
1993.
11. A Shapiro and T Niblett. Automatic induction of classification rules for a chess endgame. InAdvances in computer chess, pages 73–92. Elsevier, 1982.
12. A J Tall´on-Ballesteros, L Correia, and B Xue. Featuring the attributes in super-vised machine learning. In International Conference on Hybrid Artificial Intelli-gence Systems, pages 350–362. Springer, 2018.
13. A J Tall´on-Ballesteros and J C Riquelme. Low dimensionality or same subsets
as a result of feature selection: an in-depth roadmap. In International
Work-Conference on the Interplay Between Natural and Artificial Computation, pages 531–539. Springer, 2017.
14. A J Tall´on-Ballesteros, J C Riquelme, and R Ruiz. Merging subsets of attributes to improve a hybrid consistency-based filter: a case of study in product unit neural networks. Connection Science, 28(3):242–257, 2016.
15. P-N Tan. Introduction to data mining. Pearson Education India, 2018.
16. V.N. Vapnik. The nature of Statistical Learning Theory. Springer, 1995.
17. R. Wirth and J. Hipp. Crisp-dm: Towards a standard process model for data min-ing. InProceedings of the 4th international conference on the practical applications of knowledge discovery and data mining, pages 29–39. Citeseer, 2000.