University of Windsor University of Windsor
Scholarship at UWindsor
Scholarship at UWindsor
Electronic Theses and Dissertations Theses, Dissertations, and Major Papers
7-7-2020
An Approach of SLA Violation Prediction and QoS Optimization
An Approach of SLA Violation Prediction and QoS Optimization
using Regression Machine Learning Techniques
using Regression Machine Learning Techniques
Saurav AgarwalUniversity of Windsor
Follow this and additional works at: https://scholar.uwindsor.ca/etd
Recommended Citation Recommended Citation
Agarwal, Saurav, "An Approach of SLA Violation Prediction and QoS Optimization using Regression Machine Learning Techniques" (2020). Electronic Theses and Dissertations. 8342.
https://scholar.uwindsor.ca/etd/8342
This online database contains the full-text of PhD dissertations and Masters’ theses of University of Windsor students from 1954 forward. These documents are made available for personal study and research purposes only, in accordance with the Canadian Copyright Act and the Creative Commons license—CC BY-NC-ND (Attribution, Non-Commercial, No Derivative Works). Under this license, works must always be attributed to the copyright holder (original author), cannot be used for any commercial purposes, and may not be altered. Any other use would require the permission of the copyright holder. Students may inquire about withdrawing their dissertation and/or thesis from this database. For additional inquiries, please contact the repository administrator via email
An Approach of SLA Violation Prediction and QoS
Optimization using Regression Machine Learning Techniques
By
Saurav Agarwal
A Thesis
Submitted to the Faculty of Graduate Studies through Computer Science
In Partial Fulfillment of the Requirements for the Degree of Master of Science
at the University of Windsor
Windsor, Ontario, Canada 2020
An Approach of SLA Violation Prediction and QoS
Optimization using Regression Machine Learning Techniques
by
Saurav Agarwal
APPROVED BY:
_______________________________________ H. Wu
Department of Electrical and Computer Engineering
______________________________________________ J. Lu
School of Computer Science
______________________________________________ X. Yuan, Advisor
School of Computer Science
DECLARATION OF ORIGINALITY
I hereby certify that I am the sole author of this thesis and that no part of this thesis has been published or submitted for publication.
I certify that, to the best of my knowledge, my thesis does not infringe upon anyone’s copyright nor violate any proprietary rights. Any ideas, techniques, quotations, or any other material from the work of other people included in my thesis, published or otherwise, are fully acknowledged in accordance with the standard referencing practices. Furthermore, to the extent that I have included copyrighted material that surpasses the bounds of fair dealing within the meaning of the Canada Copyright Act, I certify that I have obtained a written permission from the copyright owner(s) to include such material(s) in my thesis and have included copies of such copyright clearances to my appendix.
I declare that this is a true copy of my thesis, including any final revisions, as approved by my thesis committee and the Graduate Studies office and that this thesis has not been submitted for a higher degree to any other University or Institution.
iv
ABSTRACT
Along with the acceptance of Service-Oriented Architecture (SOA) as a promising style of software design, the role that Quality of Service (QoS) plays in the success of SOA-based software systems has become much more significant than ever before. When QoS is documented as a Service-Level Agreement (SLA), it specifies the commitment between a service provider and a client, as well as monetary penalties in case of any SLA violations. To avoid and reduce the situations that may cause SLA violations, service providers need tools to intuitively analyze if their service design provokes SLA violations and to automatically guide them preventing SLA violations. Due to the dynamic nature of service interaction during the operation of SOA-based software systems, the avoidance of SLA violations requires prompt detection of potential violations before prevention takes place at real-time. To overcome the low latency time in practice, this thesis research develops an approach of using Machine Learning techniques to not only predict SLA violations but also prevent them by means of optimization. This research discusses the algorithm and framework, along with the results of the experiments, which will help to examine its usefulness for service providers working on the construction and refinement of services.
DEDICATION
Dedicated to God, my grandparents, my beloved mummy and papa without whose support, I would not have made it this far, my loving brother, my supportive sister-in-law, my girlfriend, my adorable nephew, and the rest of my family and friends.
vi
ACKNOWLEDGEMENTS
First and foremost, I would like to express profound thankfulness to my supervisor, Dr. Xiaobu Yuan, who has supported me throughout my thesis with his knowledge and expertise on this exciting field of research. His ideas and suggestions have helped me become more creative, without which I would not have been able to complete this research.
I would like to offer my sincere gratitude to the advisory group members, Dr. Jianguo Lu and Dr. Huapeng Wu for their significant remarks and recommendations for my research.
I would like to thank all my friends especially Rajasi and Anjali, who have supported and helped me throughout my studies, here in Canada. I also thank my brother and sister-in-law for their motivation and financial support which enabled me to complete my studies successfully.
TABLE OF CONTENTS
DECLARATION OF ORIGINALITY ... iii
ABSTRACT ... iv
DEDICATION... v
ACKNOWLEDGEMENTS... vi
LIST OF TABLES ... ix
LIST OF ABBREVIATIONS/SYMBOLS... x
LIST OF FIGURES ... xii
CHAPTER 1 INTRODUCTION ... 1
1.1 Overview ... 1
1.2 Motivation and Problem Statement ... 3
1.3 Thesis Contributions ... 4
1.4 Organization of this Thesis ... 5
CHAPTER 2 SERVICE ORIENTED ARCHITECTURE ... 6
2.1 Web Service ... 8
2.2 Quality of Service (QoS) ... 10
2.3 Service Level Agreements ... 11
2.3.1SLA Managements Life Cycle ... 14
2.3.2Cause of SLA Violations... 16
CHAPTER 3 PREDICTION MODELS ... 17
3.1Terminology ... 17
3.2Supervised Machine Learning: Concepts and Definitions ... 18
3.2.1Learning ... 19
3.2.2Classification ... 19
3.2.3Regression ... 19
3.3Generalization ... 20
3.3.1Bias-Variance Trade off ... 20
3.3.2Cross Validation ... 21
3.4Performance Evaluation ... 22
3.4.1Root Mean Square Error (RMSE) ... 22
3.4.2Mean Absolute Error (MAE) ... 23
3.4.3R2 ... 24
3.4.4Adjusted R2 ... 25
viii
4.1SLA Violation Prediction ... 27
4.2SLA Violation Prevention ... 28
4.3Related Work ... 30
CHAPTER 5 PROPOSED METHODOLOGY ... 35
5.1Data Analysis ... 38
5.2 SLA Violation Prediction ... 41
5.2.1 Fitted Model with Machine Learning... 45
5.3 SLA Violation Prevention ... 47
5.3.1 Heatmaps ... 49
5.3.2 Process of SLA Prevention ... 50
5.4 Manual vs Automated Unified Framework of SLA prevention ... 51
CHAPTER 6 IMPLEMENTATION AND EXPERIMENTS ... 54
6.1Environments and Toolkits ... 54
6.2 A Unified Framework Model Experiments ... 55
6.2.1 Data Analysis ... 55
6.2.2 SLA Violation Prediction ... 59
6.2.3 SLA Violation Prevention ... 68
6.3 Comparison and Discussion ... 71
CHAPTER 7 CONCLUSION AND FUTURE WORK ... 73
7.1 Conclusion ... 73
7.2 Future work ... 73
REFERENCES ... 75
LIST OF TABLES
Table 2.1 – Components of a Web Service Level Agreement...………13
Table 2.2 – An example of infrastructure SLA………..13
Table 2.3 – An example of application SLA………….……….14
x
LIST OF ABBREVIATIONS/SYMBOLS
IT Information Technology
SOA Service Oriented Architecture
QoS Quality of Service
SLA Service Level Agreement
ML Machine Learning
CPU Central Processing Unit
SLO Service Level Objectives
WS Web Server
DB Database
RMSE Root Mean Square Error
MAE Mean Absolute Error
SVM Support Vector Machine
NN Neural Networks
LIST OF FIGURES
Figure 1.1: Service Oriented Architecture ………01
Figure 2.1: Service Oriented Architecture ………06
Figure 2.2: Relation between Service Provider & Service Consumer ………07
Figure 2.3: Web Service Architecture Diagram ………09
Figure 2.4: Three Web Service Roles ………09
Figure 2.5: SLA Management Life Cycle ……….15
Figure 3.1: Dart chart- A graphical illustration of bias-variance trade-off ………21
Figure 3.2: Test & training error as the function of model complexity ………22
Figure 3.3: RMSE – Predicted vs Observed values ………23
Figure 3.4: R-Squared Explanation ………25
Figure 5.1: A Unified Framework of SLA Violation Prediction and Prevention………37
Figure 5.2: Data Analysis………...38
Figure 5.3: SLA Violation Prediction………42
Figure 5.4: SLA Violation Prevention………48
Figure 5.5: Heatmap generated on a sample image………...50
Figure 5.6: Overall flowchart for manual vs automated process……….52
Figure 6.1: Google’s cluster trace dataset ERD……….57
Figure 6.2: Memory analysis graph………...58
Figure 6.3: CPU analysis graph………..59
Figure 6.4: R2 value comparison between all fitted models………61
Figure 6.5: Adjusted R2 value comparison between all fitted models………61
Figure 6.6: MAE value comparison between all fitted models………...61
Figure 6.7: RMSE value comparison between all fitted models ……….62
Figure 6.8: Predicted VS. Actual………66
Figure 6.9: Predicted VS. Actual for VARMAX model………67
Figure 6.10: Different influential factor values for feature imp technique………..68
Figure 6.11: Heatmap result in respect to response time……….69
Figure 6.12: ARIMAX model result with changed influential factor values ………70
Figure 6.13: Actual VS. Optimized response time value………70
1
CHAPTER 1
INTRODUCTION
1.1Overview
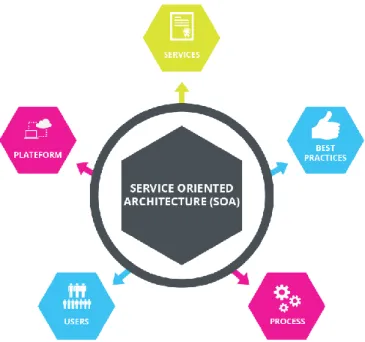
Over the last four decades, software architectures have attempted to deal with increasing levels of software complexity. As the level of complexity continues to evolve, traditional architectures do not seem to be capable of dealing with the current problems. Service-Oriented Architecture (SOA) is being advocated in the industry as the next evolutionary step in software architecture to aid IT organizations meet their complex set of challenges that traditional architectures cannot meet. A service-oriented architecture is essentially a collection of services, among which communication can involve either simple data transfer or could involve two or more services coordinating some activity, thereby requiring a means of connecting other services to each other.
In recent years, Web services have become the technology of choice for realizing Service-Oriented Architecture and its associated set of strategic goals [1]. A service is a function that is well defined, self-contained, and does not fully depend on the context or state of other services [10]. A Web Service is a software system that is designed to support interoperable machine-to-machine interaction through a network. The superiority of SOA comes from the fact that it promises the highly desired benefits of improved reusability, increased reliability, and reduced costs for development and deployment in a scalable and dynamic environment. In a service-level agreement (SLA), QoS is documented to guarantee that services fulfill their official commitments in terms of both functionality and quality [3].
"Quality of service (QoS) represents the set of those quantitative and qualitative characteristics of a distributed multimedia system necessary to achieve the required functionality of an application” [4]. In order to guarantee a basic level of QoS, careful management of IT resources is essential. Management of assets and taking care of variable volumes of client necessities are a piece of SLA between consumer and service provider. However, obeying SLA has been proven to be a challenging task as QoS is influenced by a variety of different factors. Because of variations in workload, computing resources, and even network conditions, it is common for Web services to exhibit fluctuation in performance, leading to the possibility of violating SLA [6].
QoS management includes assisting users to find the essential characteristics of the wanted service and adaptation of IT assets in such a manner that it considers SLA and enhances the system performance and efficiency. In a situation that the effective QoS doesn't conform to the base QoS concurred in SLA, the QoS manager gives a case of SLA violation. Any service provider who does not take action to prevent SLA violations will have to face monetary penalties and lost revenue due to a damaged relationship with clients [10]. Therefore, service providers are in desperate need of such tools that can not only help them in predicting if their service design provokes SLA violation, but also guides them in optimizing service design to prevent the violation from happening.
3
SLA violation forecast benefits both service providers and clients. From a service provider’s point of view, SLA violation results in paying fines in terms of both, reputations as well as money. By foreseeing the violations ahead of time, providers can re-allocate the needs and resources to avoid future violations [8]. All the process of resource allocation is done behind the scene in this manner; thus, from a client’s perspective, better resource allocation brings about a reliable supplier. Additionally, customers would like to receive the service on-demand and with no interference. Thus, a system wherein a service supplier or a third party could give the expectation of SLA infringement for the client can be exceptionally canny.
It is worth mentioning that violations do happen in the real world. For instance, Amazon Elastic Cloud confronted a blackout in 2011 when it crashed, and numerous clients, for example, Reddit and Quora, were down for more than one day [5].
1.2Motivation and Problem Statement
SOA's exceptional capacity in software development has driven ongoing work within the academic community and software industry explorations. To improve the design of Web services, encouraging progress has been achieved for the evaluation of QoS, prediction of SLA violations, and QoS optimization. For example, most of the approaches use the technique of collaborative filtering to evaluate SOA systems with historical datasets obtained from other systems running a similar application and to predict the possibility of SLA violations based upon the calculation of QoS values for existing services [48, 49, 50]. For QoS optimization, some approaches work for groups of services by maximizing aggregated utility values and others for individual services by allocating more resources [28, 29]. However, current methods still lack objective evaluation of software operating in different application domains, and their separation of related processes has resulted in limited success in practice.
A couple of recent publications proposed an innovative framework that tackles the main issues of SLA violation by combining three techniques into a unified process to analyze, predict, and prevent SLA violation [1] [2]. However, a manual process is used in their
proposed framework for an SLA prediction, which is time-consuming. It also uses a basic fitted response model, which cannot tackle complex real-world data. Furthermore, for optimization, only one controllable factor i.e. cache level is used, which will not lead to the optimization of complex systems. SLA violation prevention must be performed in real-time to detect violations quickly and hence, avoid them. However, there is a very low latency time to avoid. Thus, to tackle such a scenario, an automated technique is required.
In this thesis, we propose to utilize Machine Learning to predict and prevent SLA violations into unified framework to help service providers analyze, predict, and prevent SLA violations. Machine Learning techniques can be used to automate their proposed framework, which will eliminate many manual steps. Violation prediction and avoidance can be viewed as a regression problem in the terminology of Machine Learning. Past research mostly relies on heuristic methods for prediction of violations. Even though Machine Learning (ML) has been utilized in different territories of QoS management, the experiments done for the most part are in a confined setting, which isn't ascendable to real-world data. Nonetheless, this research adopts a systematic machine learning approach applied on real-world data that provides an insightful set of experiments. This automated process will greatly enhance other requirements in terms of availability, performance, robustness, response time, and cost.
1.3Thesis Contributions
Major contributions of this research work can be summarized as follows:
• To construct and train the system using Machine Learning techniques in a way that enables them to not only predict the SLA violations but also prevent them by optimizing the service into unified framework.
• To predict the response time of an incoming for detecting SLA violation.
• To achieve the required response time and to prevent a violation by using a multi-control optimization technique.
• To conduct a series of experiments for verifying that the proposed ML model can achieve a robust SLA violation detection and prevention efficiency, get a satisfying
5
performance and reduce the monetary cost.
1.4Organization of this thesis
In this thesis, Chapter 2 introduces the main concepts of Service Oriented Architecture and discusses the important role that service level agreements play in quality of services. Chapter 3 clarifies the terminologies and basic concepts in machine learning in which various machine learning models such as regression and classification are discussed. It also presents the method of measuring the performance of a model in machine learning. Chapter 4 presents an outline of existing contributions on SLA violation prediction; specifically, it will introduce the confinements of these contributions and how our proposed model aims to overcome them. Chapter 5 displays the proposed method that is utilized to predict and prevent SLA violations in unified framework. Chapter 6 exhibits the details of the assessment and the execution of our proposal. Finally, Chapter 7 concludes the thesis and presents future work.
CHAPTER 2
Service Oriented Architecture
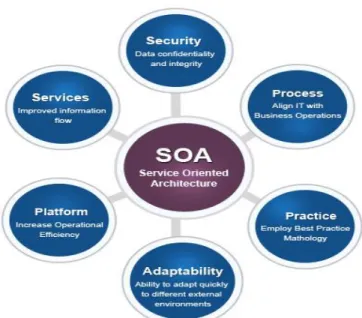
Service Oriented Architecture (SOA) is being advocated in the industry as the next evolutionary step in software architecture to aid IT organizations meet their complex set of challenges. A service-oriented architecture is essentially a collection of services, among which communication can involve either simple data transfer or could involve two or more services coordinating some activity, thereby requiring a means of connecting other services.
Figure 2.1: Service Oriented Architecture
SOA offers the much-needed benefits like easier component reuse, increased productivity, improved reliability, shorter time-to-market, and reduced deployment costs [3]. It is one of the most successful architectural styles, in which applications make use of reusable services via internet. In the next decade, the SOA principles will be at the core of a new era of business engagements that transact at Internet scale across locations, devices, people,
7
processes and information [6].
The principles of service-orientation are independent of any product, vendor or technology. SOA just makes it easier for software components over various networks to work with each other.
There are two major roles within Service-oriented Architecture:
1. Service provider: The service provider is the maintainer of the service and the organization that makes one or more services available for others to use. To advertise services, the provider can publish them in a registry, together with a service contract that specifies the nature of the service, how to use it, the requirements for the service, and the fees charged.
2. Service consumer: The service consumer has the ability to consume (use) the SOA through a program or an individual, who requests a service [3].
Figure 2.2: Relation between Service Provider and Service Consumer
Each service may be offered by various providers and can be used by one or more customers. A service consumer can be a service or application that reuses other services.
As per the SOA frameworks that service consumers are developing, they pick the most reasonable administrations from various applicants with comparable functionality and use them to make their application. A service provider, on the other hand, can be an individual or an association that creates and keeps reusable services. These services are accessible for service consumers to reuse. Competition is incredibly fierce between different service providers as there are others available consistently with the similar highlights. If a service is not fit for fulfilling service consumers in terms of quality and usefulness, service customers may surrender this service and pick another service provider [8].
2.1Web Service
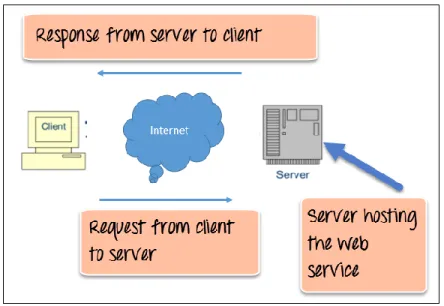
A service is a function that is well defined, self-contained and does not fully depend on the context or state of other services [10]. A Web Service is a software system that is designed to support interoperable machine-to-machine interaction through a network. The technology of Web services is most likely the go-to connection option of service-oriented architecture. Web services offer a potential solution for developing distributed business processes and applications that can be accessed via the Internet. The use of Web services in SOA systems have many benefits for the development of new applications [8]. It also has the benefits of lower cost, higher reliability, and lesser time to market for further development of new applications. There are four primary tasks in web services: publish, discovery, request, and response. Publish is a process by which a service provider announces its service as well as the service associated interfaces. Generally, a service provider announces its service by entering service information into a specialized registry [6]. The consumers of the services discover the services in various ways. Discovery is a process of finding an appropriate service that provides the required functionality. Upon discovery, the consumer requests the functionality by providing the required input. The service responds to the consumer with the desired output.
9
Figure 2.3: Web Service Architecture Diagram
The above diagram shows a very simplistic view of how a web service would work. The client invokes a series of web service calls via requests to a server that would host the actual web service.
Web services play three major roles in an SOA system:
• Service Directory
• Service Provider
• Service Consumer
With service directory acting as a centralized directory, service providers publish information of Web services for service consumers to select according to their preferences of software development. For example, a Web Service can help consumers to identify the top 10 webpage links for different e-commerce websites that offer the lowest price for a certain product [1].
2.2Quality of Service (QoS)
"Quality of service represents the set of those quantitative and qualitative characteristics of a distributed multimedia system necessary to achieve the required functionality of an application" [4]. QoS plays an important role in service selection in an SOA environment. It specifies how a component is supposed to behave. Through QoS, consumers can select an SOA service provider based on the quality of service. As more competitive web services have become available for the consumers, QoS has become a decisive factor to distinguish the reputation of various service providers [11]. By estimating the QoS of a system, the performance can be enhanced and guaranteed ahead of time. Subsequently, QoS measurement expands the dependability and accessibility of the system. In SOA systems, QoS is a fundamental viewpoint, as service consumers’ needs to have a measure of the service performance and a service provider needs to find the best exchange off between the provided service and the expense.
QoS manager distributes different measures of resources (CPU, memory, or storage) and further decides the agreements in SLA based on four sources of information: (1) The accessible resources of the computing system, (2) The requested IT resources for each user task, (3) Information about the least possible QoS agreed in SLA, and (4) The historical information about the system’s load. QoS manager, usually using a heuristic method, decides how to prevent SLA violation. For example, in the application of video streaming such as YouTube, the QoS manager may delay the video by a couple of moments to buffer and prevent interruption in the middle of the video. On the other hand, in some other applications such as video conference of Google Hangouts, in which significant delay is
11
not tolerable, QoS manager may diminish the resolution of the video or the sound quality to avoid any violation of the service [13]. Hence, it is necessary to be able to forecast when an SLA violation may happen beforehand.
At the infrastructure level of computing, several QoS parameters can be measured as stated below [14]:
• Compute: outage length, availability, server reboot time
• Network: packet loss, availability, latency, mean/max jitter, bandwidth
• Storage: input/output per second, availability, processing time, max restore time, latency with internal compute resource.
Service providers guarantee the QoS with Service Level Agreements (SLAs). We discuss the definition of SLA and SLA management life cycle in the following sections.
2.3Service Level Agreements
The association between a service provider and a customer is governed with a Service Level Agreement (SLA). SLA is negotiated between parties and a level of the service, QoS and its related expenses are agreed upon. SLA is an official document of QoS which contains specific parameters and a minimum level of quality of service. It is mutually agreed between a service provider and prospective consumers. This is a part of the contract and is an assurance to the service consumers that they will get the services that they pay for, by obligating service providers to fulfill contractual promises [15]. Service Level Objectives (SLOs) are a key element of SLA, which are the qualitative parameters of an SLA that includes availability, throughput, and response time. SLA clearly defines monetary penalties in case of any violation of the written agreement. Hence, service providers have a strong interest in keeping their commitments to avoid and reduce the situations that may cause SLA violation.
Any SLA mainly describes two things:
• Different Service Level Objectives (SLOs) in terms of values for Quality of Service metrics.
• The penalties to be applied if the objectives have not been accomplished [5]
From an application facilitating perspective, SLA has two different types: Application SLA and Infrastructure SLA. Infrastructure SLA ensures a level of consistency on infrastructures such as power, data center, latency and so forth by dedicating resources exclusively to the customer. An example is shown in Table 2.2. Application SLA is suitable for hosting models on which numerous applications are co-located. In such a setting, service resources are available to applications according to the application demands. Thus, in application SLA, service providers guarantee meeting application demands. An example of application SLA is shown in Table 2.3.
For instance, SLA can demonstrate 99.99 % accessibility for requests of disk, CPU, and memory. An SLA might also contain constraints on the response time for each request.
SLA is a significant piece of each agreement because a provider would like to allocate the minimal amount of resources for each customer to reduce the expense of its server infrastructure. Simultaneously, the provider needs to avoid having penalties due to the failure of providing the contracted service. The failure of providing a service is called an SLA violation. The client would like to receive the service on request and with no interference. Regardless of these high accessibility rates, infringement does occur in a genuine world and has caused both the provider and the client’s substantial expenses [18].
13
Table 2.1 – Components of a Web Service Level Agreement [16]
Table 2.2 – An example of infrastructure SLA [16] Service-Level
Parameter
Describes a noticeable property of a service whose value is measurable
Metrics Measures to assess, compare or track performances
Availability and uptime
The duration and frequency for which the services provided must be available to the customer. Uptime percentage is usually measured and reported monthly.
Performance standards
Specific benchmarks that are determined by the client. Actual vendor service-level performance is measured against these values to ensure the performance standards have been met
Response time Defines the minimum and maximum amount of time allotted to the
service provider for responding to a request or issue
Resolution time States the minimum and maximum amount of time that a vendor is
given to resolve a particular task or issue
Availability of Hardware 99 % uptime in a month
Availability of Power 99.99 % of the time in a month
Availability of data center network 99.99 % of the time in a month
Availability of Backbone network 99.99 % of the time in a month
Credit for Service unavailability Refund of service credit for downtime period
Blackout notification guarantee Notification to customers within 1 hour of downtime
Internet latency guarantee When latency is measured at 5-min intervals to an
upstream provider, the average doesn’t exceed 60 msec.
Table 2.3 – An example of application SLA [16]
2.3.1 SLA Management Life Cycle
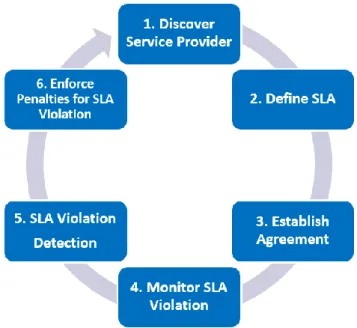
Each SLA goes through a sequence of steps starting from identification of terms and conditions, activation and monitoring of the stated terms and conditions, and eventual termination of the contract once the hosting relationship ceases to exist. Such a sequence of steps is called the SLA life cycle.
According to [17], it consists of the following six phases:
• Discover Service Provider
• SLA Contract Definition
• Establish Agreement
Service-level parameter metric Website response time (e.g., max of 3.5 sec per user request).
Function Latency of web server (WS) (e.g., max of 0.2 sec per
request).
Latency of DB (e.g., max of 0.5 sec per query) Average latency of WS = (latency of web server 1 + latency of web server 2 ) /2
Website response time = Average latency of web server + latency of database
Measurement directive DB latency available via http://mgmtserver/em/latency. WS
latency available via
http://mgmtserver/ws/instanceno/latency
Penalty Website latency < 1 sec when concurrent connection <
1000.
1000 USD for every minute while the SLO was breached. Credit for Service unavailability Refund of service credit for downtime period
15
• SLA Monitoring
• SLA Violation Detection
• SLA Enforcement
Figure 2.6: SLA Management Life Cycle
Discover Service Provider
In this period, the service provider publicizes these base service contributions through standard publication media, and the customers should be able to locate the service provider by searching the catalog. The customers can look through different competitive offerings and choose a few that fulfill their pre-requisites for further negotiation.
SLA Contract Definition
In this section, the service and its equivalent price, QoS parameters with a fundamental schema and the penalty rule is defined. SLAs are commonly defined using standard/base formats or by customization of these base layouts.
Establish Agreement
In this stage, a customer finds a service provider that meets the customer’s needs. The terms and conditions of the SLA are negotiated and settled upon. A service provider needs
to evaluate the SLA in terms of scalability, availability, and performance of its services to avoid fines before approving the specification of SLA. By the completion of this phase, parties start to commit to the agreement.
Monitor SLA violation
In this part, the provider’s presentation in delivery of the service is estimated against the agreement. A crucial part of SLA monitoring is to be able to envisage violations, assisting providers to reallocate the resources accordingly before the violations happen.
SLA Violation Detection
In this stage, the factors inside SLA are estimated and any deviation is determined. In the case of SLA violation, SLA enforcement is conducted.
SLA Enforcement
This segment is to implement penalties for SLA infringement. In this period, suitable actions are taken when the violation has been identified in the earlier phase. The concerning parties are notified and penalty charges are taken. After SLA implementation, SLA may end due to break or violation.
2.3.2 Cause of SLA Violations
Failure of service providers to render an agreed service as described in an SLA is called an SLA violation. Due to variation in workload, computing resources, and network conditions, it is common for Web services to exhibit fluctuation in performance, leading to the possibility of violation of an SLA [2]. SLA assurance is a critical objective for every provider, as violation will lead to heavy penalties for the provider, in terms of money and reputation [2]. In terms of availability, when Amazon Elastic Cloud crashed in 2011, it faced an outage and many big customers such as Quora and Reddit were down for more than a day. Such crashes affect service providers and service consumers. Predicting the occurrence of an SLA violation has become an important research topic. This subject can be viewed either from the perspective of the service consumer or from that of the service provider.
17
CHAPTER 3
PREDICTION MODELS
Machine learning is the research and formation of programs and algorithms that can study from historical data and make a prediction when exposed to new data. There are three common types of algorithms used in machine learning to solve different problems: supervised learning algorithms, unsupervised learning algorithms, and reinforcement learning [19].
• Supervised Learning intents to find a function, mapping the input to the output given to the labeled dataset.
• Unsupervised Learning aims to recognize structures and trends within an unlabeled dataset provided input.
• Reinforcement Learning targets at discovering a role that generates a sequence of acts that optimizes costs or rewards.
The focus of this thesis is on supervised learning. Consequently, supervised learning is applied in more profundity after an investigation of certain terminologies of machine learning. First, primary concepts such as Generalization, Bias-Variance Trade Off, and Cross Validation are addressed in machine learning. Finally, we will discuss how a model is evaluated in machine learning and specifically discuss Root Mean Square Error (RMSE), Mean Absolute Error (MAE), R2 and Adjusted R2.
3.1 Terminology
In this segment, we introduce the basic machine learning terminology that is utilized in the rest of this chapter. A dataset is given in a set of rows and columns in a typical supervised machine learning task. Each dataset row corresponds to one single data point, which is called an example of training or an instance of training. Input variables, functions,
or attributes are called columns. Each data point has at least one or more label(s), targets, or output variables linked with each other.
The dataset is characteristically split into two sets: training set and test set. The training set is utilized to learn the underlying variance factors in the data, while the test set is used for the final assessment. To start with, given the training set, the model is trained, and, during testing, the model is provided with an example described by its features, and the output is the expected label.
3.2 Supervised Machine Learning: Concepts and Definitions
Two pieces of information are given to the algorithm in supervised machine learning: a set of input instances X = {x1, x2, ..., xm} and a relating set of targets Y = {y1, y2, ..., ym}.
Classically, each of these m input instances contains a set of n features x = {x1, x2, ..., xn}.
Generally speaking, every xi function can take any value, either numerical (values are real
numbers) or categorical (values are unordered set members). Nevertheless, features may be expected to be converted to certain forms depending on the task at hand.
There is constantly a true function f∗(.), which maps each conceivable x to the most ideal y. In any case, we never have access to this unknown function. Supervised learning, therefore, amounts to approximating function f∗(.) based on the information provided in the sets of X and Y. The process of approximating f∗(.) using a function fθ(.) in which θ is a set of parameters is called learning.
Learning algorithms become familiar with the parameters θ of the function fθ(.) by
limiting the errors that the model makes. Formally, a function that maps the discrepancy between the output prediction of the model and the true target into a real number is called the loss function [19].
If the true target y is a discrete variable, the prediction task is called Classification. On the other hand, if y is continuous, the task is called Regression. In the accompanying subsections, we discuss these two types of supervised learning algorithms in more detail after formally presenting learning.
19
3.2.1 Learning
Approximating function f∗(.) using function fθ(.) corresponds to extracting the underlying factors of variation from data instances and mapping them to the output. These underlying factors could be a probability table, a graph structure, or weights depending on which learning algorithm is utilized to find the data. Generally, learning adds up to finding the best parameters θ to minimize a loss function over all the examples in the dataset [19]. Therefore, the learning process can be formulated as follows,
(3.1)
in which is the learned set of parameters, yi and oi are the target and output of the model
for the ith sample.
3.2.2 Classification
In a supervised classification task, the prediction output y is from one of the total C distinct classes {1, 2, ..., C}. To get a forecast for new examples, the model can simply output a class label, or the output can be a set of probabilities. Each probability corresponds to one of C classes that indicates how probable it is that the unseen input x belongs to a specific class. In models that output probabilities, to get a discrete prediction out of the model, either the class with the highest probability is chosen or the class label is drawn by sampling from the output distribution.
3.2.3 Regression
Similar to a classification task, in regression problems, the objective is to learn a mapping function from an n-dimensional vector x into a real-valued number O as the prediction. A regression model uses the historical relationship between an independent and a dependent variable to predict the future values of the dependent variable. Mathematically, regression is about learning a model f(y) = f(x) + ε, where ε is a noise/error term that describes everything that cannot be captured by the model.
A simple regression model shows the relationship between the magnitude of one variable and that of a second - for example, as X increases, Y also increases or as X increases, Y decreases. It estimates exactly how much Y will change when X changes by a certain amount.
3.3 Generalization
The goal of machine learning is to train models that can predict the labels for new examples that are not seen previously. Consequently, generalization to new examples is an important aspect of every learning algorithm. Usually, we are looking for models that perform well on testing data as well as on training data. As a consequence, we must prevent learning algorithms from merely memorizing training data; instead, such algorithms must learn the underlying variation factors.
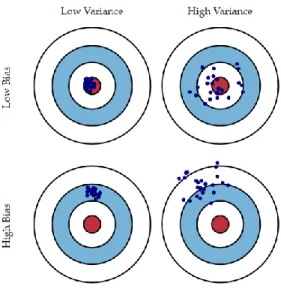
3.3.1 Bias-Variance Trade off
To decide how reliable a model is, we must comprehend the reasons behind errors. Bias and variance of a prediction model help us formally measure these errors. Bias and variance of a prediction model allow us to compute these errors formally. To define bias and variance over a model, we must assume that we can train the same model multiple times with different randomly selected data points. In this thesis, each trained model is called a model instance. Errors in bias and variance predictions are called errors due to bias and error due to variance respectively [20].
Bias corresponds to the distance between the expected prediction of the model and the true target [22]. Considering f(x) as the model, the bias is defined as follows:
bias = | E[f(x)] – y |2, (3.2)
where E[.] is the expectation and y is the true target. On the other hand, variance corresponds to the variability in different predictions of multiple instances of a model [22]:
21
The total error of a model in terms of bias and variance is defined as follows:
error = E[(f(x)−y) 2] = bias2 + variance. (3.4)
Given the limited amount of data, there is always a trade-off between bias and variance. The trade-off happens in a way that reducing one may lead to increasing the other. As a result, minimizing the total error requires a careful balance between bias and variance. A graphical illustration of this trade-off is shown in Figure 3.1.
Figure 3.1 - Dart chart: A graphical illustration of bias-variance trade-off
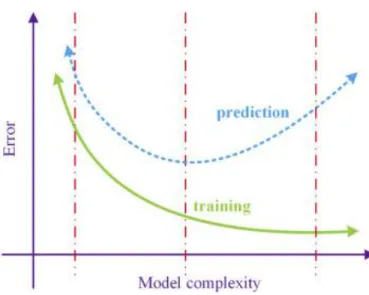
3.3.2 Cross Validation
To find the parameters of the model that generalize the best, we need to know if the model has been overfit. Cross validation helps us to find an overfit model. Overfitting happens when the error rate in the training set decreases but the error on the test set increases. As shown in Figure 3.2, as we increase the complexity of the model, the error rate in the training set decreases but at some point, the error in the test set passes the minimum and increases. When the error in the test set increases with higher model complexity, the model is overfit. In cross validation, the dataset is divided into training and validation sets. To increase the validity of the model, k-fold cross validation is used where
the dataset is partitioned into k equal subsets. We define d as the complexity order of the model. For each order-d hypothesis class:
— Repeat k times:
— Set aside one of the subsets.
— Use the rest of the data points to find θ (model parameters). — Compute prediction error on the held-out subset.
— Average the prediction error over the k rounds/folds. Use this as the estimated true prediction error for the order-d hypothesis class [19].
Figure 3.2 – Test & training error as the function of model complexity.
The goal is to find d with the lowest estimated true prediction error. It is worth mentioning that k-fold cross validation increases computation k-times. Thus, with larger datasets or complex models, a smaller value of k is preferred [19].
3.4 Performance Evaluation
In this subsection, we introduce the common error metrics used for evaluating a regression model: (1) Root Mean Square Error, (2) Mean Absolute Error, (3) R2, and (4) Adjusted R2 [23]. Error metrics help us indicate how good the model will perform when exposed to unseen data. Thus, after the model is trained on the training set and the best performing model is chosen, it will be tested on an intact test set. This approach helps us
23
select a model that will have a good performance on unseen data.
3.4.1 Root Mean Square Error (RMSE)
The root-mean-squared error (RMSE) is a measure of how well our model performed. It does this by measuring the difference between predicted values and the actual values. It is the standard deviation of the residuals (prediction errors).
Figure 3.3: RMSE – Predicted vs Observed values
Residuals are a measure of how far from the regression line data points are. RMSE is a measure of how spread out these residuals are. It shows how concentrated the data is around the line where it fits best. Root mean square error is commonly used in climatology, forecasting, and regression analysis to verify experimental results.
(3.5)
3.4.2 Mean Absolute Error (MAE)
MAE measures the average magnitude of the errors in a set of predictions, without considering their direction. It’s the average over the test sample of the absolute differences between prediction and actual observation where all individual differences have equal weight.
(3.6)
It is a measure of the difference between two continuous variables. Assume
X and Y are variables of paired observations that express the same phenomenon. Examples of Y versus X include comparisons of predicted versus observed, subsequent time versus initial time, and one technique of measurement versus an alternative technique of measurement. Consider a scatter plot of n points, where point i has coordinates (xi, yi).
Mean Absolute Error (MAE) is the average vertical distance between each point and the identity line. MAE is also the average horizontal distance between each point and the identity line.
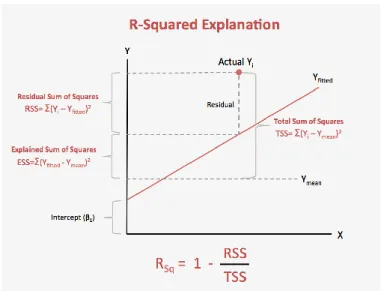
3.4.3 R2
It is a statistical measure that represents the usefulness or fit of a regression model. The ideal value for r-square is 1. The closer the value of r-square to 1, the better the model will be fitted. R-square is a comparison of the residual sum of squares (SSresiduals) with a
total sum of squares (SStotal). A total sum of squares is calculated by summation of squares
of perpendicular distance between data points and the average line [19].
(3.7)
It is a statistical measure that represents the proportion of the variance for a dependent variable that is explained by an independent variable or variables in a regression model. Whereas, correlation explains the strength of the relationship between an independent and dependent variable, R-squared explains to what extent the variance of one variable explains the variance of the second variable. So, if the R2 of a model is 0.50, then approximately
25
Figure 3.4: R-Squared Explanation
3.4.3 Adjusted R2
It is a modified version of R-squared that has been adjusted for the number of predictors in the model. The adjusted R-squared increases only if the new term improves the model more than would be expected by chance and if not understood. It only decreases if a predictor improves the model and the amount that is less expected by chance. It is always lower than the R-squared [10].
Adjusted R-squared measures the variation in the dependent variable (or target), explained by only the features which help make predictions. Unlike R-squared, the Adjusted R-squared would penalize for adding features that are not useful for predicting the target.
Let us mathematically understand how this feature is accommodated in Adjusted R-Squared. Here is the formula for adjusted r-squared:
(3.8)
(3.9)
Here R2 is the r-squared calculated, N is the number of rows and M is the number of columns. As the number of features increases, the value in the denominator decreases.
27
CHAPTER 4
Related Works
This chapter discusses the relevant background of recent works in SLA violation prediction and prevention.
4.1SLA Violation Prediction
SLA violation prediction is an essential task in web service as an SLA violation might cause interruptions for the clients’ accessibility of service and force penalties on the supplier. An assortment of contributions has been proposed for SLA violation prediction. For SLA violation prediction from the perspective of the service provider, several approaches have been proposed in recent years. Publications surveyed in this direction, with highlights of their contributions and limitations, are listed below.
Rafael et al. [40] proposed a technique which focuses on anticipating the demand of the future resources for meeting SLA requirement. The author used business-level SLAs (throughput and response time) as input parameters to the chosen prediction approaches. Machine Learning techniques like Support Vector Machine (SVM), Neural Networks (NN), and Linear Regression (LR) were used for prediction. However, no real-world data was considered or was probed on, for simulating a realistic scenario.
Authors in Jules et al. [39] use an intelligent and dynamic Service Level Agreement (SLA) based on a probabilistic ontology that detects and alerts potential violations of contract parameters for a cloud computing environment. Despite its good performance, the dataset generated using simulation does not necessarily represent a real environment. It contains 40% violations and dismisses the way that in a genuine world, infringement is extremely uncommon (∼2.0%).
[24], propose a regression machine learning model; the regression model is implemented using the WEKA framework, which cannot be scaled to real-world environments. In [25], the authors introduce an efficient system that predicts SLA violation before it occurs and recommends how to mitigate those violations to avoid any penalties. A profile-based model of SLA violation prediction from the provider’s perspective was proposed. It helps service providers in making decisions about whether to form SLA and avoiding SLA violations.
To achieve service level agreements, a prediction method based on Bayes model was designed by Zhang et al. [26] to predict the mean load over a long-term time interval as well as the mean load in consecutive future time intervals by identifying novel predictive features of host load that capture the expectation, predictability, trends and patterns of host load. This prediction model of the workload can help a service provider estimate the possibility of whether SLA violation will occur.
Wong et al. [27] proposed to use the SVM model to predict possible SLA violations before any issue emerges so that remedial action can be taken. While the approaches in [26] and [27] can help a service provider know beforehand whether SLA violation will take place, it lacks the capability of helping service providers evaluate QoS quantitatively.
Recently, Cheng et al. [1] [2] have proposed a framework to utilize the sensitivity analysis for the identification of influential factors with dominating impacts on QoS. They used metamodel-based analysis to select a fitted surrogate model for domain-independent prediction of SLA violation. The residual error between predicted and validated response time are calculated to select the best-fitted model for prediction. In the suggested method, the process of evaluation can be used by service consumers for service selection, and it can be used by service providers to study SLA violations [1]. However, in the proposed framework for SLA prediction, a manual process is employed, which is time-consuming and cannot tackle complex real-world data.
4.2SLA Violation Prevention
The subject of SLA violation prevention can be either composite services or individual services. For individual services, resource provision is employed to analyze workloads, to classify them based on common patterns, and to plan for workloads before actual scheduling. For composite services, several approaches suggest calculating aggregated QoS
29
values of all possible service combinations and choosing the one that maximizes the aggregated utility value while satisfying global constraints. Many different approaches have been proposed for SLA violation prevention.
For individual services, resource provision has been utilized in [28] to analyze workloads, to categorize them on the basis of common patterns, and to plan for workloads before actual scheduling. The authors of [28] later enhanced their work with automated processing in [29]. Although these methods can optimize QoS by allocating more resources, no attention has been given to resource over-provision, which is a serious issue for Web services as it wastes resources and causes an increase in operational cost [30].
Wu et al. [31] proposed ProfminVMminAvaiSpace, an algorithm that maps users' requirements into infrastructure resources to provide a reliable service, and at the same time, maximize resource allocation to prevent violations.
Uriarte et al. [32] used unsupervised learning to cluster the resource usage and duration of services to avoid violations of the Google Cluster trace dataset. If a violation happens inside a cluster of services, the other services inside the cluster will be assigned to other resources, to avoid the violation. This helps in violation avoidance in the cluster, but there is no explicit prediction of SLA violation for each service.
Chana et al. [28] proposed an approach where they enhanced their work with automated processing. Although these methods can optimize QoS by allocating more resources, no attention has been given to resource over-provision, which is a serious issue for Web services, since resources are wasted, and operational cost becomes exorbitant.
Cheng et al. [2] presented a new approach for QoS optimization to improve the quality of Web services. In this approach, four procedures were performed: identifying influential factors, collecting observed data, fitting collected data with the MARS model, and identifying global optimum till SLA is prevented. However, for optimization, only one controllable factor (cache level) is used, which will not lead to optimization for a complex system. So, there is a need to automate the proposed approach using Machine Learning techniques, which can easily adapt to any complex system and overcome the limitation of these approaches. The automated process will greatly enhance other requirements in terms
of availability, performance, robustness, response time, and cost.
As a result, this thesis will develop a novel approach to help a service provider intuitively analyze if their service design provokes SLA violation. If it does, then this approach will guide them for optimizing the service to prevent violation because SLA violation will lay a hefty penalty to the provider. As part of the proposed unified framework, this approach uses Machine Learning models to construct and train the system in a way that enables them to not only predict the violations but also prevent them by optimizing the service.
4.3Related Work
SLA Violation Prediction
Paper Contribution Limitations
Hemmat et al. (2016), “SLA Violation Prediction In Cloud Computing: A Machine Learning Perspective” [33]
- In this paper, two machine learning classification models: Naive Bayes and Random Forest classifiers, were used to predict SLA violations.
- Several re-sampling methods such as Random Over and Under Sampling, SMOTE, NearMiss (1,2,3), One-sided Selection were used to re-balance the dataset.
- Two classes- violated and unviolated were generated for the prediction problem.
- Accuracy, ROC area, Precision, Recall, and F value were used for model performance evaluation.
- No continuous
prediction was
done, as only task
violation is
predicted using the classification technique. - Basic classification techniques were applied to complex data to predict violation.
31 Zhu et al. (2017), “Online QoS Prediction for Runtime Service Adaptation via Adaptive Matrix Factorization” [34]
- This paper proposed a collaborative QoS prediction approach, namely adaptive matrix factorization (AMF) - AMF method has been presented and evaluated on a real-world QoS dataset of Web services.
- Median Relative Error (MRE) and
Ninety-Percentile Relative Error
(NPRE) were used to evaluate AMF approach. - Due to incurred service invocations, this approach is costly, especially when applied to a large number of candidate services. - Evaluations are conducted offline, which is not desirable on real large-scale applications.
SLA Violation Prevention
Paper Contribution Limitations
Khan et al. (2016), “An Adaptive Monitoring Framework for Ensuring Accountability and Quality of Services in Cloud Computing” [35]
- In this paper, a framework to
dynamically monitor QoS
metrics and performance
measures to verify compliances
for respective SLAs is
proposed.
- Three main components namely, a component for the digitization of SLA parameters;
interactive components for
dynamic monitoring of QoS
- No new technique is
proposed for QoS
optimization.
- This method optimizes QoS by allocating more
resources but no
attention has been given
to resource
and core component for dynamic detection of violation
and adaptive remedy
rectification are advised. Zhou et al. (2018),
“Minimizing SLA violation and power
consumption in
cloud data centers
using adaptive
energy-aware algorithms” [36]
- This paper proposes two novel
adaptive energy-aware
algorithms for maximizing
energy efficiency and
minimizing the SLA violation rate in Cloud datacenters. - Application types, as well as
the CPU and memory
resources, are also considered during the deployment of VMs. - Experimental analysis is performed using a real-world workload, which comes from
more than a thousand
PlanetLab VMs.
- Predicts future resource
requirements, and
arranges appropriate
additional virtual
resources in advance, before the peak occurs. This is done to maximize performance and avoid service violations, but it always wastes resources and causes an increase in operational cost.
33
Model Construction
Paper Contribution Applicability
Joseph et al. (2015), “Construction and Use of Linear Regression Models for Processor Performance Analysis” [37]
- The paper proposes an
iterative process for
constructing accurate
regression models of processor consisting of all significant main effects and interaction
terms using a reasonable
number of simulations.
- It constructs and obtains
accurate estimates of all
significant coefficients with the
minimum number of
simulations.
- Regression model
construction steps include: Obtaining the Best Model, Determining Model Adequacy and an interactive procedure to obtain linear models at any specified level of accuracy.
- This iterative method
can be used for
constructing regression models to predict SLA Violations.
- It can be extended to various applications like: - Sales forecasting - Weather forecasting - House Price Prediction
Adhikari et al. (2013), “An Introductory Study on Time Series Modeling and Forecasting,” [38]
- This paper proposes how a time series regression model is constructed and applied in a different real-world domain. - To evaluate forecast accuracy as well as to compare among different models fitted to a time
series, five performance
measures are used: MSE, MAD, RMSE, MAPE and Theil's U-statistics.
- Applied Time Series
forecasting on the following domains: Stochastic models, Artificial Neural Networks, Support Vector Machines
A combined Time Series regression model can be used for SLA prediction and prevention.
- It can be extended to various applications like: -Economic Forecasting - Budgetary Analysis - Stock Market Analysis - Yield Projections - Process and Quality Control
35
CHAPTER 5
PROPOSED METHODOLOGY
The idea of this thesis is to automate the unified framework for the prediction and prevention of SLA developed by Cheng et al. [1] [2]. To automate the existing process, the proposed approach uses various machine learning models and techniques. Prior projects working on SLA violation prediction or avoidance have generally neglected the challenges of using real-world data. In the proposed framework, a real-world dataset is used to construct machine learning models for efficient analysis of the unseen data. SLA violation prediction and prevention can be simply considered as a regression problem.
Data analysis, SLA violation prediction, and design optimization are three crucial, yet typically separate techniques for QoS evaluation and optimization [52]. As illustrated in Figure 5.1, this thesis proposes an innovative framework to solve the main issues of SLA violation by automating these three techniques into a unified framework, which analyzes, predicts, and prevents SLA violations.
The process of data analysis in this framework initiates the construction of a single dataset table through data selection and preprocessing, which is responsible for cleaning and preparing data to address the machine learning problem. With the number of features reduced to only those influential to the service’s performance, the second process fits a machine learning model to predict SLA violation. The development of a model starts with a candidate in a specific type and form, such as a regression model, from a pool of choices. The process of SLA violation prediction then checks the adequacy of this chosen candidate with new experiments. Unless a rejection results in the choice of another candidate, the model is ready to be used for quantitative analysis of service quality and for the prediction of situations when SLA violations could take place.
The last process of QoS optimization is necessary to avoid the predicted SLA violations by adjusting the values of controllable factors by service providers, such as CPU, storage,
and cache. This process includes three steps as below:
• Identifying the most influential controllable factors
• Fitting new data with a machine learning regression model
• Conducting experiments with single/multiple factors and collecting observational data This three-step procedure is either repeated until SLA prevention is achieved, or the list of controllable factors is exhausted. In the latter case, a re-design of the web service by the provider is a practical recommendation.
The rest of this chapter is organized as follows. Section 5.1 first discusses data analysis, which helps to understand its characteristics, features, and class distribution; this facilitates the discovery of models that can effectively make predictions with such features. Then, it discusses the approach of data selection and preprocessing. Section 5.2 presents the machine learning models that can efficiently address the regression task of SLA violation prediction on a skewed dataset. Finally, Section 5.3 presents our approach for preventing the predicted SLA violation using multi-factor optimization on a selected machine learning model.
37
5.1 Data Analysis
Figure 5.2 illustrates the first module of the proposed framework for data analysis, with details presented in Algorithm 1. Since the availability rate is very high (97.8%) and violations are rare, machine learning models tend to predict the absence of violations. However, this is not desirable in a real-world scenario. Thus a few re-sampling techniques are applied in machine learning to handle the skewness of data.
The process of data analysis is responsible for the selection and examination of raw data. Due to the fact that datasets always contain irrelevant information for SLA analysis, it is necessary to group raw data into labelled columns and keep only relevant columns by filtering out the others. If an original dataset uses spaces or commas to separate data, they need to be removed to avoid false prediction results. This results in a well-formatted table with useful information after Algorithm 1 finishes the first step of processing. However, datasets collected from real-world applications always contain null and duplicated data. Therefore, the proposed algorithm examines the table in the second step and remove the null or duplicated columns and rows. This cleanup applies to columns and rows that have unique values as they do not add any value to the prediction of SLA violations.
In order to make the dataset more useful and productive after preprocessing, data transformation is applied in the third step. Machine Learning is all about data, and the training success of any model depends on the way data is transformed and fed into the machine learning algorithm. Feature transformation is a function that transforms features from one representation to another.
There are several reasons for transforming the features:
• Data types are not suitable to be fed into a machine learning algorithm, e.g., text, categories.
• Feature values may cause problems during the learning process, e.g., data represented on different scales.
• Reduce the number of features to plot and visualize data, speed up training or improve the accuracy of a specific model.
In the proposed approach for transformation, normalization technique is applied to rescale data from the original range to a new range between 0 and 1. Normalization is only applied to the data when the data has input values with differing scales. The required features taken from the data set through the normalization process can vary. Since predicting the response time of the incoming request is needed in this case, the information of resources used by the user is gathered.

![Table 2.1 – Components of a Web Service Level Agreement [16]](https://thumb-us.123doks.com/thumbv2/123dok_us/593431.2570973/25.918.103.812.156.823/table-components-web-service-level-agreement.webp)
![Table 2.3 – An example of application SLA [16]](https://thumb-us.123doks.com/thumbv2/123dok_us/593431.2570973/26.918.110.819.133.685/table-example-application-sla.webp)