Threshold of Preference for Collusion and
Interconnection Fees in Different Market Structures :
the Tunisian Mobile Market Case
Sami Debbichi, Walid Hichri
To cite this version:
Sami Debbichi, Walid Hichri. Threshold of Preference for Collusion and Interconnection Fees
in Different Market Structures : the Tunisian Mobile Market Case. Working paper GATE
2013-07. 2013.
<
halshs-00794286
>
HAL Id: halshs-00794286
https://halshs.archives-ouvertes.fr/halshs-00794286
Submitted on 25 Feb 2013
HAL
is a multi-disciplinary open access
archive for the deposit and dissemination of
sci-entific research documents, whether they are
pub-lished or not.
The documents may come from
teaching and research institutions in France or
abroad, or from public or private research centers.
L’archive ouverte pluridisciplinaire
HAL
, est
destin´
ee au d´
epˆ
ot et `
a la diffusion de documents
scientifiques de niveau recherche, publi´
es ou non,
´
emanant des ´
etablissements d’enseignement et de
recherche fran¸
cais ou ´
etrangers, des laboratoires
publics ou priv´
es.
GROUPE D’ANALYSE ET DE THÉORIE ÉCONOMIQUE LYON -‐ ST ÉTIENNE
WP 1307
Threshold of Preference for Collusion and Interconnection
Fees in Different Market Structures: the Tunisian Mobile
Market Case
Sami Debbichi, Walid Hichri February 2013
Doc
ume
nt
s
de
tr
av
ai
l |
W
or
ki
ng
P
ape
rs
GATE Groupe d’Analyse et de Théorie Économique Lyon-‐St Étienne
93, chemin des Mouilles 69130 Ecully – France
Tel. +33 (0)4 72 86 60 60
Fax +33 (0)4 72 86 60 90
6, rue Basse des Rives 42023 Saint-‐Etienne cedex 02 – France
Tel. +33 (0)4 77 42 19 60
Fax. +33 (0)4 77 42 19 50
Messagerie électronique / Email :
Téléchargement / Download :
http://www.gate.cnrs.fr
– Publications / Working Papers
Threshold of Preference for Collusion and Interconnection Fees in
Different Market Structures: the Tunisian Mobile Market Case
Sami DEBBICHI
∗and Walid HICHRI
†February 24th 2013
Abstract
We present a Cournot model that compares the critical threshold of collusion in Duopoly and Oligopoly Markets where the actors are private, mixed or public. We assume that the incentive critical threshold for collusion depends on the interconnection fees. The different threshold values calculated in each Mar-ket structure are then estimated, using the OLS method, with variables related to the Tunisian marMar-ket structures and prices. The Econometric estimation of the different threshold values is consistent with our theoretical results. Our findings can be used by the decision makers to control collusion, by acting on the level of interconnection fees for each market structure and by implementing the suitable market liberalization policies in this sector.
Key Words: Interconnexion fees, Collusion, Market Structure, Private sector, Public Sctor, Tunisian Mobile Market.
JEL Classification: D47, L13, L51, L96
1
Introduction:
The mobile telephony market had known in the recent years a dynamic and changing structure in most of the countries who have undertaken to reform their telecommunications sectors. Depending on the characteristics of the local market (private or public sector) resulting from the restructuration and the implementation of progressive market liberalization policies, the number of actors (duopoly or oligopoly) and consequently their profits in the telecommunications industry has been variable. At the same time, some changing in the market structure was the result of a strategic behavior adopted by the several economic operators. In this context, collusion is one of the possibilities and strategies (Colombier et al. (2010)) that actors may adopt to control the market.
Laffont and Tirole (2000) present a study of competition in telecommunications, and a view of this competition from the United States was presented by Parsons (2002). In general, the Mobile telephony markets are either a duopoly, or an oligopoly, with a mix of private and public agents. They are facing an increasing number of customers. In such a context, there is no perfect competition and the telecommunications suppliers have generally the market under control. However, the decisions of the different actors directly influence each others, especially in presence of interconnection fees in the mobile telephony market.
∗AEDD, University of Tunis El Manar
†University of Lyon, F-69007, France; CNRS, GATE Lyon Saint Etienne, 93, Chemin de Mouilles, Ecully, F-69130, France;
In fact, the Mobile telephony markets are originally a public monopoly, especially in the developing countries. The continuous and rapid changes in this sector oblige the decision makers to allow the entrance of private actors on the market, which suppose that the new entrants can have access to the existing network. Thus, this supposes a regulation of the interconnection fees that prevent the monopoly, while supplying interconnection services to new entrants, to charge high prices of interconnection that prevent the settlement of a real competition on the market (Girardi (2007), Abdel Jaoued (2001), Schiff (2005)). The interconnection fees have real economic issue and consequences, as shown in Baranes and Poudou (2010), Bulatovic (2004), Flochel (1999) and Baranes and Flochel (1999).
While the network interconnection prices are based upon costs in several developed countries (for example, this is the case in France), it is difficult to calculate and to provide interconnection services fairly and efficiently in the developing ones (Um et al. (2004)).
Several studies have already highlighted the determinants of the choice of colluding (Parker and Roller (1997) and Hoffler (2009)), and especially its relationship with the level of interconnection fees. In his study of this relationship among the suppliers of internet, Cortade (2005) shows that the preference for collusion does not depend on the level of the access fees, when the market structure is vertically separated. As shown in different applications in Penard (1997), collusion is a strategic behavior chosen by economic agents when the result is better in comparison with competition. Also, telecommunications networks may even use a high access charge as an instrument of collusion (Dessein(2003)).
We present in this paper a theoretical study of different market structures in presence of interconnection fees. We calculate the critical threshold of collusion, that is the level of interconnection fees from which the operators switch from/to collusion. The comparison of the different results permits to optimize and to control the degree of liberalization of the economy.
Our theoretical results are confronted with an econometric estimation of the threshold level of interco-nenction fees regarding to the decision of colluding. The data concerns the Tunisian mobile market. The choice of Tunisia, as a representative of the mobile phone market in most of the developing countries is due to the dynamic and important changes in this market during the last decade.
The market structure of the mobile phone in Tunisia has gone through several stages, from the monop-olistic structure (1992-2001), to the duopmonop-olistic one (2002-2009) until reaching a three operators structure (from 2010 until today). In addition to the market structure, there has been changes in the market shares of the public and the private operators. Indeed, the privatization of Tunisia Telecom (T.T.) (the historical national operator) in 2006 transformed (theoretically) the market from a mixed (Private-Public) duopoly to a private one. With the entry of Orange Tunisia on the market in 2010, one should talk about a three private operators market. Obviously, the preference for collusion is certainly not the same in these different market structures.
The paper is organized as follows: Section 1 presents the theoretical framework in a Cournot competition market and specifies the strategic behavior of the operators according to the threshold of interconnection fees in a repeated game. We present thereafter, the interconnection fees in a duopoly (Section 2) and in an oligopoly (Section 3) market structure with private, mixed and public operators. We try to express the threshold of preference for collusion depending on the interconnection rate in these two scenarios, and to determine the optimal level for which the incentive to collude is higher. The different results obtained are discussed in Section 4.
Finally, the different threshold values calculated in each Market structure are estimated econometrically (Section 5) with the OLS method, using variables related to the Tunisian market structures and prices on
this market.
2
Theoretical Framework in a Duopoly Market
Let’s assume N operators on the Phone Market, who have the choice between colluding and competing. The incitation to collude will depend on the critical threshold of preference for collusion (C.T.P.C.) that is related
to the discount factor δof each operator.
Each operator has to choose between two strategic behaviors: either competing or colluding, regarding to the comparison between short-term gains to deviate and long-term losses after deviation, in a repeated game. In such a context, collusion is possible when the preference for the present, reflected by the discount
rate r (with δ= 1+1r and 0≤δ≤1) is very low (Friedman (1971)).
Players are concerned with an indefinitely repeated sequential game where in the first stage, at period t
= 0, they decide to collude. If they cooperate in period t = 1, player i, where i={1,2} (N = 2) realizes a
profit equal toπColl
i . A unilateral deviation from collusion will change this profit toπDevi , withπDevi > πiColl.
We assume that a deviation of one player in period t will be followed by a change in the cooperative behavior
of the other operator in period t+1 such that the profit of each operator becomes equal to πCompi , as both
operators deviate from collusion.
Calculations of the updated value of profit after Deviation VDev and the updated value of profit after
CollusionVColl show that:
VDev= ∞ ∑ t=1 δtπiComp= δ 1−δπ Comp i and VColl= ∞ ∑ t=1 δtπColli = δ 1−δπ Coll
Collusion is a better strategy if the profit resulting from Deviation, in a repeated game, is lower than the difference between the updated value of profit after Collusion and the updated value of profit after Deviation:
δ 1−δ ( πiColl−πiComp ) > πDevi −πiColl
From this inequality, we can calculate the threshold of the discount factor ¯δfrom which collusion becomes
possible: δ >δ¯= π Dev i −πiColl πDev i −π Comp i
Consequently, if the value ofδ for one operator is higher than ¯δ, collusion will be the best strategy to
choose. We will discuss next the variation of ¯δwhen the interconnection feesavary to see, for each value of
a, the variation of the critical threshold of preference for collusion (C.T.P.C.).
2.1
A Duopoly Market with Private operators:
We assume that the number of operators is equal to two (N = 2), and that, in absence of a public operator,
function of one operator i̸=j where i and j∈ {1,2}, in presence of interconnexion feesa, is equal to:
πi= (Pi(Q)−a).qij+a.qji
wherePi(Q) =Pj(Q) = 1−Qis the price function andQ=qij+qjiis the total quantity of interconnection
produced by both operators. The resulting reaction function of player i is equal to:
qij(qji) =
1−qji−a
2
In such a contex, the optimal quantity to be produced by operatorsiandj is:
q∗ij =qji∗ =1−a 3 and the resulting profit is:
πi∗=πj∗=(1 + 2a).(1−a)
9
If both operators decide to collude with equal sharing of profits, the joint profit πJ can be written as
follows:
πJ= (P(Q)−a).Q+a.Q= (1−Q).Q
Maximizing this joint profit gives us a total quantity producedQ∗J equal to 1/2 and a total joint profitπJ
equal to 1/4, which corresponds, with the equal sharing rule, to a quantity per operator qCollij =qCollji equal
to 1/4 and a profit of collusion πColl
i =πCollj equal to 1/8.
Suppose that one of the two operators (player i) chooses to deviate from the collusive agreement. In
this case, it is assumed that his rival keeps constant his output level (1/4) after the collusion strategy. The
quantity produced by player iwith defection is:
qijDev=1 2. ( 3 4 −a )
The profit of playeriresulting from deviation is then:
πijDev=(1−qDevij −qijColl−a).qDevij +aqjiColl
Calculations show that
πDevij =πDevji = 9 64+ 1 4a ( a−1 2 )
Using the equation calculated previously, the threshold discount factors¯δ, above which collusive agreement
is sustainable, is the same for both players and is equal to: ¯ δ= 1 64+ 1 4a ( a−12) 9 64+ 1 4a ( a−12)−19(1 + 2a) (1−a) = 9 17
preference for collusion (C.T.P.C) ¯δis constant. Thus, the preference for collusion doesn’t depend in such a
market structure on the value of interconnection feesa.
2.2
A Duopoly Market with Mixed operators:
In presence of two operators of different natures, while the private one (playeri) continue the maximization
of his profitπi, we assume that the public operator (playerj) maximizes the collective profit ˜πj, representing
the sum of the consumers’ surplus and πi:
πi= (1−qij−qji−a).qij+aqji ˜ πj = ˆ Q 0 P(Q)dQ−P(Q).Q+πi= 1 2(qij+qji) 2 + (1−qij−qji−a).qij+aqji
The quantities at the equilibrium for both players areq∗ji= (1−a) for the public operator andqij∗ = 0 for
the private one. The resulting profits are respectivelyπ∗i =a(1−a) and ˜π∗j = 12(1−a)2. Consequently, the
private operator will not produce and has a positive profit resulting from the presence of externalities and interconnection fees of the public operator.
The comparison between both profits shows thatπ∗i >π˜∗j if the interconnection feesa > 13.
If both operators decide to collude, they will maximize their joint profitπJ, where:
πJ=
1
2Q
2+ (1−Q−a)Q+aQ
The solutions of this program areQ∗J = 1 andπJ∗ = 1
2. An equal sharing of the market and profits gives
then for each operator an interconnection quantity equal to 12 and a profit equal to 14.
Suppose that the private operator (playeri) deviates from collusion and maximizes his own profit πDev
i ,
while the public operator still continue cooperating. In such a context, the public operator will continue
producing a quantityqJ
jiequal to
1
2 and the private operator will produce a quantityq
Dev ij equal to 1 2( 1 2−a)
and will generate a profitπDev
i =14a(a+ 1) +
1
16. The critical threshold of preference for collusion (C.T.P.C.)
¯
δis then equal to:
¯ δ= a 2+a−3 4 5a2−3a+1 4
This threshold vary with interconnection fees, and if the discount factor of one operator is higher that ¯δ,
then collusion is the best strategy.
2.3
A Duopoly Market with Public operators:
Although this case is not realistic, as we rarely find sectors with two public agents, it remains interesting to compare the results of this market configuration with the two previous cases.
With two public operators, where each agent maximizes the collective surplus, each one produces a
quantity equal to (1−a), and makes a profit equal to (1−a). If both operators collude and share equally
the market, each one will produce a quantity equal to 12 and will make a profit equal to 14. However, if
one of them deviates, he will produce a quantity equal to (1−a), which allows him with a profit equal to
1 2a
2−1 2a+
5
¯ δ=a 2+−a+3 4 a2+a−3 4
As in the previous market structure, The threshold vary with interconnection fees, and the operator will
collude if his discount factorδis higher that ¯δ.
3
Theoretical Framework with three operators:
Assuming that the number of operators on the market is equal to three (N = 3), we’ll present successively
different market structures where the number of private operators varies from three to zero.
3.1
An oligopoly Market with three private operators:
We’ll suppose in this section that there are three operators i, j and k, where i, j and k ∈ {1,2,3} and
i̸=j̸=k. The profit of operator idepends on the quantityqij he puts in competition with operatorj, but
also on the quantityqikhe puts in competition with operatork. The total quantity produced by the operator
iisqi=qij+qik. The total quantity available on the market isQ=qi+qj+qk.
Each operator tries to maximize his profit. The profit of operatoriis:
πi = (Pi(Q)−a)(qij+qik) +a(qji+qki)
With a price functionP(Q) = 1−Q, maximizing the profit of each operator regarding to the total optimal
quantity he puts on the market, shows thatqi =qj =qk = 1−4a. These quantities allow each operator with
a same profit equal to (1+a)16.(1−3a).
If the three operators decide to collude, they will realize a joint profit equal to 34, which corresponds to
an individual profitπColl
i equal to
1
4 and to a same share of production equal to
1
6 for each operator.
To study the effect of deviation from collusion, suppose that agent i deviates and maximizes his own
profitπDev
i , and let’s assume that agentsj andk maintain their cooperative behavior. Such a behavior will
permit playerito realize a profitπDev
i equal to 3 4a 2−1 6a+ 1 9.
In this case, the threshold of the discount factor ¯δis equal to:
¯ δ= 3 4a 2−2 3a− 3 54 3 4a 2−2 3a+ 1 9− 1 16(1−a)(1−3a)
This threshold, above which collusion is preferred to deviation, is still calculated as in the duopoly case
and varies with interconnection feesa.
3.2
A mixed oligopoly Market with one public and two private operators:
A mixed oligopoly is a particular market structure where the private and public operators do not have the same characteristics. The differences can concern the technology used by each operator (Ouatara (2011)). But even when these different operators have the same technology, the possibility of merging may be possible only under some restrictions (Artz et al (2009)).
Let’s assume now that the market is composed of one public and two private operators (see De Donder (2005) for an example of competition of a public firm in a mixed oligopoly). In such a context, the private
agentsiandjwill continue maximizing their own profits, while the public operatorkwill maximize the total
surplus. The two profits and the surplus function are respectively as follows:
πi= (1−(qij+qik)−(qji+qjk)−(qki+qkj)−a).(qij+qik) +aqji+aqki πj = (1−(qij+qik)−(qji+qjk)−(qki+qkj)−a).(qji+qjk) +aqij+aqkj ˜ πk= 1 2(qki+qkj+qji+qjk+qij+qik) 2 + (1−qki−qkj−qji−qjk−qij−qik−a).(qki+qkj) +aqjk+aqik
We still assume that the demand function isP(Q) = 1−Q. Operatoriwill maximize his profit regarding
the total quantity (qij+qik) of calls on the network. The two other operators will behave in a symmetric
way. Consequently, the first order conditions obtained from the resolution of the previous equations show
that (qij∗ +q∗ik) = (qji∗ +q∗jk) = 0 and (q∗ki+qkj∗ ) = (1−a).
As a result, the private operatorsiandj realize the same profit (respectivelyπ∗i andπ∗j) equal to a(12−a).
However, the public operator will realize a profitπk∗equal to (1−2a)2.
This means that the private operators will not produce strategically any quantities, and in presence of externalities, they will realize a positive profit.
In the case where the three operators decide to collude, they will behave as a monopoly, and maximize
their joint profit πJ, where:
πJ=
1
2Q
2+ (1−Q−a)Q+aQ
The optimal quantities produced in such a context are such that the total quantity of interconnection
produced by the three operators isQColl= 1, which corresponds to an equal share of the market corresponding
to 13 for each operator. Consequently, the total profit resulting from collusion is equal to 12, and the individual
profit for each operator is equal to 1
6.
To understand the consequences of deviation in an oligopoly market with one public and two private
operators, we’ll assume that one of the two private agents, say operator i, deviates from the situation of
collusion. This assumption is more close to reality, as the public operator maximizes the total surplus, and doesn’t have the willingness to make profits.
By choosing collusion, operatorimaximizes his profitπDev
i while assuming that the two other operators
will not change their strategies on the market and will continue looking for collusion by producing quantities
equal to 1
3 for each operator. Meanwhile, the private operator looking for deviation will produce a quantity
(qDevij +qDevik ) = 12(13−a) and will generate a profitπiDev=14a2+16a+361. The critical threshold of preference
for collusion (C.T.P.C.) ¯δis then equal to:
¯ δ= 3a 2+ 2a−5 3 9a2−4a+1 3
3.3
A mixed oligopoly Market with one private and two public and operators:
This market structure with one private and two public operators is not realistic, as it is difficult to find in the same market two public agents. Nevertheless, this can be the case when collusion concerns different countries that are trying to merge their economies, or some regions of the world that are trying to set up a political or economic union.
Our model shows that in the case where there are two public operators, in presence of only one private operator, the critical threshold of preference for collusion (C.T.P.C.) remains the same than the one found in the previous case. Thus, we find that in a mixed market structure with three operators, the number of private or public operators has no effect on the preferences for collusion.
3.4
An oligopoly Market with three public operators:
Although the case of a market with three public operators, as in the previous market structure, can be studied only in very specific and transitional situations, the comparison with the other market structures still remains very interesting.
If each public operator maximizes the total surplus, the resulting optimal quantities produced by each
one is equal to (1−3a) and the individual profits are the same and equal to −185a2+29a+181. However, the
strategy of collusion allows each operator to produce a quantity equal to 16 and to make a profit equal to 16.
If one of the three public operators, say operatori, deviates from collusion, the optimal total quantity he
should produce is equal to (13−a), consequently to the maximization of his profit:
πDevi = 1 2(q Dev ij +q Dev ik ) 2+(1−(qDev ij +q Dev ik )−(q Coll ji +q Coll jk )−(q Coll ki +q Coll kj )−a)(q Dev ij +q Dev ik )+a(q Coll ji +q Coll ki )
The maximized profit is equal toπDev
i =
1 2a
2+ 1
18. Thus, the critical threshold of preference for collusion
¯
δis equal to 129aa22−−24a.
We present in section 4 a discussion of the relationship between the critical threshold of preference for
collusion (C.T.P.C.) and interconnection feesain all the market structures presented previously.
4
Results and Discussion
Our results show that the critical threshold of preference for collusion (C.T.P.C.) depends on the
intercon-nection feesawhen the market structure is composed of three operators, regardless of whether the operators
were private or public. This is also the case in presence of only two operators, except when both operators are private.
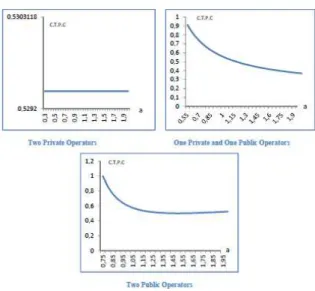
As shown in the following figures, the critical threshold of preference for collusion function is decreasing and convex in a duopoly (see Figure 1).
Figure 1 : Variation of the Critical Threshold of Preference for Collusion (C.T.P.C.) with Interconnection
Feesain a Duopoly Market Structure.
The critical threshold of preference for collusion (C.T.P.C.) becomes increasing and concave, at least for
certain values of interconnection feesa, in presence of three operators (see Figure 2).
Figure 2 : Variation of the Critical Threshold of Preference for Collusion (C.T.P.C.) with Interconnection
Feesain Presence of Three Operators on the Market.
Consequently, the relationship between this threshold and interconnection fees ais changing and varies
with market structure.
In fact, as ¯δ is equal to:
¯ δ= π Dev i −πiColl πDev i −π Comp i = F(a) G(a)
if the value ofδfor one operator is higher than ¯δ, collusion will be the best strategy to choose. This is the
in a duopoly market, as interconnection feesaincrease, it becomes easier for the operators to collude, except for the two private operators case where the critical threshold of preference for collusion (C.T.P.C.) do not vary with interconnection fees. However, for the same variation of interconnection fees, collusion becomes more difficult to realize in presence of three operators.
While the critical threshold of preference for collusion (C.T.P.C.) never reaches its minimum possible value in the three cases of the duopoly market structure, this Critical Threshold of Preference for Collusion (C.T.P.C.), in a three operators purely public and mixed markets, never reaches the maximum value equal to one. It reaches such a value only in the case of a purely private market structure with three operators, when interconnection fees increase to 1.6 (see Figure 2).
The concavity of the increasing function of ¯δin a three operators market means that, as interconnection
fees increase, the interest to deviate from collusion (F(a)) increases less in comparison to the increase of the interest to deviate from competition (G(a)). It becomes then more and more difficult to collude.
Figure 2 shows also that, when interconnection fees value a is low (lower than 1.2), collusion is more
easy to realize in a market structure with three private operators. However, for higher values ofa, collusion
becomes more difficult in this market structure than in the three other cases with three operators.
5
Econometric estimation of the critical threshold of preference
for collusion in the Tunisian phone market
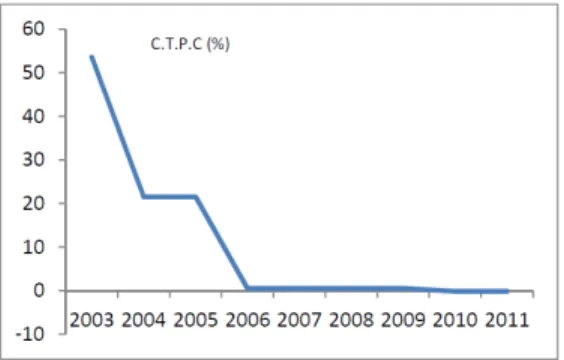
The Tunisian mobile market structure was historically an public monopoly with one operator (Tunisia Tele-com (T.T.)). Since 2002, a private operator (Tunisiana) has entered on the market. In 2006, the public operator (Tunisia Telecom (T.T.)) becomes a private one. Finally, in 2010, a third private operator (Orange Tunisia) joined the market to transform the duopoly private structure into a three private operators market. As mentioned in Debbichi and Ben Khalifa (2013), “one of the major inefficiencies of competition on mobile phone market in Tunisia is that the evolution of interconnection rates have witnessed a low decrease after the year 2008, but some stability between years 2003 and 2008, in the duopoly period.” Using these calculated interconnection rates, and the calculations made above for the critical threshold of preference for collusion (C.T.P.C.), we are able to calculate the variation of this threshold from 2003 to 2011 on the Tunisian phone market. The results are presented in Figure 3.
Figure 3: Evolution of the Critical Threshold of Preference for Collusion in the Tunisian Mobile Market from 2003 to 2011.
As shown in Figure 3, the values of the critical threshold of preference for collusion (C.T.P.C) were high
value in 2006, when the public operator (Tunisia Telecom (T.T.)) becomes private. This threshold becomes negative in 2010, the date that corresponds to the entry of the third operator (Orange Tunisia) on the market. In the Tunisian mobile market, we have then since 2010:
πiComp< πiDev< πColli
This result is logical since a decrease in the wholesale price leads to a decrease in the margin between the retail price paid by the consumer and the interconnection rate exchanged. This encourages cartel members to prefer not to deviate from the collusive agreement, and as a consequence, the critical threshold of preference
for collusion δdecreases.
On the other hand, another explanation can be found in the fact that the market for mobile telephony in Tunisia was experiencing strong growth in demand during the period 2003-2005, which leads the two operators to have a very high discount rate, and consequently, a strong preference for the future and therefore a preference for collusion.
We’ll test econometrically the assumption (Penard (2003)) according to which any factor that increases competition between operators is more promising incentive for collusion. We will then express the effect of each retained variable on the critical threshold of preference for collusion (C.T.P.C.).
The variables of the estimated model are of two kinds. Either they are related to the market structure, or they concern the prices on the Tunisian mobile market. The first type of variables includes competition (COMP), measured by the number of mobile operators who have installed their networks and who are marketing their services. In fact, there is a relationship between the number of competitors and collusion, as shown in Selten (1973) who presents a theory that investigates “the connection between the number of competitors and the tendency to cooperate.” The importance of the number of competitors as a variable is at the origin of the distinction made by Chamberlin (1933) between small group and the large group.
The first type of variables includes also a measure of market concentration (HHI), Expressed by the HHI index. This index is established by summing the squared market shares (usually multiplied by 100) of all the operators. The more the HHI index is high, the more the market is concentrated and the more preference for collusion is strong.
The two other variables of the first kind are market shares convergence (CONV) measured by the difference between the market shares of operators expressed in percentage (the more market shares are converging (difference tends to zero), the more collusion is easy) and the Lerner index (LI), as presented in Debbichi and Ben Khalifa (2013). This index reflects the degree of market power for operators. The more the price is far from the marginal cost, the more the market power is important, and the more preference for collusion is strong. This variable is constructed on the assumption called "Balanced Calling Pattern" (Laffont and Tirole (2000)) and according to which, the fraction of calls from the original network and ending on the other competing network is proportional to the market share of the competitor. In other words, the flows of incoming and outgoing calls are balanced, even if market shares are not.
The second type of variables includes the retail prices (RP) and the wholesale ones (WP). The retail prices represent off-net prices charged by operators expressed in local Tunisian currency without taking into account taxes, and paid by the consumer. If the price increases, the margin between the retail price and the wholesale price increases and hence the preference for collusion increases. The whole sale prices represent the interconnection rates charged and exchanged between operators expressed in Tunisian local currency without taxes. If this rate increases, the margin between the retail price and the tariff decreases and hence preference for collusion decreases.
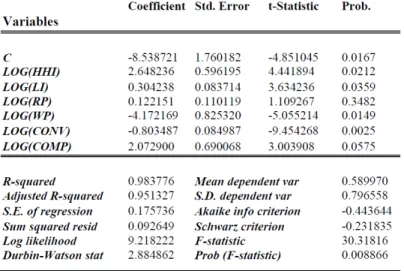
All variables of the estimated model are expressed in logarithms and are estimated by the method of Ordinary Least Squares (OLS) for the period 2002-2011. The results are given in the following table (Table 1).
Table 1: Estimation of the critical threshold of preference for collusion (C.T.P.C.) with OLS
As shown in Table 1, all variables are significant at the level of 1%. Variables associated with the
convergence of market shares (CONV) and with the wholesale prices (WP) seem to have a negative coefficient. This means that an increase in one of these variables will decrease the critical threshold of preference for collusion (C.T.P.C.) and will make it for the operators easier to collude. All the other variables are positively correlated with the critical threshold of preference for collusion (C.T.P.C.).
6
Conclusion:
The model we present above determines the critical threshold of preference for collusion (C.T.P.C.) depending on the market structure and the nature (private or public) of the operators that are present on the market. This threshold is a relevant indicator available for the regulator to estimate the preferences of the operators to collude. To keep a certain degree of competition, the regulator, as in Flacher and Jennequin (2007), can set the level of interconnection rate at a level that minimizes the preference for collusion. Our study shows also that the critical incentive to collude depends on the level of interconnection fees. When these fees vary, the curve of the critical threshold of preference for collusion (C.T.P.C.) is generally convex in a duopoly structure, and becomes concave in presence of three operators. We have shown also that, in a duopoly structure, collusion becomes easier when interconnection fees increase, whereas in a market with three operators, collusion becomes more difficult when interconnection fees are more important. Using the different calculated values of the critical threshold of preference for collusion (C.T.P.C.), and regarding the changes in structures observed on the Tunisian telecommunication market, we find that this estimated threshold is decreasing and convex in time on the Tunisian market during the period 2003-2011, until reaching negative values in 2010. This proves that there is a strong preference for collusion between the Tunisian telephony mobile operators. This preference has increased with the privatization of the public operator that took place in 2006 and with the increase of the number of operators in 2010. Finally, we find that, while studying the
effect of the public-private nature of operators, the number of operators, and hence the market structure is more important than the nature of the operators for the determination of the critical threshold of preference for collusion.
References
[1] Abdel Jaoued, A.: "L’interconnexion aux Réseaux de Télécommunications : L’émergence dun nouveau droit," R.J.L, (2001).
[2] Artz B., Heywood, J. and McGinty, M.: "The merger paradox in a mixed oligopoly," Research in Economics, 63,1-10, (2009).
[3] Baranes, E. and Flochel, L.: "Interconnexion de réseaux et qualité de l’infrastructure comme barrière à lentrée : Quels Instruments de Régulation," Recherches Economiques de Louvain 65(1), (1999).
[4] Baranes, E. and Poudou, J.C.: "Cost-based access regulation and collusion in a differentiated duopoly," Economics Letters, 106, 172176, (2010).
[5] Bulatovic, V.: "Les Enjeux Economiques de l’Interconnexion des Réseaux de Télécommunications," Thesis (PhD in Economics), University Of Orleans, (2004).
[6] Chamberlin, E.H.: “The Theory of Monopolistic Competition,” Cambridge. Mass. (1933).
[7] Colombier, N., M’Chirgui, Z. and Pénard, T.: "Une analyse empirique des stratégies d’interconnexion des opérateurs internet,” Journal déconomie industrielle, No 131, pp. 25-50, (2010).
[8] Cortade, T.: “Règlementation, Structures de Marché et Comportements Stratégique Sur le Marché de l’Internet,” Thesis (PhD in Economics), University of Montpellier, (2005).
[9] De Donder, P.: "L’entreprise publique en concurrence : les oligopoles mixtes," Revue française
d’économie. Volume 20 No 2, 2005. pp. 11-50, (2005).
[10] Debbichi, S. and Ben Khalifa, A.: "Market conduct, interconnection costs and benchmarking in mobile phone industry: the Tunisian case," Int. J. Mobile Learning and Organisation, Vol. 7, No. 1, (2013) [11] Dessein, W.: “Networkcompetition in nonlinear pricing,” RAND Journal of Economics, Vol. 34, No 4,
pp. 593-611, (2003).
[12] Flacher, D., and Jennequin, H.: "Réguler le secteur des Télécommunications ? Enjeux et perspectives," ed. Economica, (2007).
[13] Flochel, L.: "Interconnexion de Réseaux et Charges daccès : Une Analyse stratégique," Annales
d’économie et de statistique, No 53, (1999).
[14] Friedman, J.: "A non-cooperative equilibrium for supergames", Review of Economic Studies 38 (1): 1-12, (1971).
[15] Girardi, B.: “L’utilisation de la comptabilité de gestion dans la régulation : le cas de la régulation de l’interconnexion dans les télécommunications en France”, (2007).
[16] Hoffler, F.: "Mobile Termination and collusion, Revisted," Journal of Regulatory Economics, vol. 35, pp. 246-274, (2009).
[17] Laffont, J.-J. and Tirole, J.: “Competition in Telecommunications.” Cambridge, Mass.: MIT Press, (2000).
[18] Ouattara, S.K.: "Profitabilité des fusions dans un oligopole mixte asymétrique," Working Paper CREM, No 26, (2011).
[19] Parker, P.M. and Roller, L.H.: "Collusive conduct in duopolies: multimarket contact and cross-ownership in the mobile telephone industry," RAND Journal of Economics Vol. 28, No. 2, pp. 304-322, (1997). [20] Parsons, S.G.: "Laffont and Tirole’s Competition in Telecommunications: a view from the US,”
Inter-national Journal of the Economics of Business, Vol.9, Nř3, pp. 419-436, (2002).
[21] Pénard, T.: "Collusion et Comportement dynamiques en oligopole : une synthèse," working paper CREREG, University of Rennes 1, (1997).
[22] Pénard, T.: “Structures du marché et pratiques facilitant la collusion : une approche par la théorie des jeux répétés,” Économie rurale, Vol. 277, No 277-278, pp. 80-98, (2003)
[23] Schiff, A.F.: "Three Essays in Network Economics: Two-Way Interconnection, Two-Sided Networks, and Reputation Systems," Thesis (PhD in Economics), University of Auckland, (2005).
[24] Selten, R.: “A simple model of imperfect competition, where 4 are few and 6 are many,” International Journal of Game Theory, Volume 2, Issue 1, pp 141-201, (1973).