Security
John R. GoodallAbstractNetworked computers are ubiquitous, and are subject to attack, misuse, and abuse. Automated systems to combat this threat are one potential solution, but most automated systems require vigilant human oversight. This automated approach undervalues the strong analytic capabilities of humans. While automation affords opportunities for increased scalability, humans provide the ability to handle excep-tions and novel patterns. One method to counteracting the ever increasing cyber threat is to provide the human security analysts with better tools to discover pat-terns, detect anomalies, identify correlations, and communicate their findings. This is what visualization for computer security (VizSec) researchers and developers are doing. VizSec is about putting robust information visualization tools into the hands of humans to take advantage of the power of the human perceptual and cognitive processes in solving computer security problems. This chapter is an introduction to the VizSec research community and the papers in this volume.
1 Computer Security
In The Cuckoo’s Egg, astronomer-turned-systems administrator Cliff Stoll (Stoll, 1989) recounted his experience identifying and tracking a hacker through the nascent Internet in the mid-1980s. Through perseverance, creativity (he once dan-gled his keys over the telephone modem lines to create interference to slow down and frustrate the intruder), and extensive coordination and collaboration with other systems administrators, Stoll’s actions led to the uncovering of an international spy ring that had infiltrated U.S. military systems. The intruder was initially detected from a seventy-five cent accounting error.
J. Goodall
Secure Decisions division of Applied Visions, Inc., 6 Bayview Ave. Northport NY 11768, e-mail:
In the two decades since Stoll’s investigation, computer security has become an overriding concern of all types of organizations. New systems and protocols have been developed and adopted to prevent and detect network intruders. But even with these advances, the central feature of Stoll’s story has not changed: humans are still crucial in the computer security process. Administrators must be willing to patiently observe and collect data on potential intruders. They need to think quickly and cre-atively. They collaborate and coordinate their actions with colleagues. Humans are still as central to computer security today as they were twenty years ago. Technolo-gies have evolved and many security processes have been automated, but the ana-lytic capabilities and creativity of humans are paramount in many security-related practices, particularly in intrusion detection, the focus of this chapter. Because of this, not all security work should be or can be automated. Humans are – and should be – central to security practice. This central feature of computer security is at the core of visualization for computer security (VizSec).
Many things have changed since Stoll’s time. In conjunction with the rapid growth of the Internet and increased organizational dependence on networked formation technology, the frequency and severity of network-based attacks has in-creased drastically (Allen et al., 1999). At the same time, there is an inverse relation-ship between the decreasing expertise required to execute attacks and the increasing sophistication of those attacks; less skill is needed to do more damage (McHugh, 2001). As we have come more and more to rely on the ability to network computers and access information online, attacks are becoming more pervasive, easier to carry out, and more destructive.
Despite this increasing threat and concerted efforts on preventative security mea-sures, vulnerabilities remain. The reasons for these include: programming errors, design flaws in foundational protocols, and the insider abuse problem of legitimate users misusing their privileges (Lee et al., 2000). While it is theoretically possible to remove all security vulnerabilities through formal methods and better engineer-ing practices, practically it remains infeasible (Hofmeyr et al., 1998). Thus, even as security technologies and practices improve, the threat to network infrastructures remains.
Automated systems to combat this threat are one potential solution, but most automated systems require vigilant human oversight. This automated approach un-dervalues the strong analytic capabilities of humans. While automation affords op-portunities for increased scalability, humans provide the ability to handle exceptions and novel patterns. A technical report on intrusion detection technologies noted that while security vendors attempt to fully automate intrusion diagnosis, a more realis-tic approach is to involve the human in the diagnosrealis-tic loop; computers can process large amounts of data, but cannot match humans’ analytic skills (Allen et al., 1999). Humans excel at recognizing novel patterns in complex data and computer se-curity support tools should integrate these intricate sense-making capabilities of the human analyst with the ability of technology to process vast quantities of data. In order to effectively support human analysts and keep them in the diagnostic loop, it is necessary to fully comprehend the work security analysts do, how they do it,
and how their work processes can be improved by taking advantage of the inherent strengths of both technology and humans.
One method to counteracting this ever increasing threat is to provide the hu-man security analysts with better tools to discover patterns, detect anomalies, iden-tify correlations, and communicate their findings. This is what visualization for computer security (VizSec) researchers and developers are doing. VizSec is about putting robust information visualization tools into the hands of humans to take ad-vantage of the power of the human perceptual and cognitive processes in solving computer security problems.
2 Information Visualization
Because of the vast amounts of data analysts work with, the need to recognize pat-terns and anomalies, and the importance of keeping humans in the loop, information visualization shows great potential for supporting computer security work. Put sim-ply, information visualization turns data into interactive graphical displays. Infor-mation visualization takes advantage of the highest bandwidth human input device, vision, and human perceptual capabilities. Information visualization can be used for exploration, discovery, decision making, and to communicate complex ideas to others.
Information visualization is distinct from the broader field of data graphics. In-formation visualization is interactive; the user will have tools to adjust the display in order to gain a more meaningful understanding of the data being presented. Unlike scientific visualization, which is concerned with representing physically-based data (such as the human body, molecules, or geography), information visualization rep-resents abstract data; to do so often requires creativity on the designers’ part since there is no existing structure to map the data to the graphical display. This is one of the inherent problems in developing an effective information visualization: mapping the data spatially in a meaningful manner. At the core of information visualization is the goal of amplifying cognition, the intellectual processes in which information is obtained, transformed, stored, retrieved, and used (Card, 2003). Information vi-sualization is able to augment cognition by taking advantage of human perceptual capabilities.
Information visualization involves the use of computer-supported, visual repre-sentations of abstract data to amplify cognition by taking advantage of human per-ceptual capabilities (Card et al., 1999). Card, Mackinlay, and Shneiderman (1999) propose six ways that information visualization can amplify cognition: (1) increased resources, (2) reduced search, (3) enhanced recognition of patterns, (4) enabling per-ceptual inference, (5) using perper-ceptual monitoring, and (6) encoding information in a manipulable medium. Visualization increases memory and processing resources by permitting parallel processing of data and offloading work from the cognitive to perceptual memory. Graphical information displays can often be processed in paral-lel, as opposed to textual displays, which are processed serially. Visualization shifts
the cognitive processing burden to the human perceptual system, which can expand working memory and the storage of information. Information visualization reduces the processes of searching by grouping information together in a small, dense space. Pattern recognition, one of the key elements in recognizing intrusion detections, is another of the benefits of visualization, which emphasizes recognition rather than re-call, another way in which working memory is expanded. Visual representations can often make an anomaly obvious to the user by taking advantage of human percep-tual inference and monitoring abilities. Finally, information visualization encodes the data in a manipulable form that permits the user to browse and explore the data.
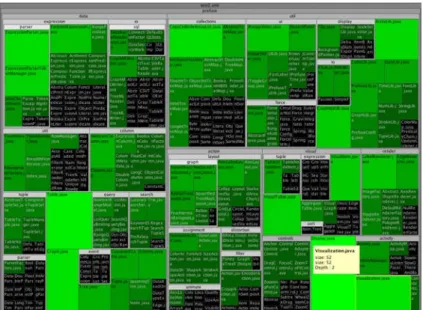
Fig. 1 A treemap visualization of the source code for the prefuse visualization toolkit showing the hierarchy of the code as it is organized into packages, where each node represents a source code file and the size of nodes shows the file size and color the last modified date.
One of the most successful examples of an information visualization technique is the treemap. The original treemap layout was designed by Ben Shneiderman to ef-fectively use display space when visualizing a hard drive’s files and their attributes, such as file size and type (Shneiderman, 1992). The treemap was a recursive al-gorithm that split the display space into rectangles alternating in horizontal and vertical directions. The size and the color of the leaf node rectangles can encode attributes of the data. In the original implementation visualizing a computer disk, color represented file type and size represented file size. An example application of a treemap is an alternative method of viewing software source code, as shown in Fig. 1. In this example, nodes represent source code files organized into their package hierarchy. Color is used to show the file’s last modification time, with green hues being more recently modified. Treemap visualizations have been adapted to many
different applications of understanding hierarchical data, such as newsgroup activ-ity, stock market performance, election results, and sports statistics. (For a history of treemaps and their many applications by Ben Shneiderman, see (Shneiderman, 2006)).
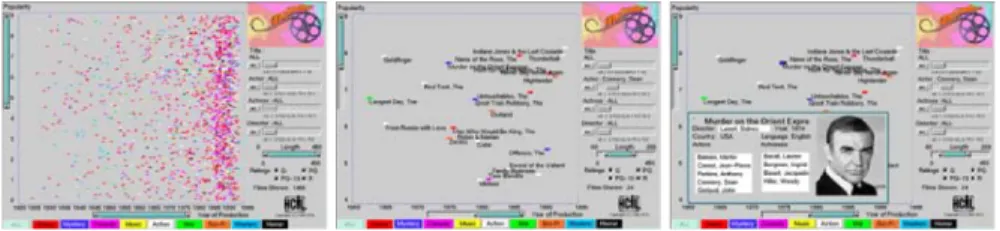
Fig. 2 The FilmFinder information visualization application combining a starfield display with dynamic queries. c1994 ACM, Inc. Included here by permission.
FilmFinder, shown in Fig. 2, is an early example of an information visualiza-tion that highlights the importance of interacvisualiza-tion (Ahlberg and Shneiderman, 1994). FilmFinder combines a starfield display, a scatterplot where each data item is repre-sented by a point, with dynamic queries so that the display is continuously updated as the user filters to refine the selection. This is an excellent example of the impor-tance of interaction in information visualization. The display itself is fairly simple, time is plotted on the x axis and ratings on the y axis with color coded to genre. But the dynamic queries through sliders and other widgets prevent user errors and instantly show the results of complex queries. The system is an exemplar of the Visual Information-Seeking Mantra: Overview First, Zoom and Filter, then Details on Demand (Shneiderman, 1996). This approach encourages exploration and un-derstanding of the data set as a whole, while providing a method for drilling down to the actual data details. Many of the VizSec systems described below follow this methodology.
3 Visualization for Computer Network Defense
There are many potential applications of information visualization to the problems of computer security, including:
• Visualization for detecting anomalous activity • Visualization for discovering trends and patterns • Visualization for correlating intrusion detection events • Visualization for computer network defense training • Visualization for offensive information operations
• Visualization for seeing worm propagation or botnet activity • Visualization for forensic analysis
• Visualization for understanding the makeup of malware or viruses • Visualization for feature selection and rule generation
• Visualization for communicating the operation of security algorithms
This is a non-exhaustive list of the kinds of tasks that VizSec tools can be designed to support. Because networks and the Internet are so important to the operations of today’s organizations and since the network is the source of most computer based attacks, the majority of VizSec research has targeted supporting the tasks associated withthe defense of enterprise networks from outside attack or insider abuse. This section will focus on the data sources and results of the research into visualization for computer network defense (CND).
3.1 Data Sources for Computer Network Defense
The research of VizSec for computer network defense can be organized according to the level of networking data to be visualized. At the base, most raw level is a network packet trace. A packet consists of the TCP/IP header (which defines how a packet gets from point A to point B) and payload data (the contents of the packet). At a higher level of abstraction is a network flow. Originally developed for accounting purposes, network flows have been increasingly used for computer security applica-tions. A flow is an aggregated record of the communications between two distinct machines. A flow is typically defined by the source and destination Internet Proto-col addresses, the source and destination ports, and the protoProto-col. Flows are much more compact than packet traces, but sacrifice details and have no payload data. At a higher level of abstraction are automated systems that reduce network data to in-formation such as an intrusion detection system (IDS). An IDS examines network traffic and automatically generates alerts of suspicious activity. All three of these levels operate on the enterprise network level. At a finer level of granularity is the visualization of data about individual computer systems or applications, and at a higher level is the visualization of data about the Internet.
The remainder of this section will describe a selection of VizSec research that targets the enterprise network level, which is generally the focus of CND.
3.2 VizSec to support Computer Network Defense
This section presents representative visualization research projects for each of the levels of enterprise network security. The examples presented here each solve an important problem. Rumint facilitates the understanding of packet payloads; tnv al-lows analysts to move from a high-level overview of packet activity to raw details; NVisionIP enables analysts to use visualization to create automation rules; FlowTag assists collaboration and sharing through tagging of data; VisAlert enables the in-tegration of multiple data sources through a what, where, when paradigm; and IDS
Rainstorm highlights the importance of multiple, linked views at different levels of semantic detail.
3.2.1 Packet Trace Visualizations
At the most granular level of enterprise network data are raw packet traces. This kind of data is useful for understanding the behavior of networks and as a supplementary source for analyzing security events, but is typically collected and analyzed on anad hocbasis, not systematically, since the data can become very large. To help analysts cope with this copious packet data, researchers are looking at ways to visualize packet headers and payloads.
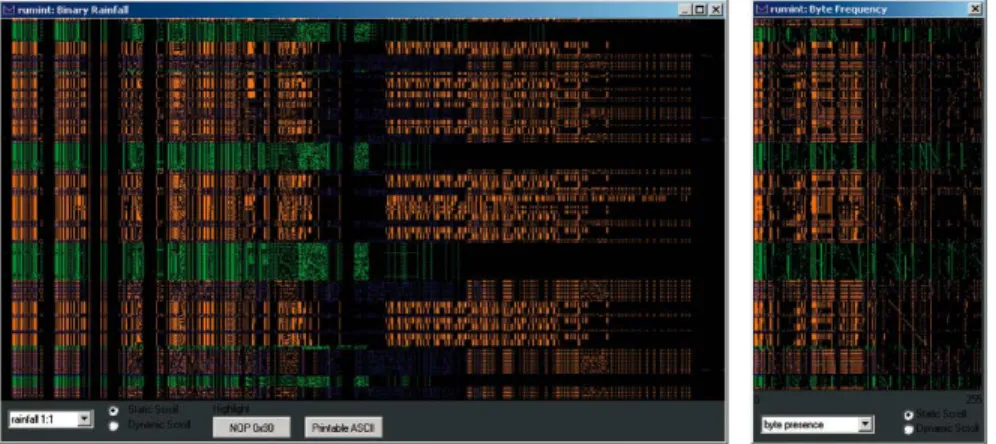
Fig. 3 Rumint visualization: binary rainfall visualization where each row represents a packet and each column in the row represents a bit in the packet (left), and byte frequency visualization where each row represents one of 256 byte values and each column in the row represents the frequency of that byte in the packet (right). c2006 IEEE, Inc. Included here by permission.
One example is rumint,shown in Fig. 3, which uses a novel visualization called binary rainfall, in which each packet is plotted one per row where each pixel rep-resents a bit in the packet (Conti et al., 2006, 2005). Multiple packets are shown in time series order at multiple semantic levels. An additional view presents a byte frequency visualization, where each packet is plotted on a row where each pixel represents byte values of 0-255. Pixels for each row are drawn according to the fre-quency of that byte in the packet. The system is unique in that it provides a graphical plotting of packet payload data, plotted according to the bit value. Rumint also in-cludes other views into the data, such as a parallel coordinate plot to show network connections.
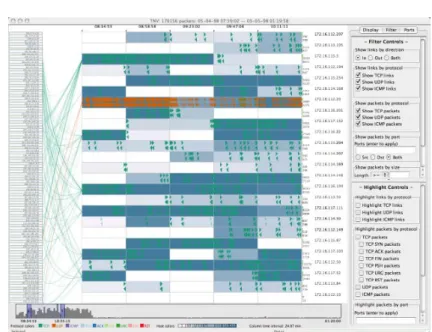
Tnv, shown in Fig. 4, is a visualization tool designed to facilitate the analysis pro-cesses of CND by providing a visual display that can facilitate recognizing patterns and anomalies over time – thereby increasing support for learning and
recogniz-Fig. 4 Tnv visualization showing 170,000 packets. Remote hosts at the left and local hosts at the right of the display, with links drawn between them; packets are drawn for local hosts over time and color is used to represent protocol and packet frequency for a time period.
ing normal traffic behavior patterns – coupled with more focused views on packet-level detail that can be understood in the context of the surrounding network traffic (Goodall et al., 2005, 2006). The display is split between three areas. To the left is a narrow area that displays remote hosts, in the center is the area that displays links between hosts, and the large area to the right displays local hosts (those defined as being local to the user), which is divided into a matrix where each row represents a unique local host and each column represents a time interval, with each resulting cell color coded to the number of packets to and from that host within that time period. Bisecting the display to separately show local and remote hosts increased the scalability of the visual display, so that many more hosts can be displayed at once by dividing the available screen real estate between local and remote hosts. In addition to being able to display more hosts at a time, this partitioning also fits well with analysts’ perceptions of what they deem to be important. Because local hosts are of primary concern in ID analysis, the majority of the display space is devoted to the local hosts. The details of individual packets can be displayed on demand.
3.2.2 Network Flow Visualizations
Network flows are aggregations of packet traces according to the hosts, ports, and protocol involved. Because it is aggregated, flows can be systematically collected and stored, and then used in forensic analysis when an intrusion occurs or
moni-tored for anomalous activity. In either case, the volume of data makes textual anal-ysis difficult and a number of researchers are looking at visualization methods for analyzing flow data.
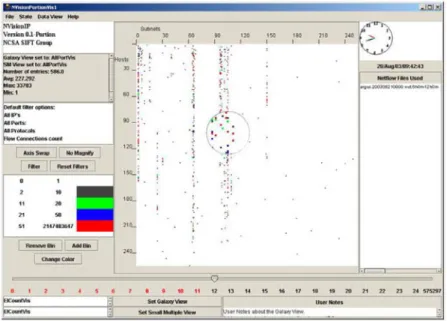
Fig. 5 NVisionIP visualization’s galaxy view, a scatterplot that puts subnets (the third octet of the class-B network) along the x axis and hosts (the fourth octet) along the y axis to present an overview of network flows for a class-B network. Animation can be used to visualize traffic flows over time. c2004 ACM, Inc. Included here by permission.
NVisionIP is geared to increasing an analyst’s situational awareness by visualiz-ing flows at multiple levels of detail (Lakkaraju et al., 2005, 2004) . At the highest level of aggregation, NVisionIP, shown in Fig. 5 displays an entire class-B network (65,534 possible addresses) as a scatterplot of colored hosts to facilitate understand-ing the state of a network. NVisionIP also provides the ability to drill down into the data through a small-multiple view and a histogram of host details. NVisionIP was also extended to ”close the loop” by allowing users to create rules from the visualiza-tion that can then automatically alert on new data. This concept will likely become increasingly common in VizSec applications in the years to come. Machines excel at pattern matching, humans excel at recognizing novel patterns. This approach allows for both machines and humans to do what they do best.
FlowTag, shown in Fig. 6, is a system to visualize network flows and to tag the data to support analysis and collaboration (Lee and Copeland, 2006). Tagging allows analysts to label key elements during the analytic process to reduce the cog-nitive burden of analysis and maintain context. Tagging can also be used for sharing and collaboration. Tagging has become popular recently with social networking and
Fig. 6 FlowTag visualization showing flow connection information on a parallel coordinate plot of destination port on one axis and source IP address on the other organized in order of appearance; color represents the selection state. c2006 ACM, Inc. Included here by permission.
social bookmarking sites; adapting the concept to CND should be encouraged in all VizSec applications. FlowTag brings the popular concept of tagging to the problems of analyzing and sharing network security data.
3.2.3 Alert Visualizations
Intrusion detection, the process of using computer network and system data to iden-tify potential cyber attacks, has become an increasingly essential component of the information security infrastructure. However, due to the dynamic and complex na-ture of computer networks and the potential for inappropriate or self-damaging re-sponses to potential attacks, intrusion detection systems (IDSs) are only effective when complemented by a human analyst. To help manage the analysis of IDS alerts, several researchers have turned to information visualization.
VisAlert is a flexible visualization that correlates multiple data sources, such as IDS alerts and system logs files (Livnat et al., 2005a,b). Correlation is based on the What, When and Where attributes of the data. VisAlert, shown in Fig. 7, inte-grates these into a single display depicting alerts as vectors between the perimeter, representing alert time (when) and type (what), and the interior, representing net-work topology (where), of a radial view. This system represents one of the more sophisticated and novel visualizations to solve the important problem of correlating disparate events. This is a significant example of a novel approach to support the integration of multiple data sources within a unified display.
Fig. 7 VisAlert visualization of correlated intrusion detection alerts showing alerts along outer rings and network topology maps in the center. c2005 IEEE, Inc. Included here by permission.
IDS Rainstorm, shown in Fig. 8, focuses on scalability, mapping IDS alerts to pixels over time (Abdullah et al., 2005; Conti et al., 2006). Zooming and drilling down to the details allow the users to understand the details of their IDS data. The overview visualization aggregates 20 IP addresses for each row of pixels, organized sequentially from top to bottom and the columns wrap around at the bottom of the display. Each column represent 24 hours of alerts. By wrapping the columns, IDS Rainstorm can represent 2.5 class B IP networks (163,830 hosts) in a single display. This type of display, similar to the software visualization tool SeeSoft (Eick et al., 1992), maximizes the available display space to provide an overview of very large data sets. The color of the pixels represent the severity of the associated alerts (the highest severity of the group of 20 is used). A second display screen is used to show a zoomed in view, which shows larger glyphs to represent alerts and also adds semantic details to show connections between the internal IP address space and external IP addresses represented in the alert. Like NVisionIP, this is a noteworthy example of synchronizing multiple views to show different levels of semantic detail.
Fig. 8 IDS Rainstorm maps intrusion detection alerts to pixels in the overview visualization that wraps columns of IP address activity over a 24 hour time period. c2006 IEEE, Inc. Included here by permission.
4 Papers in This Volume
The papers collected in this volume were presented at the Fourth VizSec Workshop for Computer Security, held in conjunction with IEEE Vis and InfoVis in Sacra-mento, California in 2007. This collection presents the state of the art in VizSec research.
4.1 Users and Testing
Anita D’Amico and Kirsten Whitley open this volume with an invited chapter enti-tledThe Real Work of Computer Network Defense Analysts: The Analysis Roles and Processes that Transform Network Data into Security Situation Awareness. This
chapter is intended to frame the central problems of CND work that security visual-ization applications attempt to solve. The authors report on the results of their cog-nitive task analysis of CND analysts in the U.S. Department of Defense. They cover three of the findings from the task analysis: the cognitive transformation process from raw data into security situation awareness, the identification and description of the analysis roles in CND, and CND analysts’ workflow across organizations. The authors conclude by linking their findings to visualization design; drawing valuable implications for future VizSec researchers and developers.
Jennifer Stoll, David McColgin, Michelle Gregory, Vern Crow, and W. Keith Ed-wards apply a user-centered design method to VizSec inAdapting Personas for Use in Security Visualization Design. The authors turn to Human-Computer Interaction and Participatory Design research to solve the problem of requirements capture by using personas. Personas are an archetype description of a system’s target users that provide a framework for organizing requirements. Rather than approach users for feedback on design, designers can turn to the personas to simulate how well a de-sign meets user requirements. This chapter demonstrates how user-centered dede-sign methodologies can be applied to VizSec software development.
Xiaoyuan Suo, Ying Zhu, and G. Scott Owen focus on evaluating VizSec soft-ware inMeasuring the Complexity of Computer Security Visualization Designs. The authors propose an alternative evaluation method to user studies: complexity anal-ysis. VizSec designers developers can use this method to evaluate a set of factors that affect the ability of users to understand a visualization. Complexity is mea-sured across several dimensions, including visual integration, separable dimensions for each visual unit, the complexity of interpreting the visual attributes, and the ef-ficiency of visual search. The authors demonstrate the complexity analysis method with two VizSec applications, rumint and tnv, which were described in section 3.2.1. Tamara H. Yu, Benjamin W. Fuller, John H. Bannick, Lee M. Rossey, and Robert K. Cunningham address the difficulty of supporting network testbed operations in Integrated Environment Management for Information Operations Testbeds. Net-work testbeds are crucial in the design and testing of information operations soft-ware, but as testbeds become more realistic, they also become more complex to set up and manage. The authors present a visual interface that facilitates test specifica-tion, testbed control, and testbed monitoring through multiple information visual-ization techniques.
4.2 Network Security
Doantam Phan, John Gerth, Marcia Lee, Andreas Paepcke, and Terry Winograd present a VizSec system called Isis inVisual Analysis of Network Flow Data with Timelines and Event Plots, which was named the workshop’s Best Paper winner. Isis supports the analysis of network flow data through two visualization methods, progressive multiples of timelines and event plots, to support the iterative investiga-tion of intrusions. Isis combines visual affordances with structured query language
(SQL) to minimize user error and maximize flexibility. Isis keeps a history of a user’s investigation, easily allowing a query to be revisited and a hypothesis to be changed. A detailed case study using anonymized data of a real intrusion demon-strates the features of Isis.
Teryl Taylor, Stephen Brooks, and John McHugh present another VizSec system for network flow analysis inNetBytes Viewer: An Entity-based NetFlow Visualiza-tion Utility for Identifying Intrusive Behavior. NetBytes Viewer plots network flow data per port of an individual host machine or subnet on a network over time in 3D. The Z axis displays the ports, the X axis displays time, and the Y axis displays the magnitude of traffic (in flows, packets, or bytes) seen by the host (or subnet) in an hour.
Denis Lalanne, Enrico Bertini , Patrick Hertzog, and Pedro Bados describe a vi-sualization approach to support multiple user roles inVisual Analysis of Corporate Network Intelligence: Abstracting and Reasoning on Yesterdays for Acting Today. The authors present a pyramidal vision of network intelligence to support more than just the daily monitoring of networks. In addition to the system and security ana-lysts, the authors argue that other user profiles are interested in network intelligence, such as the the helpdesk, legal department, and the chief executive officer. They present two methods of network analysis, taking a user/application centric view and alarm/temporal centric view.
Jason Pearlman and Penny Rheingans take a service-oriented perspective to vi-sualizing network traffic inVisualizing Network Security Events Using Compound Glyphs from a Service-Oriented Perspective. The authors present a node-link visu-alization in which each node is represented as a compound glyph that provides an indication of the node’s service usage. Time slicing is also used in these glyphs to provide an indication of time.
Barry Irwin and Nicholas Pilkington attempt to map large IP spaces using Hilbert curves inHigh Level Internet Scale Traffic Visualization Using Hilbert Curve Map-ping. Network telescope (also called DarkNets) are large collections of IP space with no hosts; all traffic collected on a network telescope is sent to a non-existant host. These dead end communications are never legitimate and provide indications of backscatter, scanning, and worm activity. The authors use Hilbert curves, a space filling curve that preserves locality (i.e. ordered data will remain ordered along the curve), to map the activity on large network telescopes.
4.3 Communication, Characterization, and Context
Stefano Foresti and James Agutter present their experience with the design of a VizSec system inVisAlert: From Idea to Product. VisAlert, described above in sec-tion 3.2.3, is a VizSec system that can correlate data from multiple sources into a unified visualization. In this invited chapter, the authors describe the design process from the conception of rough visual sketches to the implementation and deployment
of a production-ready software and the issues that the design team had to address to carry the project from concept to product.
Dino Schweitzer, Leemon Baird, and William Bahn present a visualization of their security algorithm inVisually Understanding Jam Resistant Communication. Their algorithm, BBC, is based on a new type of coding theory known as concur-rent codes that is resistant to traditional jamming techniques. The authors found it difficult to explain the formal definition and proofs to non-mathematicians, and so turned to visualization as a communication device to visually demonstrate the algorithm’s effectiveness.
Florian Mansman, Lorenz Meier, and Daniel A. Keim present an approach to visualizing host behavior inVisualization of Host Behavior for Network Security. The authors use a force-directed graph layout to look at changes in host behavior over time to assist in the detection of uncommon behavior. A node represents the state of one host for a specic interval and its position is determined by its state at that interval. So as hosts’ states change, their position also changes, allowing analysts to easily see changes over time.
William A. Pike, Chad Scherrer, and Sean Zabriskie focus on bringing context into visualization inPutting Security in Context: Visual Correlation of Network Ac-tivity with Real-World Information, which was named the workshop’s Best Paper runner-up. The central tenant of the paper is that CND analysts use their own un-derstanding of the world to put security events into context. In order to support this necessary analytic step, the authors demonstrate a system, called NUANCE, that creates behavior models for network entities at multiple levels of abstraction and fuses these models with contextual information on current threats and exploits from textual data sources.
4.4 Attack Graphs and Scans
Leevar Williams, Richard Lippmann, and Kyle Ingols present an elegant solution to visualizing attack graphs inAn Interactive Attack Graph Cascade and Reacha-bility Display. Attack graphs present potential critical paths that could be used by adversaries to compromise networked hosts based on their known vulnerabilities. Attack graphs are useful for understanding the vulnerability level of a network, but are often too complex to understand. The authors present a visual solution for attack graph comprehension based on treemaps. Multiple treemaps are used to cluster host groups in each subnet. Hosts within each treemap are grouped based on reachability, attacker privilege level, and prerequisites.
Chris Muelder, Lei Chen, Russell Thomason, Kwan-Liu Ma, and Tony Bartoletti combine machine learning and visualization to tackle the problem of classifying scanning activity inIntelligent Classification and Visualization of Network Scans. The authors present a system that uses associative memory learning techniques to compare network scans in order to create classifications. The classifications can be used with visualization to characterize the source of scans.
Barry Irwin and Jean-Pierre van Riel describe a 3D visualization for traffic anal-ysis inUsing InetVis to Evaluate Snort and Bro Scan Detection on a Network Tele-scope. Source IP address, destination IP address, and destination port are mapped to the three axes in InetVis for TCP and UDP traffic and a separate plane is shown be-low this cube (with no port information) for ICMP traffic. InetVis also incorporates textual filtering and querying using the powerful and flexible the Berkeley Packet Filter syntax. The authors use the visualization to examine the scan detection ca-pabilities two intrusion detection systems to identify possible flaws in those scan detection algorithms.
5 Conclusion
VizSec is a growing community that is attempting to solve the important problems of computer security through enabling humans through information visualization. This chapter has highlighted the motivation for VizSec and presented some of the tasks VizSec tools support and the data sources visualized. Examples of visualizations of packet traces, network flows, and intrusion detection alerts were presented to provide an understanding of some of the themes that VizSec research has grappled with and solved, particularly for computer network defense.
References
Abdullah, K., Lee, C., Conti, G., Copeland, J.A., Stasko, J.: Ids rainstorm: Visu-alizing ids alarms. In: Proceedings of the IEEE Workshop on Visualization for Computer Security (VizSEC), pp. 1–10 (2005)
Ahlberg, C., Shneiderman, B.: Visual information seeking using the filmfinder. In: ACM Conference Companion on Human Factors in Computing Systems (CHI), pp. 433–434. ACM (1994)
Allen, J., Christie, A., Fithen, W., McHugh, J., Pickel, J., Stoner, E.: State of the practice of intrusion detection technologies. Tech. Rep. CMU/SEI-99-TR-028, Carnegie Mellon University/Software Engineering Institute (1999)
Card, S.K.: Information visualization. In: Jacko, J.A., Sears, A. (eds.) The Human Computer Interaction Handbook, pp. 544–582. Lawrence Erlbaum Associates, Mawah, NJ (2003)
Card, S.K., Mackinlay, J.D., Shneiderman, B. (eds.): Information Visualization: Us-ing Vision to Think. Morgan Kaufman Publishers, San Francisco, CA (1999) Conti, G., Abdullah, K., Grizzard, J., Stasko, J., Copeland, J.A., Ahamad, M., Owen,
H., Lee, C.: Countering security analyst and network administrator overload through alert and packet visualization. IEEE Computer Graphics and Applica-tions26(2), 60–70 (2006)
Conti, G., Grizzard, J., Ahamad, M., Owen, H.: Visual exploration of malicious network objects using semantic zoom, interactive encoding and dynamic queries. In: Proceedings of the IEEE Workshop on Visualization for Computer Security (VizSEC), pp. 83–90 (2005)
Eick, S.G., Steffen, J.L., Eric E. Sumner, J.: Seesoft-a tool for visualizing line ori-ented software statistics. IEEE Transactions on Software Engineering 18(11), 957–968 (1992)
Goodall, J.R., Lutters, W.G., Rheingans, P., Komlodi, A.: Preserving the big picture: Visual network traffic analysis with tnv. In: Proceedings of the IEEE Workshop on Visualization for Computer Security (VizSEC), pp. 47–54. IEEE Press (2005) Goodall, J.R., Lutters, W.G., Rheingans, P., Komlodi, A.: Focusing on context in network traffic analysis. IEEE Computer Graphics and Applications26(2), 72– 80 (2006)
Hofmeyr, S.A., Forrest, S., Somayaji, A.: Intrusion detection using sequences of system calls. Journal of Computer Security6(3), 151–180 (1998)
Lakkaraju, K., Bearavolu, R., Slagell, A., Yurcik, W.: Closing-the-loop: Discovery and search in security visualizations. In: Proceedings of the IEEE Workshop on Information Assurance and Security (IAW), pp. 58–63 (2005)
Lakkaraju, K., Yurcik, W., Lee, A.J.: Nvisionip: Netflow visualizations of system state for security situational awareness. In: Proceedings of the ACM Workshop on Visualization and Data Mining for Computer Security (VizSEC/DMSEC), pp. 65–72 (2004)
Lee, C.P., Copeland, J.A.: Flowtag: A collaborative attack-analysis, reporting, and sharing tool for security researchers. In: Proceedings of the ACM workshop on Visualization for computer security (VizSEC), pp. 103–108. ACM (2006) Lee, W., Stolfo, S.J., Mok, K.W.: Adaptive intrusion detection: A data mining
ap-proach. Artificial Intelligence Review14(6), 533–567 (2000)
Livnat, Y., Agutter, J., Moon, S., Erbacher, R.F., Foresti, S.: A visualization paradigm for network intrusion detection. In: Proceedings of the IEEE Work-shop on Information Assurance and Security (IAW), pp. 92–99 (2005a)
Livnat, Y., Agutter, J., Shaun, M., Foresti, S.A.F.S.: Visual correlation for situational awareness. In: Agutter, J. (ed.) IEEE Symposium on Information Visualization (InfoVis), pp. 95–102 (2005b)
McHugh, J.: Intrusion and intrusion detection. International Journal of Information Security1(1), 14–35 (2001)
Shneiderman, B.: Tree visualization with tree-maps: 2-d space-filling approach. ACM Transactions on Graphics11(1), 92–99 (1992)
Shneiderman, B.: The eyes have it: A task by data type taxonomy of information visualizations. In: Proceedings of the IEEE Symposium on Visual Languages, pp. 336–343 (1996)
Shneiderman, B.: Treemaps for space-constrained visualization of hierarchies
(2006). URLhttp://www.cs.umd.edu/hcil/treemap-history/
Stoll, C.: The Cuckoo’s Egg: Tracking a Spy Through the Maze of Computer Espi-onage. Pocket Books, New York (1989)