EUROPEAN
COMMISSION
Brussels, 26.2.2015
SWD(2015) 42 final
COMMISSION STAFF WORKING DOCUMENT
Country Report Romania 2015
Including an In-Depth Review on the prevention and correction of macroeconomic
imbalances
{COM(2015) 85 final}
This document is a European Commission staff working document . It does not
constitute the official position of the Commission, nor does it prejudge any such position.
CONTENTS
Executive summary 1
1. Scene setter: Economic situation and outlook 3
2. Imbalances, risks and adjustments 12
2.1. External rebalancing and competitiveness 13
2.2. Risk to medium-term export capacity 29
2.3. Financial sector, adjustment and indebtedness 44
3. Other structural issues 55
3.1. Taxation and fiscal framework 56
3.2. Labour market, social issues and education 61
3.3. Governance 72
AA. Overview Table 76
AB. Standard Tables 84
LIST OF TABLES
1.1. Evolution of long-term ratings 6
1.2. Key economic, financial and social indicators 10
1.3. MIP scoreboard indicators 11
2.2.1. EU Funds absorption rates 28
AB.1. Macroeconomic indicators 77
AB.2. Financial market indicators 78
AB.3. Taxation indicators 78
AB.4. Labour market and social indicators 79
AB.5. Labour market and social indicators (continued) 80
AB.6. Product market performance and policy indicators 81
LIST OF GRAPHS
1.1. Real GDP growth by demand components 3
1.2. GDP dynamics 3
1.3. Income per capita, PPS 4
1.4. Components of potential growth 4
1.5. Inflation 5
1.6. Unemployment rates 5
1.7. Government deficit and debt (2006-16) 6
1.8. CDS spreads over BUND 7
1.9. Banking assets evolution (2000-13) and composition by ownership 7
1.10. Profit ROA and ROE 7
2.1.1. NIIP in Romania and peer countries 13
2.1.2. Decomposition of rate of change of NIIP 13
2.1.3. NIIP financing 14
2.1.4. Current account balance by components (4qma) 15
2.1.5. Net lending by sector 15
2.1.6. Current-account balance in peer countries 16
2.1.7. Romanian exports and imports 16
2.1.8. Growth in export market shares in the EU 16
2.1.9. Export market share decomposition 17
2.1.10. Current account balance and output gap 17
2.1.11. Cyclical and non-cyclical CAB 17
2.1.12. Evolution of exports by groups of products 18
2.1.13. Evolution of exports for selected destinations 18
2.1.14. Exports to Germany and Italy, by groups of products 18
2.1.15. Balance of primary incomes 19
2.1.16. REER decomposition 19
2.1.17. ULC in tradable and non-tradable sectors 20
2.1.18. Decomposition of ULC 20
2.1.19. REER vs. export prices 21
2.1.20. Labour productivity per hour worked (EU27=100) 21
2.1.21. Labour productivity in Romania 2008-2013 21
2.1.22. Decomposition of aggregate labour productivity growth 22
2.1.23. Productivity gains/losses due to changes in sectoral productivities (within effect) 22 2.1.24. Dynamism and competitiveness of exports (goods) in top-10 destinations, 2012-13 22 2.1.25. Geographical and sectoral composition of nominal USD rate of change of goods
exports 23
2.1.26. Revealed comparative advantages (goods) 23
2.1.27. Import content of exports 23
2.1.28. High-tech products as a proportion of exports in peer countries 23
2.1.30. GFCF by type 24
2.1.31. Stock of FDI per sector, 2013 25
2.1.32. Stock of FDI in Manufacturing 25
2.1.33. Stock of FDI per country, 2013 25
2.1.34. FDI stocks in tradables vs. non-tradables 25
2.2.1. Quality of public infrastructure 26
2.2.2. Length of motorways, 2012 26
2.2.3. EU funds absorption in Romania and peers 28
2.2.4. EU funds absorption per Operational Programme 28
2.2.5. Ease of doing business 31
2.2.6. Doing business in Romania 31
2.2.7. Importance of SOEs in the Romanian economy 33
2.2.8. Importance of SOEs by sector 34
2.2.9. Equity valuation of SOEs expressed relative to GDP 34
2.2.10. Employment at SOEs as a proportion of total employment 34
2.2.11. Return on equity of SOEs and foreign-owned companies compared to domestic
privately-owned companies 35
2.2.12. Staff expenses at SOEs and foreign-owned companies compared to private-owned
companies 36
2.2.13. Labour productivity of SOEs and foreign owned companies compared to domestic
privately owned companies 36
2.2.14. Total factor productivity of SOEs and foreign owned companies compared to
domestic privately owned companies 36
2.2.15. Payments past due date at state-owned enterprises 37
2.2.16. Return on equity in of SOEs in selected sectors in Romania and neighbouring
countries 38
2.3.1. Structure of the financial sector (%GDP) 40
2.3.2. Private credit in selected countries (%GDP) 40
2.3.3. Credit developments (2004-13, %GDP) 41
2.3.4. Loans to private sector (EUR mn and %ch) 41
2.3.5. Evolution of the NPL ratio at system level 42
2.3.6. Coverage ratio of NPLs (%; comparison with selected regional peers) 42 2.3.7. Evolution of capital adequacy at system level (%; 2007- Q2 2014) 43 2.3.8. Total exposure of the nine euro area foreign parent banks to Romania (EUR bn, March 2009
- August 2014) 43
2.3.9. Loan-to-deposit ratio (RON, FX, Total) 44
2.3.10. Private sector indebtedness (% GDP) 45
2.3.11. HH loans as % of GDP (2008 and 2013) 46
2.3.12. NFC loans as a % of GDP (2008 and 2013) 46
2.3.13. Households’ monthly debt service 46
2.3.14. Household debt developments 47
2.3.16. Relative house price index and price-to-income ratio 47
2.3.17. Residential investment and building permits 48
2.3.18. Loans for house purchase and consumption, % GDP 48
2.3.19. Decomposition of corporate lending growth rate by firm size 48
2.3.20. Financial soundness indicators for corporates 49
2.3.21. Non-performing loans per sector, August 2014 (% of loans in the sector) 49 3.1.1. Change in the tax wedge following 5 pps. reduction, by earnings level 51
3.1.2. VAT gap in selected Member States, 2012 53
3.2.1. Labour market indicators 56
3.2.2. NEETs and inactive NEETs (% of population aged 15-24) 57
3.2.3. Persons at-risk-of-poverty or social exclusion in Romania 58
3.2.4. Participation in lifelong learning 62
3.3.1. Overall profile of public administration 66
3.3.2. Governance indicators, Romania and EU 66
LIST OF BOXES
EXECUTIVE SUMMARY
Under successive assistance programmes key macroeconomic imbalances in Romania concerning the current account and fiscal policy have been considerably reduced and financial
sector stability has been maintained. The
balance of payments financial assistance programmes were successful in restoring macroeconomic stability, re-establishing market access for the sovereign and safeguarding financial stability. After a sharp contraction during the crisis, growth recovered quickly and is back in positive territory since 2011. Growth reached 2.9 % in 2014 and is expected to remain robust. Unemployment remained contained at around 7 % while inflation recently decreased significantly. Fiscal consolidation was frontloaded but spread over various years. The current-account deficit of more than 10 % in 2006-08 was largely corrected to around 1 % of GDP in 2013 on the back of strong exports and only temporarily reduced imports. This correction contributed to improving the (negative) net international investment position to 60 % of GDP. The banking sector weathered the crisis well and capitalisation remains strong.
This Country Report assesses Romania's economy against the background of the
Commission's Annual Growth Survey. The
Survey recommends three main pillars for the EU's economic and social policy in 2015: investment, structural reforms, and fiscal responsibility. In line with the Investment Plan for Europe, it also explores ways to maximise the impact of public resources and unlock private investment. So far, surveillance of economic policies for Romania has taken place under the programmes. In its 2015 Alert Mechanism Report, the Commission found it necessary to determine whether macroeconomic imbalances exist in Romania. This Country Report thus also assesses Romania in the light of the findings of the 2015 Alert Mechanism Report. To this end the Country Report also provides an in-depth review of Romania.
The main findings of the In-Depth Review contained in this Country Report are:
• While Romania’s net international
investment position indicates some remaining risks, key imbalances have been
corrected. The still significantly negative net
international investment position remains a source of macroeconomic vulnerability.
However, export growth points to improved macroeconomic resilience. Formerly unsustainable current-account deficits have been corrected and are expected to remain contained. Labour productivity started to improve only recently, and cost competitiveness is still not ensured. Non-cost competitiveness is still hampered by low investment and innovation and an unfavourable business environment.
• Despite important reforms, deficiencies in
the business environment might threaten much needed investment and Romania’s
export capacity. Structural funds could
significantly contribute to financing important investments, but implementation continues to face major obstacles. Access to finance remains difficult, particularly for small and medium-sized enterprises. Energy and transport infrastructure continues to be a bottleneck to growth. Insufficient quality of education and its mismatch with the labour market, limited public administration capacity and an unstable tax policy constrain investments and exports. Inefficiencies in state-owned enterprises dominating key sectors like energy and transport are a burden on public finances and a drag to the entire economy.
• Private debt has been contained and
financial sector stability has been preserved, but external and internal vulnerabilities
remain. The Romanian banking sector is well
capitalised and liquid, and non-performing loans are on a decreasing trend. Still, deleveraging pressures remain and impaired loans weigh on banks’ profitability. Banks remain vulnerable to adverse developments in the euro area and particularly to home-grown initiatives which may have an adverse impact on the sector that could be mitigated under the balance of payments programme. Private-sector indebtedness remains contained.
The Country Report also analyses macroeconomic and structural issues and the findings are:
• Tax compliance remains limited, while tax
policy is rather unstable. Although measures
Executive summary
administration are being implemented, value added tax compliance is among the lowest in the EU and undeclared work weighs on budget revenues. Frequent changes to the tax system contribute to instability in the business environment.
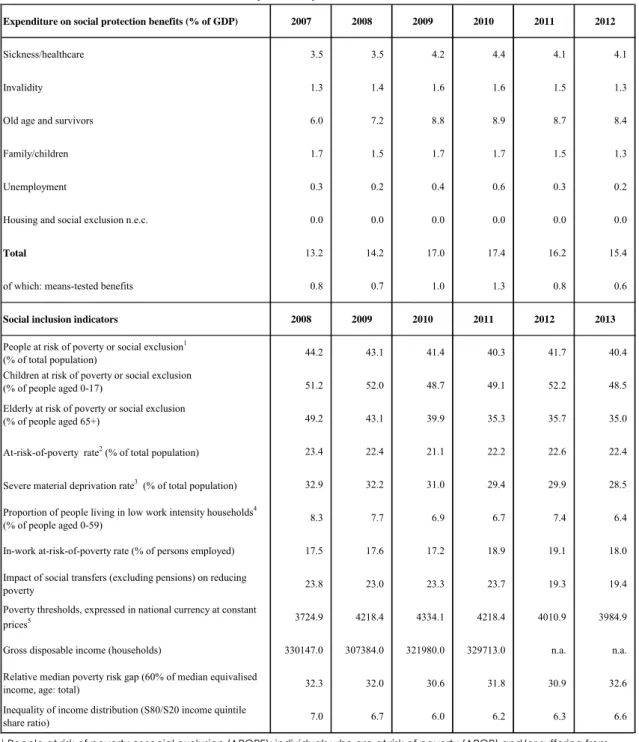
• Labour-market dynamics show signs of
improvement, but structural issues persist. Poverty and social exclusion continue to affect a large proportion of the population. Unemployment is low and decreasing, but this is mostly due to persistently low activity rates. Access to the labour market by vulnerable groups remains difficult and the quality and access to early childhood education and care, vocational training, apprenticeships, higher education, and lifelong learning are low. The capacity of the National Employment Agency is a constraint. Despite important actions, youth unemployment and inactivity rates remain high. Romania has the highest proportion of the population working in agriculture in the EU, with substantial under-employment in subsistence and semi-subsistence farms. Although declining, a large proportion of the population is severely materially deprived. Effectiveness of social transfers is limited. The Roma population experiences worse employment and social outcomes. Children's rights are often not effectively enforced. Healthcare reforms have been stepped up, but healthcare outcomes, accessibility and efficient use of resources remain an issue, in particular in rural areas.
• Persistent weaknesses in public
administration and in the overall business environment weigh on the country’s
economy. Important reforms aimed at
increasing the quality of public services and the predictability and quality of policies, and at achieving a regulatory environment more favourable to business and citizens have been approved, but concrete measures are not yet fully implemented. Consolidating progress on the efficiency, quality and independence of the judicial system and in the fight against corruption remains a challenge.
Overall, Romania has made limited progress in addressing country-specific recommendations.
Implementation of measures envisaged under the balance of payments programme is uneven. Preliminary data puts the 2014 deficit in line with programme objectives; the 2015 budget targets Romania’s medium-term objective of a deficit of 1 % of GDP in structural terms (plus a so-called EU funds adjustor of 0.25 % of GDP); clearance of non-performing loans is progressing; the balance-sheet assessment in the insurance sector is on track; and gas-price liberalisation for non-households comes into effect from 2015. Yet, various reforms have stalled, including privatisations, restructuring of loss-making state-owned enterprises, the adoption of covered bonds legislation, the setting-up of specialised courts for cases involving unfair contract terms, transparent minimum wage setting, equalisation of the pension age of men and women, and improvements in the business environment. In addition, achievements relating to the governance of state-owned enterprises are at risk, and the previously introduced pension reform is threatened by the planned reintroduction of 'special pensions'. There has been limited progress in streamlining energy efficiency policies, cross-border integration of energy networks and physical reverse flows in gas interconnections, and energy price liberalisation for households was delayed. The cut in social security contributions lowered the tax wedge, but it was not targeted at low- and middle-income earners.
The Country Report reveals the following policy challenges stemming from the analysis of
macroeconomic imbalances. Risks for
maintaining fiscal policy and financial sector stability remain, but can be subdued by implementing in full the agreements reached in the balance of payments programme and by ensuring a smooth transition to post-programme surveillance, including strengthening domestic anchors. The main challenges ahead regard: accelerating the pace of structural reforms to improve competitiveness and expand growth; building-up public research capacities in order to develop new sources of growth through research and innovation in the middle term; making best use of EU structural funds to enhance investment, innovation, and employment.
1.
SCENE SETTER: ECONOMIC SITUATION AND OUTLOOK
Economic growth and growth potentialBefore the crisis, Romania recorded high GDP growth rates, which turned out to be
unsustainable in view of emerging imbalances.
Annual real GDP growth averaged 6.5 % in 2001-08 (Graph 1.1), mainly due to strong domestic demand. Both private consumption and investments flourished, initially fuelled by financial deepening and a credit boom. Additionally, an expansionary pro-cyclical fiscal policy sustained growth. The growing levels of imports generated substantial external imbalances (see next section), which were financed by volatile capital inflows.
Graph 1.1: Real GDP growth by demand components
-20 -15 -10 -5 0 5 10 15 20 25 00 01 02 03 04 05 06 07 08 09 10 11 12 13 14 15 16 %, pps Ch. in inventories Investment (GFCF)
Consumption Net exports
Real GDP growth
Source: European Commission
With the onset of the crisis, foreign private
capital inflows declined sharply. This decline
reflected both the increased risk aversion of financial markets and Romania’s vulnerabilities. It led to an external funding gap that was eventually closed by borrowing under a joint EU/IMF/World Bank financial assistance programme. The reduction in foreign capital inflows and the correction measures adopted under the programme led to an immediate but contained adjustment in domestic demand and to a quick recovery of economic growth, after a cumulated contraction in economic activity of almost 8 % over 2009-10.
Economic growth has been back in positive territory since 2011 and is forecast to remain
robust over 2015-16. Since the crisis, GDP
growth has been driven by a gradual recovery of domestic demand and strong exports. Despite a recent acceleration of economic growth, GDP is still below its pre-crisis level (Graph 1.2, expressed in 2010 prices). The pace of real GDP growth is estimated to have slowed down from 3.5 % in 2013 to 3 % in 2014, mainly due to a significant drop in investments. Romania’s economic growth is expected to remain robust in 2015 and 2016, mainly driven by domestic demand and accompanied by a stable labour market. GDP growth is forecast to stay above potential and remain robust at 2.7 % in 2015 and 2.9 % in 2016 based on the Commission 2015 winter forecast. Graph 1.2: GDP dynamics 0 20 40 60 80 100 120 140 160 -10 -8 -6 -4 -2 0 2 4 6 8 10 02 03 04 05 06 07 08 09 10 11 12 13 14 15 16 GDP (SA; 2010 pr) y-o-y %ch q-o-q %ch Forecast
Source: European Commission
Further progress is needed in terms of real
convergence to the EU average level. The
authorities announced the intention to adopt the euro in 2019 but the challenges are substantial. In 2014, Romania fulfilled all the five numerical Maastricht criteria for joining the euro zone. However, as illustrated in Graph 1.3, the country is still well below the convergence level reached by recent euro adopters (i.e. Slovakia, Estonia, Latvia and Lithuania).
Graph 1.3: Income per capita, PPS 26 29 72 43 54 36 38 47 49 79 48 43 81 68 63 60 63 54 71 89 53 46 81 72 66 65 73 67 75 82 0 10 20 30 40 50 60 70 80 90 100 RO BG CZ EE HU LV LT* PL* SK SI 2000 2008 2013
Note: * LT & PL estimation based on ESA 95, 100 represents EU average income per capita
Source: European Commission
The crisis had a large and lasting impact on the
Romanian economy. Potential growth estimates
show that recovering to pre-crisis growth rates is unlikely (Graph 1.4). After a large drop in 2009, potential growth has started a timid recovery. It is forecast to reach 2.9 % in 2019; this is 0.5 % lower than the average potential growth in the pre-crisis period (i.e. 1996-2008). In 2009-12, potential growth has been driven solely by capital accumulation, reflecting the high level of investment in the economy. In turn, in 2013 and 2014 investment fell sharply.
The level of investment remains above EU
average. Investment accounts for almost 24 % of
GDP in Romania as opposed to 19 % of GDP in the EU, in 2013. However, the contribution of investment to the overall competitiveness and growth potential is hampered by instable priorities over time for public investment, which represents almost 20 % of total investment (or 5 % of GDP). Ensuring efficient investments in public infrastructure is an important challenge for the Romanian economy. Developments in investment and implementation of the structural reforms announced under the current (precautionary) balance of payments assistance programme have an impact on the convergence process.
Total factor productivity is projected to gradually increase in the next years while
growth contributions from labour are broadly
neutral. This should come as a result of the labour
and product market reforms started under the previous two balance-of-payments programmes. However, reforms have slowed down lately, limiting the increase in potential growth.
Graph 1.4: Components of potential growth
-2 0 2 4 6 8 03 05 07 09 11 13 15 17 19 Ra te o f chang e y -o-y (% ) Capital contribution TFP contribution Labour contribution Potential growth
Source: European Commission
Price developments
Inflation was persistently high in Romania but
has been decelerating sharply. The high
pre-crisis levels of inflation were not reverted with the 2009 crisis. A succession of upward price shocks resulted in inflation levels well above those in the EU. A sharp drop during the 2008-09 crisis was followed by strong price increases. In 2011, significant increases in indirect taxation led to an inflation peak of 8.5 % (Graph 1.5). A temporary decrease at the beginning of 2012 was soon reverted, due to the pressure from rising food prices in the second half of the year and phasing-out of administrative prices in 2013.
Following a sharp decrease in 2014, inflation is
forecast to remain moderate in 2015-16. After
reaching an historical low of 0.9 % in June 2014, HICP inflation slightly picked up in recent months. Annual average inflation declined from 3.2 % in 2013 to 1.4 % in 2014 mainly reflecting a VAT cut for bread, a good harvest and lower global energy
prices. It is forecast to remain at moderate levels and to reach an annual average of 1.2 % in 2015, mainly due to the significant decline in energy prices, subdued inflation in the EU and lower inflation expectations. Inflation is forecast to accelerate to 2.5 % in 2016 as the recovery in domestic demand continues.
Graph 1.5: Inflation 0 2 4 6 8 10 12
Jan 07 Jan 08 Jan 09 Jan 10 Jan 11 Jan 12 Jan 13 Jan 14 %
BNR inflation targets HICP
Core inflation CPI
Source: NSI, European Commission
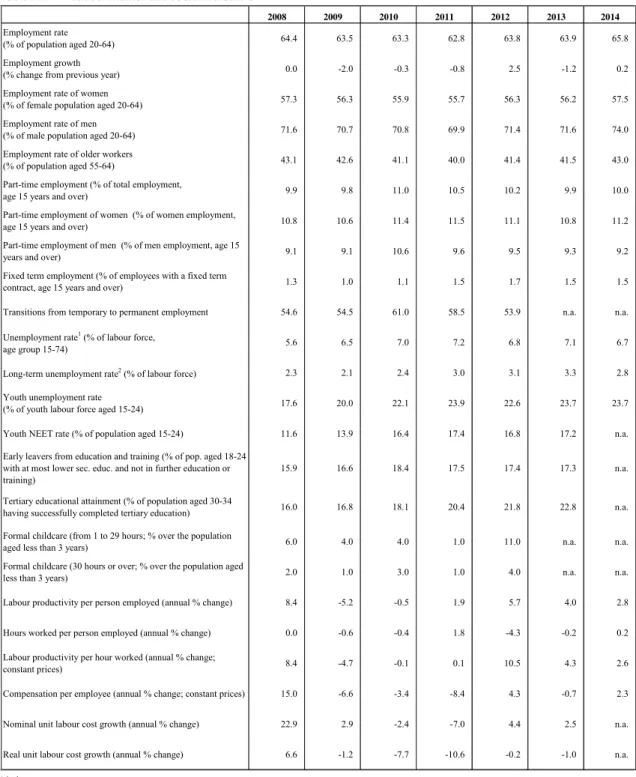
Labour market developments
The labour market shows signs of improvement
in 2013 and 2014. Employment and activity rates
in Romania continue to be among the lowest in the EU. The employment rate for the 20-64 age group stagnated in 2013, but then increased to 67.4 % in the third quarter of 2014. The recovery is forecast to continue in 2015 and 2016, supported by stronger GDP growth as compared to 2014. It will however still remain below the current EU average of 69.8 %.
Unemployment levels have been relatively
stable also during the crisis. Romania’s
unemployment rate has been hovering around 7 % for a long period, including during the crisis. This is below the average of its peer group and of the EU (Graph 1.6), but Romania also records a lower activity rate. The unemployment rate increased in 2013 to 7.3 % but decreased again to 6.7 % in 2014 and is expected to further decrease somewhat in 2015 and 2016.
Graph 1.6: Unemployment rates
0 5 10 15 20 01/08 01/09 01/10 01/11 01/12 01/13 01/14 % RO BG CZ LV HU PL
Source: European Commission
Public finances
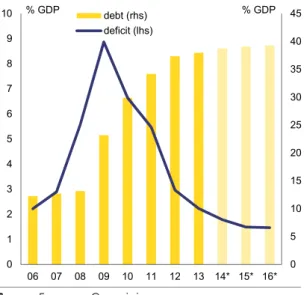
Fiscal imbalances have gradually unwound as the budget deficit followed a decreasing path. Before and at the height of the crisis, Romania exhibited twin fiscal and current-account deficits, both exceeding 8 % of GDP. With the support of three consecutive EU/IMF programmes, Romania managed to reduce the budget deficit to 1.8 % of GDP in 2014 (according to the Commission 2015 winter forecast). The adjustment was frontloaded but spread over various years, with a reduction from 8.9 % in 2009 to 5.5 % in 2011 and to 3.0 % in 2012, when the Excessive Deficit Procedure was abrogated. Following a good outcome in 2013, the adjustment has slowed down in 2014. The 2015 deficit is forecast to be at 1.5 % of GDP. This is estimated to be in line with a structural deficit of 1.25 % of GDP, which corresponds to the target agreed under the balance of payments programme for Romania: reaching the medium-term objective of a deficit of 1.0 % of GDP in structural terms plus a so-called EU funds adjustor of 0.25 % of GDP. The latter is an additional budget allocation to be used only for a significant acceleration of EU funds absorption. Furthermore, Romania is adopting measures to strengthen fiscal governance. Public debt increased from 13.2 % of GDP in 2008 to 37.3 % of GDP in 2012, driven by high budget deficits and a contraction in output. Public debt is forecast to plateau out in 2015-16 at around 39 %
of GDP as a result of the reduced deficit and the economic recovery.
Graph 1.7: Government deficit and debt (2006-16)
0 5 10 15 20 25 30 35 40 45 0 1 2 3 4 5 6 7 8 9 10 06 07 08 09 10 11 12 13 14* 15* 16* % GDP % GDP debt (rhs) deficit (lhs)
Source: European Commission
The tax mix has improved over the years, but tax policy is changing frequently and revenue
collection remains weak. Over the past years,
indirect taxation, such as VAT and excise duties, has gained weight in the tax mix. The tax wedge was reduced in 2014 by a cut in social security contributions of 5 pps. across the board, after an increase by 3 pps. in 2009. However, frequent changes in tax policy continue to disrupt the business environment. Tax collection remains weak, and the VAT gap is the biggest in the EU27, at 44 % of GDP in 2012.
The expenditure side still includes significant inefficiencies which weigh on Romania’s growth
potential. Domestically financed investment
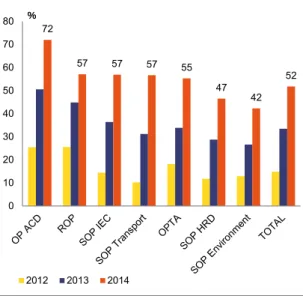
projects sometimes lack thorough preparation, economic justification and steady financing. EU funds’ absorption is lagging behind, at only 52.2 % of the available structural and cohesion funds as of end-2014. Increasing public investment capacity remains a challenge. This is notably due to insufficient shift away from domestically financed projects towards projects co-financed with EU funds. Public investment efficiency also suffers from weaknesses in public investment management. The public wage bill remains contained, but the unified wage grid across the
public sector is still not implemented (see section 4.1).
Court rulings and loss-making state-owned enterprises pose risks regarding future budget
deficits. Unforeseen court rulings with significant
budgetary impact were common in past years. Anticipating possible legal risks ahead remains a challenge. Some state-owned enterprises and other companies reclassified in the general government contributed to the budget deficit, which reflects inefficiencies and weak corporate governance (see section 3.2).
Continued fiscal adjustment and sustainable public debt contribute to comfortable financing
conditions. Romania lost access to international
financial markets in 2009, requiring EU/IMF financial assistance, but regained market access quickly. Since 2011, Romania is fully financing its deficit and debt on the financial markets. In 2013, JP Morgan included Romania’s treasury bonds in its emerging market index. All three major rating agencies rank Romania at investment grade (Table 1.1) and credit default swap (CDS) spreads are at their lowest levels since mid-2007 (Graph 1.8). Still, market conditions have proven sensitive to deteriorating market sentiment. Both announcements of tapering by the Federal Reserve and the early 2014 financial turmoil in Turkey have immediately impacted financing conditions and put pressure on the exchange rate.
Table 1.1: Evolution of long-term ratings
Rating Date Outlook Date
MOODY'S Baa3 06-10-06 ST 25-04-14
S&P BBB- 16-05-14 ST 16-05-14
BB+ 27-10-08
FITCH BBB- 04-07-11 ST 04-07-11
BB+ 10-11-08
Graph 1.8: CDS spreads over BUND -200 0 200 400 600 800 1000
Jan 06 Jan 07 Jan 08 Jan 09 Jan 10 Jan 11 Jan 12 Jan 13 Jan 14 Jan 15
RO BG
HU CZ
RO prog 09-11 start RO prec prog 11-13 start
RO prec prog 13-15 start
Source: European Commission
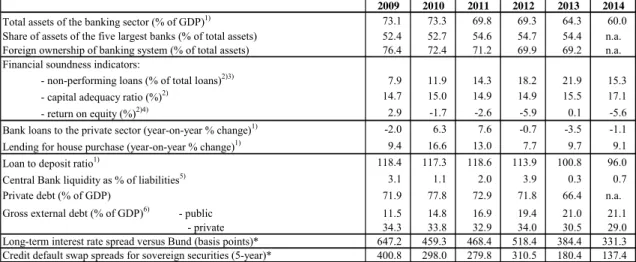
Financial sector
Romania’s financial sector is bank-based and
80 % of the banks are foreign owned. Overall,
credit institutions hold the largest share of the financial system’s assets (roughly 80 %) (Graph 1.9). Banks with Austrian capital have dominated the market since 2000, followed by French and Greek banks.
Graph 1.9: Banking assets evolution (2000-13) and composition by ownership -10% 0% 10% 20% 30% 40% 50% 60% 70% 80% 90% -10 0 10 20 30 40 50 60 70 80 90 99 00 01 02 03 04 05 06 07 08 09 10 11 12 13 EUR bn
EUR/RON (eop) : Foreign EUR/RON (eop) : Domestic - Private EUR/RON (eop) : Domestic - State owned
Source: National Bank of Romania (NBR), annual reports
The Romanian banking sector has weathered well the economic and financial crisis and
capitalisation remains strong. No public
intervention measures to support the banking sector were needed. Non-performing loans declined from 22.6 % in March 2014 to about 14 % in December 2014 (see Graph 3.5 in section 3.3). Moreover, the risks associated with
high non-performing loans have been mitigated by the prudent loan-loss provisioning policy of the banking supervisor.
Provisioning for impaired assets is weighing on
banks’ profitability. Against the backdrop of
increasing loan-loss provisions and high funding costs (in particular for banks with Greek and Cypriot capital), banking sector profitability came under pressure over the last years (Graph 1.10). After three years of losses, in 2013 the banking sector recorded a modest aggregate profit. In 2014 banks' profitability suffered again due to measures implemented for the clean-up of banks' balance sheets under the non-performing loans' resolution plan of the National Bank of Romania. According to preliminary data, the sector recorded a loss of RON 4.3 billion at the end of December 2014. Graph 1.10: Profit ROA and ROE
2.5 1.9 4.4 0.1 0.8 -0.2 -0.5 0.1 -0.8 -0.2 -2.3 1.2 0.0 0.2 -3 -2 -1 0 1 2 3 4 5 -10 -5 0 5 10 15 20
Net Profit RON bn, rhs) ROA (%)
ROE (%)
Source: NBR
Credit growth remains subdued due to both
supply and demand factors. In line with regional
trends, in 2014 the Romanian banking system experienced a further contraction in the loan stock, a decline in parent bank funding, and an expansion of the local deposit base, the latter due to precautionary savings by both households and companies. On the back of these developments, the funding gap was also reduced. The loan-to-deposit ratio declined to just below 100 % at end-July 2014 for the first time after almost seven years and to 91.4 % at end-December 2014.
Foreign bank deleveraging has continued in
2014. During the first balance of payments
assistance programme (2009-11), foreign-owned banks maintained their exposure to Romania in the framework of the Vienna Initiative. Since spring 2011, however, there has been a gradual and orderly deleveraging with the exposure of these banks declining by about 25 % as of June 2014, compared to March 2009.
The main vulnerabilities and challenges faced by the banking sector have been mitigated so
far, but pockets of vulnerability remain. The
main challenges regard: (i) the still significant level of non-performing loans; (ii) ongoing but orderly deleveraging; (iii) substantial share of foreign-currency-denominated loans; (iv) legislative initiatives which may have an adverse impact on financial sector stability; and (v) geopolitical risks potentially impacting the parent banks of the Romanian affiliates (see section 3.3).
Box 1.1: Economic surveillance process
The Commission’s Annual Growth Survey, adopted in November 2014, started the 2015 European Semester, proposing that the EU pursue an integrated approach to economic policy built around three main pillars: boosting investment, accelerating structural reforms and pursuing responsible growth-friendly fiscal consolidation. The Annual Growth Survey also presented the process of streamlining the European Semester to increase the effectiveness of economic policy coordination at the EU level through greater accountability and by encouraging greater ownership by all actors.
In line with streamlining efforts this Country Report includes an in-depth review — as per Article 5 of Regulation no. 1176/2011 — to determine whether macroeconomic imbalances exist, as announced in the Commission’s Alert Mechanism Report published in November 2014.
This Country Report includes an assessment of progress towards the implementation of the 2014 country-specific recommendations adopted by the Council in July 2014. The country-specific recommendations for Romania concerned the EU/IMF financial assistance programme implementation, budget, taxation, pension and health system, labour market, social policies, public administration, energy, transport and EU funds’ absorption.
So far, the surveillance of imbalances and monitoring of economic policies in Romania has taken place under the balance of payments adjustment programme, which is supported by precautionary financial assistance. However, since the agreement of the arrangement in autumn 2013, no semi-annual review of the programme has been successfully completed and the programme is set to end by September 2015. In autumn 2014 it was deemed useful to integrate Romania in the Macroeconomic Imbalance Procedure surveillance. In addition to regular programme review missions, the Commission’s assessment in this Country Report is based on the December bilateral meetings with the Member State and the associated reporting on the implementation of the 2014 country-specific recommendations. Furthermore, the Commission carried out in January 2015 a fact-finding mission for the purpose of the in-depth review, which ran in parallel with the balance of payments review mission.
Country Reports provide the basis for the recommendations that the Council will address to Member States in June. The earlier publication of the Commission’s assessment this year will allow time for more detailed discussions and strengthen the multilateral nature of the European Semester. This will help to advance Europe’s reform agenda.
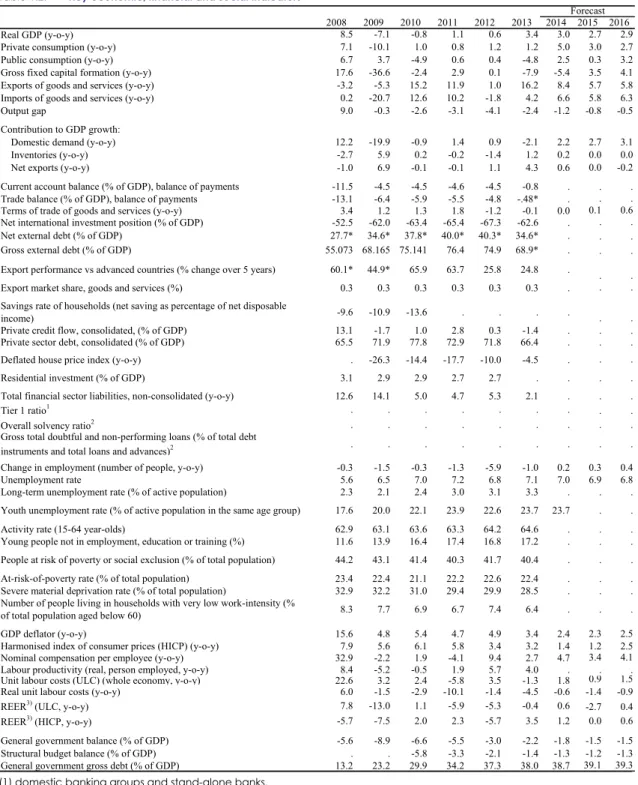
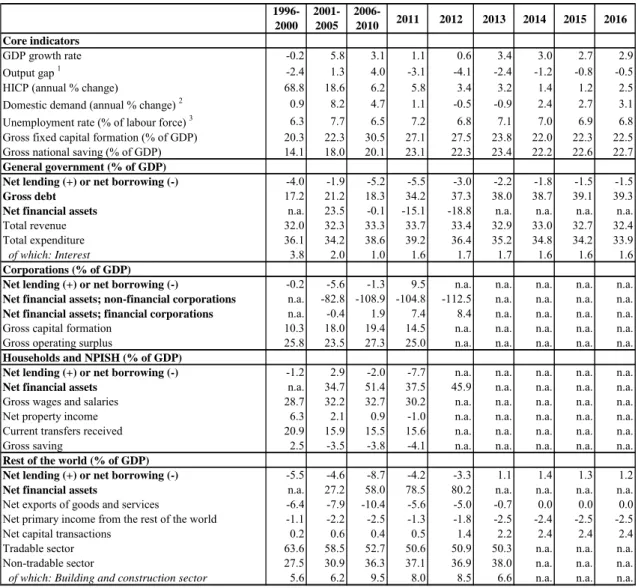
Table 1.2: Key economic, financial and social indicators
2008 2009 2010 2011 2012 2013 2014 2015 2016
Real GDP (y-o-y) 8.5 -7.1 -0.8 1.1 0.6 3.4 3.0 2.7 2.9
Private consumption (y-o-y) 7.1 -10.1 1.0 0.8 1.2 1.2 5.0 3.0 2.7
Public consumption (y-o-y) 6.7 3.7 -4.9 0.6 0.4 -4.8 2.5 0.3 3.2
Gross fixed capital formation (y-o-y) 17.6 -36.6 -2.4 2.9 0.1 -7.9 -5.4 3.5 4.1
Exports of goods and services (y-o-y) -3.2 -5.3 15.2 11.9 1.0 16.2 8.4 5.7 5.8
Imports of goods and services (y-o-y) 0.2 -20.7 12.6 10.2 -1.8 4.2 6.6 5.8 6.3
Output gap 9.0 -0.3 -2.6 -3.1 -4.1 -2.4 -1.2 -0.8 -0.5
Contribution to GDP growth:
Domestic demand (y-o-y) 12.2 -19.9 -0.9 1.4 0.9 -2.1 2.2 2.7 3.1
Inventories (y-o-y) -2.7 5.9 0.2 -0.2 -1.4 1.2 0.2 0.0 0.0
Net exports (y-o-y) -1.0 6.9 -0.1 -0.1 1.1 4.3 0.6 0.0 -0.2
Current account balance (% of GDP), balance of payments -11.5 -4.5 -4.5 -4.6 -4.5 -0.8 . . .
Trade balance (% of GDP), balance of payments -13.1 -6.4 -5.9 -5.5 -4.8 -.48* . . .
Terms of trade of goods and services (y-o-y) 3.4 1.2 1.3 1.8 -1.2 -0.1 0.0 0.1 0.6
Net international investment position (% of GDP) -52.5 -62.0 -63.4 -65.4 -67.3 -62.6 . . .
Net external debt (% of GDP) 27.7* 34.6* 37.8* 40.0* 40.3* 34.6* . . .
Gross external debt (% of GDP) 55.073 68.165 75.141 76.4 74.9 68.9* . . .
Export performance vs advanced countries (% change over 5 years) 60.1* 44.9* 65.9 63.7 25.8 24.8 . . .
Export market share, goods and services (%) 0.3 0.3 0.3 0.3 0.3 0.3 . . .
Savings rate of households (net saving as percentage of net disposable
income) -9.6 -10.9 -13.6 . . . .
Private credit flow, consolidated, (% of GDP) 13.1 -1.7 1.0 2.8 0.3 -1.4 . . .
Private sector debt, consolidated (% of GDP) 65.5 71.9 77.8 72.9 71.8 66.4 . . .
Deflated house price index (y-o-y) . -26.3 -14.4 -17.7 -10.0 -4.5 . . .
Residential investment (% of GDP) 3.1 2.9 2.9 2.7 2.7 . . . .
Total financial sector liabilities, non-consolidated (y-o-y) 12.6 14.1 5.0 4.7 5.3 2.1 . . .
Tier 1 ratio1 . . . . . . . . .
Overall solvency ratio2 . . . . . . . . .
Gross total doubtful and non-performing loans (% of total debt
instruments and total loans and advances)2 . . . .
Change in employment (number of people, y-o-y) -0.3 -1.5 -0.3 -1.3 -5.9 -1.0 0.2 0.3 0.4
Unemployment rate 5.6 6.5 7.0 7.2 6.8 7.1 7.0 6.9 6.8
Long-term unemployment rate (% of active population) 2.3 2.1 2.4 3.0 3.1 3.3 . . .
Youth unemployment rate (% of active population in the same age group) 17.6 20.0 22.1 23.9 22.6 23.7 23.7 . .
Activity rate (15-64 year-olds) 62.9 63.1 63.6 63.3 64.2 64.6 . . .
Young people not in employment, education or training (%) 11.6 13.9 16.4 17.4 16.8 17.2 . . . People at risk of poverty or social exclusion (% of total population) 44.2 43.1 41.4 40.3 41.7 40.4 . . .
At-risk-of-poverty rate (% of total population) 23.4 22.4 21.1 22.2 22.6 22.4 . . .
Severe material deprivation rate (% of total population) 32.9 32.2 31.0 29.4 29.9 28.5 . . . Number of people living in households with very low work-intensity (%
of total population aged below 60) 8.3 7.7 6.9 6.7 7.4 6.4 . . .
GDP deflator (y-o-y) 15.6 4.8 5.4 4.7 4.9 3.4 2.4 2.3 2.5
Harmonised index of consumer prices (HICP) (y-o-y) 7.9 5.6 6.1 5.8 3.4 3.2 1.4 1.2 2.5
Nominal compensation per employee (y-o-y) 32.9 -2.2 1.9 -4.1 9.4 2.7 4.7 3.4 4.1
Labour productivity (real, person employed, y-o-y) 8.4 -5.2 -0.5 1.9 5.7 4.0 . . .
Unit labour costs (ULC) (whole economy, y-o-y) 22.6 3.2 2.4 -5.8 3.5 -1.3 1.8 0.9 1.5
Real unit labour costs (y-o-y) 6.0 -1.5 -2.9 -10.1 -1.4 -4.5 -0.6 -1.4 -0.9
REER3) (ULC, y-o-y) 7.8 -13.0 1.1 -5.9 -5.3 -0.4 0.6 -2.7 0.4
REER3) (HICP, y-o-y) -5.7 -7.5 2.0 2.3 -5.7 3.5 1.2 0.0 0.6
General government balance (% of GDP) -5.6 -8.9 -6.6 -5.5 -3.0 -2.2 -1.8 -1.5 -1.5
Structural budget balance (% of GDP) . . -5.8 -3.3 -2.1 -1.4 -1.3 -1.2 -1.3
General government gross debt (% of GDP) 13.2 23.2 29.9 34.2 37.3 38.0 38.7 39.1 39.3 Forecast
(1) domestic banking groups and stand-alone banks.
(2) domestic banking groups and stand-alone banks, foreign-controlled (EU and non-EU) subsidiaries and branches. (3) Real effective exchange rate
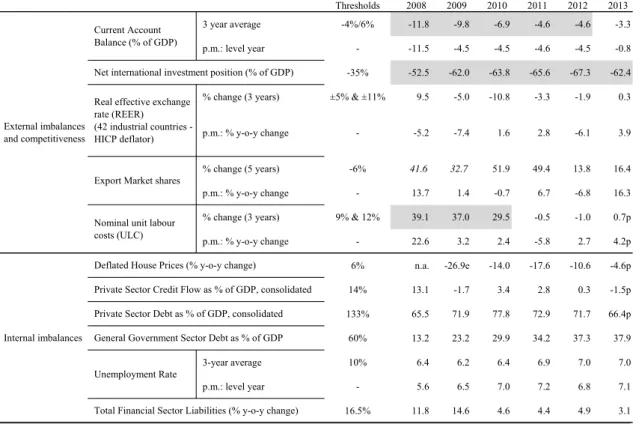
Table 1.3: MIP scoreboard indicators
Thresholds 2008 2009 2010 2011 2012 2013
3 year average -4%/6% -11.8 -9.8 -6.9 -4.6 -4.6 -3.3
p.m.: level year - -11.5 -4.5 -4.5 -4.6 -4.5 -0.8
-35% -52.5 -62.0 -63.8 -65.6 -67.3 -62.4 % change (3 years) ±5% & ±11% 9.5 -5.0 -10.8 -3.3 -1.9 0.3
p.m.: % y-o-y change - -5.2 -7.4 1.6 2.8 -6.1 3.9
% change (5 years) -6% 41.6 32.7 51.9 49.4 13.8 16.4
p.m.: % y-o-y change - 13.7 1.4 -0.7 6.7 -6.8 16.3
% change (3 years) 9% & 12% 39.1 37.0 29.5 -0.5 -1.0 0.7p
p.m.: % y-o-y change - 22.6 3.2 2.4 -5.8 2.7 4.2p 6% n.a. -26.9e -14.0 -17.6 -10.6 -4.6p 14% 13.1 -1.7 3.4 2.8 0.3 -1.5p 133% 65.5 71.9 77.8 72.9 71.7 66.4p 60% 13.2 23.2 29.9 34.2 37.3 37.9 3-year average 10% 6.4 6.2 6.4 6.9 7.0 7.0 p.m.: level year - 5.6 6.5 7.0 7.2 6.8 7.1 16.5% 11.8 14.6 4.6 4.4 4.9 3.1 Internal imbalances
Deflated House Prices (% y-o-y change)
Private Sector Credit Flow as % of GDP, consolidated Private Sector Debt as % of GDP, consolidated General Government Sector Debt as % of GDP Unemployment Rate
Total Financial Sector Liabilities (% y-o-y change) External imbalances
and competitiveness
Current Account Balance (% of GDP)
Net international investment position (% of GDP) Real effective exchange
rate (REER) (42 industrial countries - HICP deflator)
Export Market shares
Nominal unit labour costs (ULC)
Flags: e: estimated. p: provisional.
(1) Figures highlighted are those falling outside the threshold established in the European Commission’s Alert Mechanism Report. For REER and ULC, the first threshold applies to euro area Member States;
(2) Figures in italics are calculated according to the old standards (ESA95/BPM5);
(3) Export market share data: total world exports are based on the fifth edition of the Balance of Payments Manual (BPM5).
2.1. EXTERNAL REBALANCING AND COMPETITIVENESS
Net international investment positionThe net international investment position of Romania has substantially improved since 2012. Romania had a net international investment position of -58.3 % of GDP at end-July 2014, which is the lowest value since the first quarter of 2010 (Graph 2.1.2) and a significant improvement as compared to -67.5 % of GDP in 2012, when the NIIP hit a historical low. This correction comes as a result of strong nominal GDP growth and a low current-account deficit (Graph 2.1.2), in spite of a deteriorating investment income balance and negative valuation effects.
A negative net international investment position
is not unusual for a catching-up economy. Peer
countries face similar or, for the most part, even more negative net international investment positions (Graph 2.1.1). Those most exposed in the peer group (Hungary, Bulgaria and Latvia) started reducing their international exposure earlier than Romania, possibly as a reaction to nervous international financial markets. Still, an elevated negative net international investment position makes a country more exposed to sudden stops or reversals of capital flows. It also feeds back into the current account through higher net-income deficits, as in the Romanian case (Graph 2.1.1). Moderate current-account deficits can thus help to keep the net international investment position in control in the long run.
Graph 2.1.1: NIIP in Romania and peer countries
-140 -120 -100 -80 -60 -40 -20 06Q2 07Q2 08Q2 09Q2 10Q2 11Q2 12Q2 13Q2 14Q2 %GDP Romania Bulgaria
Czech Republic Hungary
Latvia Poland
Source: European Commission
Graph 2.1.2: Decomposition of rate of change of NIIP
-20 -15 -10 -5 0 5 10 15 05Q2 06Q2 07Q2 08Q2 09Q2 10Q2 11Q2 12Q2 13Q2 14Q2 C ha nge in pp. of GD P (y -o -y ) Valuation changes
Net transaction effect (rest FA bal.) Investment income effect Nominal growth effect Change in NIIP (y-o-y)
Source: European Commission
In the expansionary years prior to the crisis the deterioration of the net international investment position was financed in part from
rather volatile sources. A considerable part of the
financing of the net international investment position stemmed from volatile or easy-to-retrieve sources, such as portfolio investments and loans, exposing Romania to financial market risk (see Graph 2.1.3 and section 3.3). The sudden deterioration of market sentiment during the global
economic crisis put significant strain on public borrowing and the exchange rate, leading to a significant external funding gap that in early 2009 was eventually closed by a joint EU/IMF financial assistance programme of about EUR 20 bn. Together with the decision by the international banks to maintain their exposure to Romania, under the Vienna Initiative, this financial support and the economic adjustment triggered by the balance of payments assistance programme helped towards a gradual unfolding of Romania’s imbalances.
Graph 2.1.3: NIIP financing
-100 -80 -60 -40 -20 0 20 40 99 00 01 02 03 04 05 06 07 08 09 10 11 12 1314Q2 % GDP
NPI, equity securities NPI, debt securities Changes in reserves (net) Other investment (net) Net direct investment Net financial derivatives Net external debt (neg. sign) Net int'l investment position (NIIP) Marketable debt
Source: European Commission
The composition of the net international investment position confirms the persistence of
volatile financing sources. Net portfolio
investment and the net balance of other investments were -72 % of GDP at end-2013, substantially higher than the -43 % of GDP for net foreign direct investment liabilities. This composition is relatively unfavourable compared to regional peers.
Foreign direct investment is, however, recovering its role as a stable source of funding. From a record low of 17 % of GDP in 2002, the net stock of inward foreign direct investment increased steadily in Romania until 2009, to just above 40 %. In flow terms, foreign direct investment has declined sharply from the onset of the financial crisis. Foreign direct investment inflows fluctuated between 1.3 % and 1.9 % of
GDP in 2010-13. This is well below the average of 7.4 % of GDP over 2004-08. Consequently, inward foreign direct investment stocks have increased only slightly since 2009, to 43 % of GDP at end-2013. Given the evolution of the net international investment position, this means that, before the crisis net foreign direct investment financed a decreasing proportion of the net external position: falling from 94 % of the net international investment position in 2005 to 66 % in 2009. Since 2011, however, this share has been rising again, reaching 69 % in 2013. The trend reversal is only partially due to the lower negative net international investment position.
Current-account developments
Romania’s current-account deficit decreased in
recent years. It has rebalanced from a deficit of
over 10 % of GDP in 2006-2008 to around 1 % of GDP in 2013. The adjustment took place in two steps (Graph 2.1.4). In 2009, the current account deficit adjusted to 4.2 % of GDP, mainly driven by lower imports. Following a period of stability, the deficit dropped again in 2012-13 to 1.1 % of GDP. This second adjustment was broader in scope. It resulted from strong exports, stagnant imports and a decrease in (negative) primary incomes. The strong export growth, and increasing services trade surplus is indicative of the structural change in the Romanian economy (see below). The current account surplus is estimated at 1 % of GDP in 2014 and to stabilise in 2015 and 2016.
Graph 2.1.4: Current account balance by components (4qma) -20 -15 -10 -5 0 5 10 06Q2 08Q2 10Q2 12Q2 14Q2 % GDP Income Current transfers Services Goods
Current acc. balance
Source: European Commission
Lower government financing needs and corporate deleveraging helped the
current-account adjustment that started in 2009. With
the unfolding of the crisis, non-financial and financial corporations in Romania increasingly adjusted their balance sheets, turning previously growing borrowing needs into surpluses (Graph 2.1.5). In the financial sector much of the adjustment is attributed to the reduction of exposure of the foreign parent banks to the Romanian banking sector. Additional factors supporting the readjustment process were the successive EU/IMF assistance programmes, which reduced the government's financing needs and ensured underlying structural reforms.
Households did not exhibit the same adjustment
capacity. Strongly exposed to foreign-currency
denominated mortgage-backed loans (see section 2.3), households saw their external negative balances growing both as a percentage of GDP and as a percentage of their disposable income. These developments are further discussed in section 2.3.2.
Graph 2.1.5: Net lending by sector
-15 -10 -5 0 5 10 15 20 25 06 08 10 12 14 16 %GDP Households Corporations Government Total economy
Source: European Commission
A comparison with regional peers shows that the current-account adjustment of Romania fits in a wider pattern while being more gradual. Like that of most countries in Central and Eastern Europe, Romania’s current account adjusted sharply in 2009, which was made necessary by the correction of international financing flows. The joint EU/IMF assistance programmes allowed Romania in the following years to undergo a more gradual adjustment (Graph 2.1.6) and thus to limit temporary or even permanent losses of growth.
Graph 2.1.6: Current-account balance in peer countries -15 -13 -11 -9 -7 -5 -3 -1 1 3 5 2008 2009 2010 2011 2012 2013 2014 BG CZ HR HU PL RO SK % GDP Note: BG in 2008, 22.7 % of GDP
Source: European Commission
Exports have been the main driver of the recent
improvement in the current account balance.
Exports grew sharply in recent years, to reach a record high of 41 % of GDP in 2013 (Graph 2.1.7), against 27 % of GDP in 2008 and 2009. Imports, in turn, have been largely stable, at around 42 % of GDP. Both goods and services have contributed to this result, but the evolution of the latter was more noticeable (Graph 2.1.4). In 2013 alone, services contributed 0.9 pp. of GDP to the reduction of the current account deficit. This positive development is partly due to improvements in data collection introduced in 2013, which had a positive impact on the services balance, suggesting that past current account deficits were moderately overestimated. Future growth in services’ exports may be negatively affected by the ensuing basis effect. The growth of exports translated into strong
gains in export market shares. Romania’s market
share grew on average by 4.6 % per year in the decade 2004-13. Romania was a top performer among EU Member States in 2013, recording almost 15 % growth in export market share (Graph 2.1.8). Market share growth was stronger for services (6.9 % per year in the period 2004-13) but also important for manufacturing (4.1 % per year) (Graph 2.1.9).
Graph 2.1.7: Romanian exports and imports
0 5 10 15 20 25 30 35 40 45 50 95 97 99 01 03 05 07 09 11 13 % GDP Exports Imports
Source: European Commission
Graph 2.1.8: Growth in export market shares in the EU
-6 -4 -2 0 2 4 6 8 10 12 14 CY FI UK HR IT FR EL IE SE DK BE AT ES PT NL DE MT HU SI LU CZ EE PL BG SK RO LV LT % avg 2004-13 2013
Source: European Commission
The improvement in Romania’s current
account is structural in nature. The
current-account balance used to exhibit a strongly negative correlation with the output gap during between 2002 and 2009, revealing that the built up of the strongly negative current account was driven by booming internal demand. However, in recent years this correlation did not hold anymore, indicating that the improvement is not only driven by cyclical factors (Graph 2.1.10). In addition,
cyclical and non-cyclical current-account balances as percentage of GDP converge towards a balanced level since 2012 (Graph 2.1.11).
Graph 2.1.9: Export market share decomposition
-10 -5 0 5 10 15 20 97 98 99 00 01 02 03 04 05 06 07 08 09 10 11 12 13 Rat e o f ch a nge y-o-y (% )
Contribution to EMS: goods Contribution to EMS: services Export market share growth yoy
Source: European Commission
Graph 2.1.10: Current account balance and output gap
-20 -15 -10 -5 0 5 10 2002 2004 2006 2008 2010 2012 2014 % GDP Output gap CA balance
Source: European Commission
The improvement in Romania’s current account has been accompanied by a
readjustment in the exports’ structure. Exports
of food and agriculture products have experienced the highest growth rates since the crisis (Graph 2.1.12). Together with vehicles and
machinery and electrical equipment, they represented 58 % of Romania’s total exports of goods in 2013. At the same time, sectors such as textiles and footwear suffered a sharp drop in their exports, a trend that started well before the crisis. Metal products have also been losing weight. As for the exports of services, the strong performance is largely due to transportation and business services. For the latter, this may also reflect the good performance of goods exports.
Graph 2.1.11: Cyclical and non-cyclical CAB
-16 -14 -12 -10 -8 -6 -4 -2 0 00 02 04 06 08 10 12 14 16 % o f GD P Current account as % of GDP Cyclically adjusted CA as % of GDP
Source: European Commission
The current account deficit is expected to widen
in 2015-16 to around 1 % of GDP. Strong
domestic demand is expected to boost imports faster than exports. This was already apparent in the first nine months of 2014, with exports above expectations (9.1 % growth year-on-year) but still being outpaced by imports’ growth (9.6 % year-on-year).
The EU is the destination for 70 % of
Romania’s exports. The proportion of exports
going to the EU has decreased somewhat since Romania joined in 2007. This evolution is due to the sharp decline of exports to Italy, from 17 % in 2007 to 12 % in 2013 (Graph 2.1.13). Other EU countries only partially compensated for this. Outside the EU, the most relevant markets are neighbouring countries: Turkey, the Russian Federation, Ukraine and Moldova, but in this group only Turkey has a share above 5 %.
Graph 2.1.12: Evolution of exports by groups of products 0 5 10 15 20 25 30 35 05 06 07 08 09 10 11 12 13 % of total exports
Machin.& Electr. Vehicles
Food & agric. Textiles & footw.
Chemical prod. Metals
Mineral prod. Other prod.
Source: European Commission
Graph 2.1.13: Evolution of exports for selected destinations
0 5 10 15 20 2007 2008 2009 2010 2011 2012 2013
Germany Italy France
Turkey Hungary UK
Bulgaria Netherlands Russia
Source: European Commission
Romania’s exports to its main markets followed
a divergent pattern. In 2007, Germany and Italy
had the same share of Romania’s exports of goods (17 % of the total). In the following years, exports of clothing and footwear to both countries dropped significantly. In the case of Germany, this was more than offset by higher exports of machinery and electrical equipment, and of chemical products, bringing its total to 19 %. There was no such substitution of exports to Italy, so the
proportion of Romania’s goods exports to Italy dropped to 11.5 % (Graph 2.1.14). These developments also reflect broader trends in Europe, including a rapid increase in intra-industry trade and Germany’s strong position in this regard. Graph 2.1.14: Exports to Germany and Italy, by groups of
products 0 10 20 30 40 50 60 07 08 09 10 11 12 13 07 08 09 10 11 12 13 Germany Italy
Machin.& Electr. Vehicles
Food & agric. Textiles & footw.
Chemical prod. Metals
Other prod.
Source: European Commission
Current transfers have remained broadly stable over the past years, while the balance of net
incomes has deteriorated in 2013. Private
transfers, mostly remittances from the Romanian diaspora, accounted for 73 % of net current transfers in 2013. They have remained relatively stable over 2010-13, even if apparently aligned to the business cycle in the euro area. The remaining current transfers, linked to EU structural funds’ absorption, have somewhat increased at the end of 2013 and at the beginning of 2014, but slowed down again since then.
The balance of primary incomes somewhat
decreased. It fell from -1.2 % of GDP in 2010 to
-2.7 % of GDP in 2014, as dividends and interest from foreign direct investment have increased sharply due to an improved macroeconomic environment and higher corporate profits. Further increases in dividends and interest from foreign direct investment are forecast, as the economy is expected to continue growing above potential. Such a primary income balance is typical for a catching-up economy with high shares of foreign capital (Graph 2.1.15).
Graph 2.1.15: Balance of primary incomes -10 -9 -8 -7 -6 -5 -4 -3 -2 -1 0 2007 2008 2009 2010 2011 2012 2013 RO CZ HR HU PL BG SK % GDP
Source: European Commission
Cost competitiveness
Romania’s cost competitiveness improved between 2009 and 2012, but deteriorated
somewhat in 2013. Following years of strong
growth, unit labour costs-based real effective exchange rate decreased sharply in Romania in 2009 (Graph 2.1.16). It results from the nominal devaluation and lower compensation per employee. At least some of the recent trade dynamism can be linked to this favourable cost development. In this context, the real effective exchange rate appreciation in 2013 could prove a turning point, especially since shifts in competitiveness usually affect trade performance with a lag. Whether that will be the case depends on the evolution of unit labour costs and on the dynamism of Romania’s tradable sector in terms of non-price competitiveness.
Unit labour costs' growth is slowing down but is
still higher than in peer countries. Since the
financial crisis, unit labour costs have recorded historically low growth rates in Romania (Graph 2.1.18). Subdued compensation per employee (in 2009-12) and productivity gains (in 2013) explain this reduction. They did, nevertheless, continue to grow above those of Romania’s main competitors (Graph 2.1.18).
Graph 2.1.16: REER decomposition
-20 -10 0 10 20 30 40 05 06 07 08 09 10 11 12 13 R at e of c hange y-o-y (% )
NEER IC-42 relative HICP (-)
REER (HICP) IC-42 REER (ULC) IC-37
Source: European Commission
Unit labour costs in the tradable sector are
faring better than in non-tradables. The
aggregated unit labour costs are pushed upwards by the non-tradable sector (Graph 2.1.17), where productivity gains were insufficient to compensate for increases in labour costs. In the tradable sector, productivity gains and contained labour compensation converged to restrain unit labour costs. Consequently, sectors exposed to international competition were able to retain competitiveness, with a positive impact on the trade balance. However, the increase in unit labour costs in the non-tradable sector poses a risk of higher costs in protected sectors feeding into the costs of tradables, eroding Romania’s international competitiveness.
Competitiveness improvements over 2008-12
came to a halt in 2013. When corrected for export
prices, Romania’s unit labour costs-based real effective exchange rate shows a substantial improvement since 2007. This ratio can be seen as a proxy for profitability of exporting firms. The adjustment was stronger in Romania than in the peer group and the EU as a whole, suggesting strong competitiveness gains. This indicator warns, however, that 2013 may have been an inversion point.
Wage growth has been moderate but uneven, with the wage distribution becoming increasingly compressed at the bottom due to
strong increases in minimum wages. The minimum wage in Romania is RON 975 (around EUR 217) as of 1 January 2015 and used to be low also in relative terms (36.3 % of average gross earnings in 2013). It has been increasing sharply since 2012 and is expected to reach close to 48 % of average gross earnings at the end of 2016. During 2009-2012, the minimum wage has increased cumulatively by 17 %, against an increase in the consumer price index by 16 %. Over the same period, the average wage increased by 19 %. Growth in the last two years followed a period of roughly no increase in real terms, and this increase has so far not reverberated at the higher levels of the wage distribution. However, this implies that wage scales in different sectors (including in the public sector) are being increasingly compressed and the proportion of employees earning the minimum wage is reaching high levels (27 % of total employees at the end of 2014, a substantial increase from the 8 % registered in 2011). With the planned increases for 2016, to RON 1200, the share will further increase. Graph 2.1.17: ULC in tradable and non-tradable sectors
100 120 140 160 180 200 220 240 05 06 07 08 09 10 11 12 13 2005=100 non tradable tradable
Source: European Commission
Minimum wage setting processes are not
following a clear and transparent mechanism.
According to the Romanian Labour Code, the gross minimum wage is established through a government decision, after consultation with social partners. Prior to the abolition of the national level of collective bargaining with the reform amendment of the Labour Code and of the new
Social Dialogue Law in 2011 a number of terms of employment and working conditions including a national minimum wage floor (different from the statutory minimum wage set by the government) and a grid with coefficients depending on qualifications were negotiated and set by a national collective contract which covered all employees in the country. No explicit guidelines exist with respect to the criteria to be followed. Changing the minimum wage without properly taking into account underlying economic and labour market conditions does not ensure a balance between facilitating employment and competitiveness, on the one hand, and safeguarding labour income on the other. In particular, it can pose risks in terms of increased pressure on the overall wage distribution, pushing less productive workers into unemployment and informality and distorting education and skills’ wage premia. Discretionary increases can also contribute to making the business environment less predictable. The Romanian authorities are reviewing the wage setting mechanisms in place in other EU Member States, and are planning to table a discussion with the social partners on the criteria to be followed in setting the minimum wage in the course of 2015. Graph 2.1.18: Decomposition of ULC
-15 -10 -5 0 5 10 15 20 25 30 35 05 06 07 08 09 10 11 12 13 14 15 R at e of c ha nge y -o-y (% )
Inflation (GDP deflator growth) Real Compensation per Employee Productivity Contribution (negative sign) Nominal unit labour cost
ULC in 36 industrial competitors of Romania
Graph 2.1.19: REER vs. export prices 60 70 80 90 100 110 120 130 140 150 160 04 05 06 07 08 09 10 11 12 13 EU28 BG CZ LV HU PL RO
Source: European Commission
Labour productivity in Romania is the second
lowest in the EU. Romania faced a decrease of
around 4 % in labour productivity during 2008-10, and fell by an additional 0.5 % during 2011-12. In 2013 labour productivity grew by almost 5 %, providing the first clear indication of an improvement (Graph 2.1.21). The labour productivity losses of the last years can be seen as an indication of the low level of adjustment capacity in the economy.
Graph 2.1.20: Labour productivity per hour worked (EU27=100) 0 10 20 30 40 50 60 70 CZ HU PL LV RO BG EU27=100 2013 2008
Source: European Commission
The structural adjustment between 2008 and
2012 had unequal productivity benefits. The
decomposition of labour productivity growth rate (Graph 2.1.22) shows that the sectoral redistribution of resources in the economy favoured less productive sectors and pulled down aggregate productivity performance by 10 percentage points (7.6 percentage points from the shift effect and 2.3 percentage points from the interaction effect). The shift of resources in sectors with high productivity or high productivity growth (within effect in Graph 2.1.22) made a positive contribution of around 5 percentage points, which was not enough to balance the overall productivity losses of -5 %.
Graph 2.1.21: Labour productivity in Romania 2008-2013
94 96 98 100 102 104 106 2008 2009 2010 2011 2012 2013
Labour productivity (hours worked) Labour productivity (persons)
Source: European Commission
Manufacturing and real estate are the sectors with the highest within-sector productivity improvements and thus positive contribution to
the aggregate labour productivity. Productivity
improvements are also observed in trade, transport and accommodation, in construction and in professional, scientific and technical activities (Graph 2.1.23). Productivity in the agricultural sector is low, and it has followed a decreasing path in the recent years.
Graph 2.1.22: Decomposition of aggregate labour productivity growth -3.9 -5.3 -1.8 3.2 -0.9 -2.3 -0.5 1.9 -8 -6 -4 -2 0 2 4 6 Productivity growth Shift effect Interaction effect Within-sector effect pps 2008-2010 2011-2012
Note: Shift effect, indicates the effect of the reallocation of resources to sectors with different productivity levels. Interaction effect, indicates the effect of the reallocation of resources to sectors with different productivity growth rates. Within-sector effect, indicates the effect of productivity gains/losses in each sector of the economy.
Source: European Commission
Graph 2.1.23: Productivity gains/losses due to changes in sectoral productivities (within effect)
-1.3 0.8 4.8 -1.3 -2.2 0.0 0.2 3.2 -0.6 -2.8 -0.1 0.3 0.5 1.6 -0.2 0.1 1.9 0.7 -6 -4 -2 0 2 4 6 A gric u ltur e, fo re str y and fish in g In dus tr y: Mining and qu ar ry in g, El ectr ic ity , ga s, … Ma nuf ac tu rin g Con struc tion W holes ale an d re ta il tr ad e, tr an sp or t, ac co m m od at io n… In fo rm at io n and co mmu ni cation F inan ci al a nd ins ur anc e ac tiv iti es R ea l e sta te a cti vi tie s P ro fe ss ional, s ci e nt ific and te chnic al ac tiv iti es ;… 2011-2012 2008-2010
Source: European Commission
Non-cost competitiveness
The somewhat lower dynamism of Romania’s main geographic and product markets has been
counterbalanced by market share gains in these
markets (Graph 2.1.25). The geographic
specialisation was rather a hampering factor for Romania’s exports while the product specialisation was rather neutral. The exceptionally good results in 2013 can only partially be explained by the improved economic conditions in Romania’s main markets (see Graphs 2.1.24). Even in such a good year, the contribution of specialisation to market share gains was negligible. In turn, Romania was able to gain market shares in these markets. Graph 2.1.24: Dynamism and competitiveness of exports
(goods) in top-10 destinations, 2012-13
Germany Italy France Turkey Hungary UK Bulgaria Netherlands Russian Federation Spain -8 -6 -4 -2 0 2 4 6 -10 0 10 20 30 40 Ma rk et D yna m is m (p p) Competitiveness (pp)
Source: European Commission
Over the last decade, manufacturing moved up the respective value-chains, but progress may
have stalled. In 2013 manufacturing as a
proportion of total value added in Romania was the second highest in the EU (25 % of gross value added comparing to 15 % in the EU). Manufacturing also plays an important role as the main driver of exports.
The revealed comparative advantages indicator suggests an increase in intra-industry trade. Usually this is associated with more integrated production chains (Graph 2.1.26). However, the import content of exports has been dropping in almost every sector, which suggests rather less integration into international production chains (Graph 2.1.27).
Graph 2.1.25: Geographical and sectoral composition of nominal USD rate of change of goods exports
-4.0 -2.0 0.0 2.0 4.0 6.0 8.0 10.0 12.0 2008-2010 2010-2012 2012-2013 An nua l a rithm etic a ver ag e m ea n (% )
Initial geographical specialisation Initial product specialisation
Market share gains in geographical destinations Market share gains in product markets
Source: European Commission
Graph 2.1.26: Revealed comparative advantages (goods)
-1.5 -1.0 -0.5 0.0 0.5 1.0
Animal & Animal ProductsVegetable Products Fats And Oils Foodstuffs & TobaccoMineral Products Chemical Products Plastics & Rubber Raw Hides, Skins, Leather…Wood & Cork
Pulp of Wood & PaperTextiles Footwear & Headgear Stone, Cement, Ceramic &…Precious Stones & Metals
Metals Machinery & Electrical Vehicles, Aircraft, VesselsInstruments & Watches Arms & AmmunitionMiscellaneous Art & Antiques
Trade in goods: Symmetric Revealed Comparative Advantage Index
2012-2013 2000-2001
Source: European Commission
High-tech products’ share of total exports increased sharply as compared to a decade ago, but recent trends are less positive (Graph 2.1.29). After peaking in 2010, the high-tech products’ share of exports fell in 2013 to its 2008 level, lower than in all other EU Member States except Bulgaria.
Graph 2.1.27: Import content of exports
0 5 10 15 20 25 30 35 40 45 50 2005 2007 2011
Source: European Commission
Graph 2.1.28: High-tech products as a proportion of exports in peer countries 0 5 10 15 20 25 95 96 97 98 99 00 01 02 03 04 05 06 07 08 09 10 11 12 13 % of to ta l ex po rts RO PL BG CZ HU
Source: European Commission
Romania lags behind other EU Member States in terms of research and development and
innovation capacity. Businesses’ expenditure on
research and development was equivalent to 0.19 % of GDP in 2012, seven times below the EU average. It fell further in 2013, to 0.12 % of GDP (despite the existing tax incentives for eligible research and development costs). The underfinancing in the research and development