Infrastructure Asset Management
Real-time traffic event detection using Twitter: A case study
--Manuscript
Draft--Manuscript Number: IAsMa-D-17-00022Full Title: Real-time traffic event detection using Twitter: A case study Article Type: Themed Issue: Highway infrastructure
Corresponding Author: Angelica Milagros Salas Jones, MSc
University of Wolverhampton Faculty of Science and Engineering Wolverhampton, West Midlands UNITED KINGDOM
Corresponding Author Secondary Information:
Corresponding Author's Institution: University of Wolverhampton Faculty of Science and Engineering Corresponding Author's Secondary
Institution:
First Author: Angelica Milagros Salas Jones, MSc First Author Secondary Information:
Order of Authors: Angelica Milagros Salas Jones, MSc Panagiotis Georgakis, PhD
Ioannis Petalas, PhD Renukappa Suresh, PhD Order of Authors Secondary Information:
Abstract: Incident detection is an important component of Intelligent Transport Systems (ITS) and plays a key role in urban traffic management and provision of traveller information services. Due to its importance, a wide number of researchers have developed different algorithms for real-time incident detection. However, the main limitation with existing techniques is that they do notwork well in conditions where random factors could influence traffic flows. Twitter is a valuable source of information as its users post events as they happen or shortly after. Therefore, Twitter data has been used to predict a wide variety of real-time outcomes. This paper aims to present a methodology for a real-time traffic event detection using Twitter. Tweets are obtained through the Twitter Streaming Application Programming Interface (API) in real-time with a geolocation filter. Then, we used Natural Language Processing (NLP) techniques to process the tweets before they are fed into a text classification algorithm that identifies if its traffic related or not. We implemented our methodology in the West Midlands region in the UK, and obtained an overall accuracy of 92.86%.
Additional Information:
Question Response
Please enter the total number of words in your main text.
3341
Please enter the number of figures, tables and photographs in your submission.
Tables: 7 Figures: 2
This is an example created from parts of other articles, it is not designed to be read for sense.
Title: Real-time traffic event detection using Twitter: A case study
Author 1
● Angelica Salas Jones, PhD student
● Faculty of Science and Engineering, University of Wolverhampton, United Kingdom
Author 2
● Dr. Panagiotis Georgakis
● Faculty of Science and Engineering, University of Wolverhampton, United Kingdom
Author 3
● Dr. Ioannis Petalas
● Faculty of Science and Engineering, University of Wolverhampton, United Kingdom
Author 2
● Dr. Renukappa Suresh
● Faculty of Science and Engineering, University of Wolverhampton, United Kingdom
Full contact details of corresponding author.
Email address: [email protected]
Mobile number: 447481475793
Number of words in main text: 3341
Number of tables: 7
Number of figures: 2
Main Text Click here to download Main Text Real-time traffic event detection.docx 1 2 3 4 5 6 7 8 9 10 11 12 13 14 15 16 17 18 19 20 21 22 23 24 25 26 27 28 29 30 31 32 33 34 35 36 37 38 39 40 41 42 43 44 45 46 47 48 49 50 51 52 53 54 55 56 57 58 59 60 61 62 63 64 65
2
Abstract (150 words)Incident detection is an important component of Intelligent Transport Systems (ITS) and plays a key role in urban traffic management and provision of traveller information services. Due to its importance, a wide number of researchers have developed different algorithms for real-time incident detection. However, the main limitation with existing techniques is that they do notwork well in conditions where random factors could influence traffic flows. Twitter is a valuable source of information as its users post events as they happen or shortly after. Therefore, Twitter data has been used to predict a wide variety of real-time outcomes. This paper aims to present a methodology for a real-time traffic event detection using Twitter. Tweets are obtained through the Twitter Streaming Application Programming Interface (API) in real-time with a geolocation filter. Then, we used Natural Language Processing (NLP) techniques to process the tweets before they are fed into a text classification algorithm that identifies if its traffic related or not. We implemented our methodology in the West Midlands region in the UK, and obtained an overall accuracy of 92.86%.
Keywords
Transport management, Transport planning, Information Technology, Infrastructure planning. 1 2 3 4 5 6 7 8 9 10 11 12 13 14 15 16 17 18 19 20 21 22 23 24 25 26 27 28 29 30 31 32 33 34 35 36 37 38 39 40 41 42 43 44 45 46 47 48 49 50 51 52 53 54 55 56 57 58 59 60 61 62 63 64 65
Introduction
1
With 84% of people travelling by car at least once or twice a week (DfT, 2017), the need for
2
more efficient traffic monitoring systems has become essential. Increases in traffic leads to
3
more interaction between road users, and therefore, heightened likelihood of traffic incidents.
4
Traffic incidents are non-recurrent events such as accidents, broken down vehicles, road
5
maintenance, social activities and other unexpected events that affect the normal traffic flow.
6
These incidents contribute to delays and have serious effects on safety, air pollution and the
7
cost of travel. In order to reduce these adverse effects, incidents need to be detected and
8
cleared as promptly as possible. For these reasons, Automatic Incident Detection (AID) has
9
been widely studied in the last decades. AID is an important part of Intelligent Transportation
10
Systems (ITS), and is designed to automatically detect incidents, or unexpected situations
11
causing congestions in the transport network (D'Andrea, Marcelloni, 2017).
12
13
Traditional AID systems exploit data collected from loop detectors and surveillance cameras on
14
the transport network. These devices measure traffic data such as flow, speed, and occupancy
15
for a given period of time. AID algorithms can then detect traffic incidents from anomalies found
16
on these data. However, it is quite expensive to cover broad areas due to the high cost of
17
installing and maintaining these types of devices. In contrast, this approach has poor
18
performance on arterial roads, were traffic flows can be influenced by random factors. Recently,
19
there has been a trend towards considering other data sources technologies, such as GPS and
20
cellular geolocation systems (Parkany, Xie ,2005). Nevertheless, these approaches are limited
21
by low sampling rate and high measurement errors (Siripanpornchana, Panichpapiboon &
22
Chaovalit, 2016).
23
24
It would be ideal if users could report incidents in real-time, as they are the ones that can
25
provide more accurate information about the incident. In fact, virtually any person witnessing or
26
involved in any event is able to disseminate it in real-time through microblogs (Atefeh, Khreich
27
,2015). Microblogging sites, particularly Twitter, have become a popular source of all kinds of
28
information. Twitter is an online social network with over 300 million users posting short
29
messages (tweets) on a real-time basis. Many of these tweets are about real-time events as
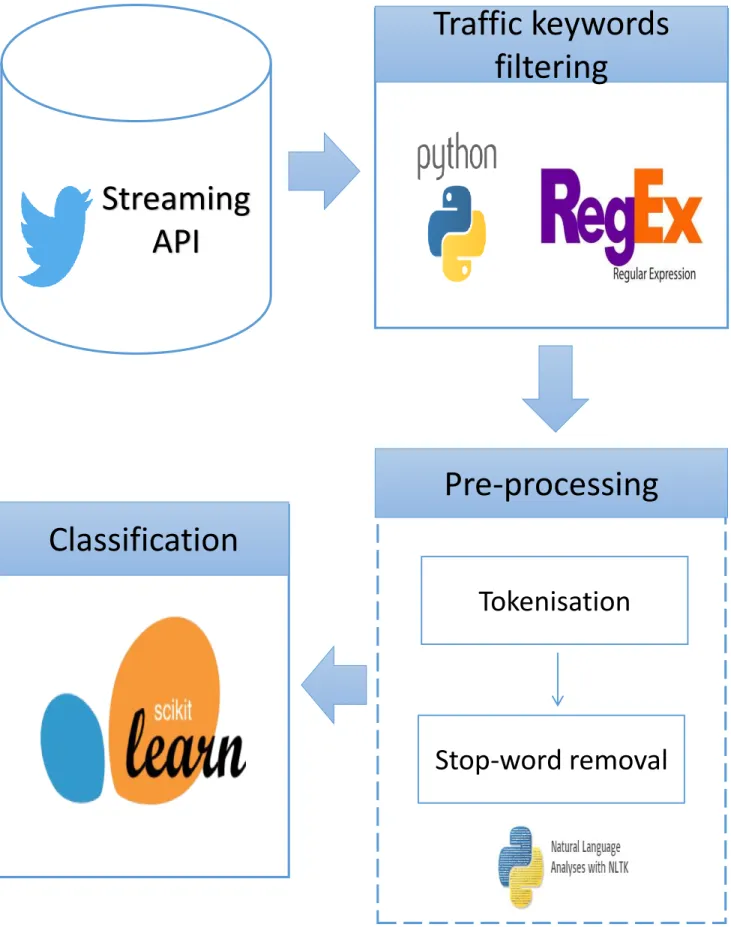
30
1 2 3 4 5 6 7 8 9 10 11 12 13 14 15 16 17 18 19 20 21 22 23 24 25 26 27 28 29 30 31 32 33 34 35 36 37 38 39 40 41 42 43 44 45 46 47 48 49 50 51 52 53 54 55 56 57 58 59 60 61 62 63 64 652
they happen, or shortly after. For instance, users turn to Twitter to report traffic incidents or to
31
describe the traffic situation they are currently in, making Twitter a real-time source of human
32
travel information. For this reason, Twitter data has proven to be very useful for detecting traffic
33
events. In addition, people use Twitter to express their opinion and emotions on a certain
34
subject. Particularly, traffic related tweets tend to be filled with emotions as users usually
35
complain about the state of the network, or are stressed about a traffic incident. It is important to
36
include this subjective data into traffic incident detection, as it can give a better understanding of
37
the user perception of the transport network (Kokkinogenis et al., 2015).
38
39
Using Twitter based data input for traffic incident detection overcome some of the issues faced
40
with conventional devices sensors. First, there is no cost involved as Twitter grants free access
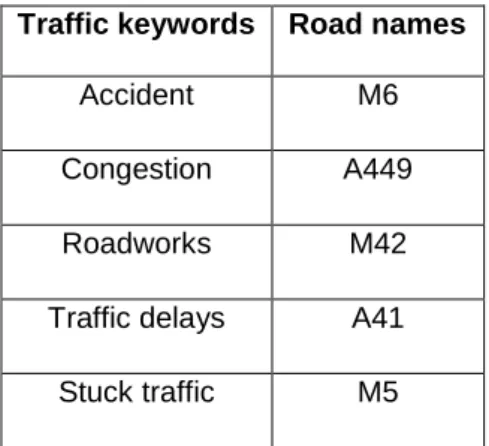
41
to a subset of their data. Second, while traditional sensors only detect changes in traffic
42
measures, a tweet usually contains more detailed information about the traffic event taking
43
place. Third, users can tweet from any location, covering broader areas of the transport
44
network. Lastly, traditional approaches fail to provide an insight into the user’s perception of the
45
flaws of the transport network. Nevertheless, there are some challenges involved with using
46
Twitter for incident detection. Traditional text mining techniques do not work well on tweets, as
47
they often contain emoticons, typos, and grammatical errors. Hence, with more than 500 million
48
tweets per day, it is difficult to detect useful information from noise (e.g.: non-traffic related,
49
spams). Finally, although Twitter data is free to access, there is a limitation on the amount that
50
can be obtained in real-time.
51
52
This paper presents a methodology for traffic event detection by fetching, filtering and
53
processing public tweets in real-time. The procedure uses Natural Language Processing (NLP)
54
techniques to process the tweets before they are fed into a machine learning classifier. This is
55
an initial attempt to examine the accuracy and potential of incident detection through Twitter.
56
For this reason, although the methodology can be applied in real-time, we implemented it using
57
historical twitter data. The remaining part of the paper proceeds as follows. We first give an
58
overview of different implementations of Twitter for incident detection. The methodology for
59
crawling, processing and classifying tweets is described in section 3. In section 4, results and
60
1 2 3 4 5 6 7 8 9 10 11 12 13 14 15 16 17 18 19 20 21 22 23 24 25 26 27 28 29 30 31 32 33 34 35 36 37 38 39 40 41 42 43 44 45 46 47 48 49 50 51 52 53 54 55 56 57 58 59 60 61 62 63 64 653
findings from the experimental implementation are presented. Finally, conclusions and
61
recommendations are drawn.
62
63
2. Related work
64
To date, several studies have analysed the use of Twitter for event detection. (Sakaki, Okazaki
65
& Matsuo, 2010) were amongst the first to propose a methodology to detect events using
66
Twitter. They were able to detect earthquakes with a 96% probability by using a Support Vector
67
Machine (SVM) for classification, and a Kalman filtering for location estimation. (Abel et al.
68
,2012) developed a framework for filtering, searching, and analysing real-time world incidents
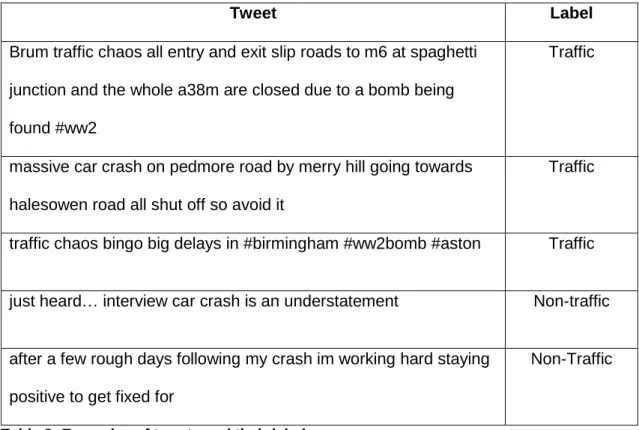
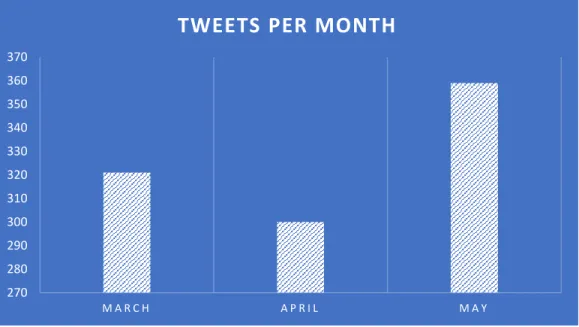
69
from social web streams. Their system could collect Twitter messages, related pictures, and
70
videos to the specific incident. In contrast, (Krstajic et al., 2012) detected potential events by
71
monitoring the frequency of individual keywords and for those with unexpected high frequency
72
values, it calculated additional scores that could help on describing the event. (R. Li et al., 2012)
73
presented TEDAS, a system for detecting, ranking and locating crime and disaster related
74
events by exploring information from Twitter. Similarly, Eventweet focused on detecting events
75
by adopting a continuous analysis of the most recent tweets within a time frame (Abdelhaq,
76
Sengstock & Gert, 2013). Lastly, (Osborne et al., 2014) introduced a system for monitoring
77
security relevant events, and tracking changes in emotions over time.
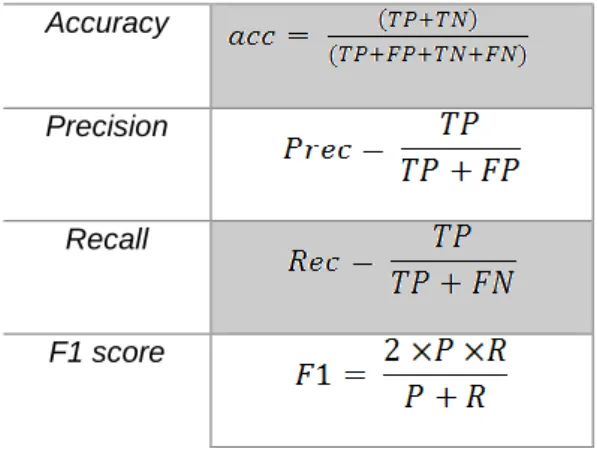
78
79
Concerning traffic incident detection, a number of researchers have presented different
80
methodologies to exploit twitter data as a sensor. For instance, (Gutierrez et al., 2015)
81
described an approach for integrating tweets from different traffic agencies in the UK, with the
82
purpose of notifying drivers about the status of the network in real-time. Our approach
83
concentrates on user generated tweets, rather than official traffic agencies tweets. (Schulz,
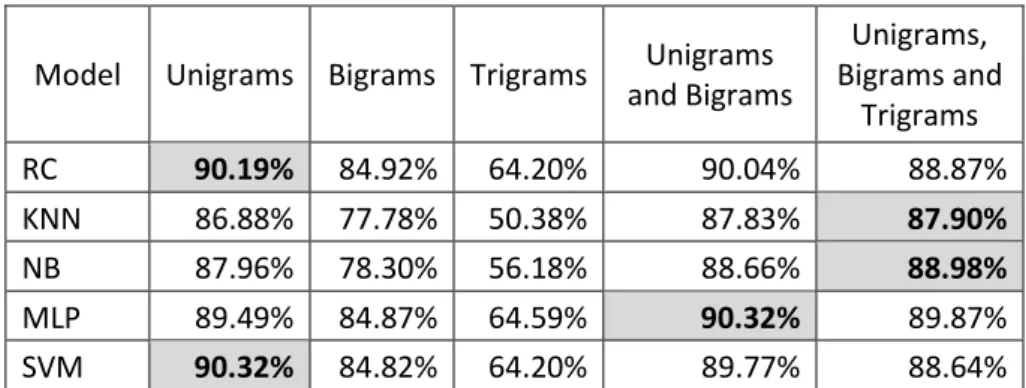
84
Ristoski & Paulheim, 2013) presented a methodology for the identification of small scale
85
incidents by combining text classification techniques with a machine learning algorithm. Their
86
outcome was to identify car crashes, while we aim to detect any event that can influence the
87
traffic condition. (D'Andrea et al., 2015) and (Gu, Qian & Chen, 2016) filtered tweets by traffic
88
related keywords, and used a machine learning algorithm to classify them into traffic related or
89
not. (D'Andrea et al., 2015) obtained promising results on the accuracy of the classifier, but they
90
1 2 3 4 5 6 7 8 9 10 11 12 13 14 15 16 17 18 19 20 21 22 23 24 25 26 27 28 29 30 31 32 33 34 35 36 37 38 39 40 41 42 43 44 45 46 47 48 49 50 51 52 53 54 55 56 57 58 59 60 61 62 63 64 654
tested it only on the training dataset. In this paper, we test the accuracy of the algorithm on a
91
different dataset, with the purpose of showing that the model is not overfitted to the training
92
data. In addition, these studies used the Twitter REST API to crawl tweets, while we propose
93
fetching them through the Twitter Streaming API. Lastly, existing research for mining user
94
generated tweets for traffic incident has been applied in the United States, Italy, and Germany.
95
In this study, we employed the methodology in the West Midlands region, in the United
96
Kingdom.97
98
3. Methodology99
100
In this section, we describe the methodology used to identify traffic incident information from
101
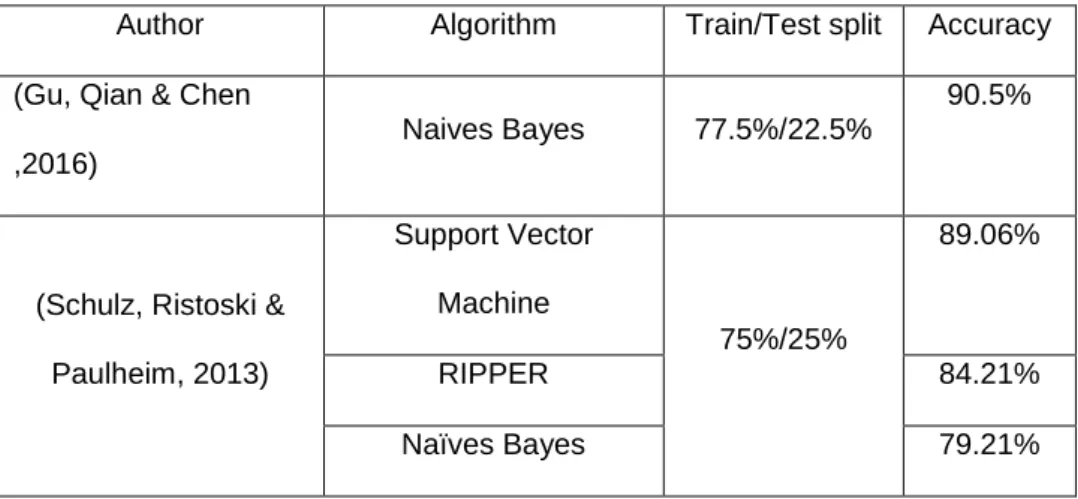
twitter data. Figure 1 shows the system architecture and the different tools used on each phase.
102
We fetched tweets using the Twitter Streaming API with a geolocation filter. Road names and
103
traffic related words were used as keywords as an additional filter. Next, we trained five
104
machine learning algorithms with different word n-grams and tested their classification accuracy.
105
Finally, we selected the most accurate n-gram features, and evaluated each classifier on the
106
test dataset.
107
108
3.1 Fetching Twitter data
109
The first step entails the extraction of raw tweets using the Twitter Streaming API. One of the
110
limitations of using the Streaming API is that it does not allow to filter by location and keyword.
111
This is the main reason why authors in the literature have used the Twitter Search API for their
112
studies. However, the Search API searches against a sample of recent tweets focusing on their
113
relevance, while the streaming API gives real-time access to the streams of public data flowing
114
through Twitter (Twitter, 2017). For this reason, we selected the Streaming API for this stage.
115
Twitter API’s are supported in many programming languages through a wide variety of libraries.
116
In our approach, we made an uninterrupted connection to the Streaming API with a geolocation
117
filter, using the Tweepy library in Python.
118
119
3.2 Traffic keywords filtering
120
1 2 3 4 5 6 7 8 9 10 11 12 13 14 15 16 17 18 19 20 21 22 23 24 25 26 27 28 29 30 31 32 33 34 35 36 37 38 39 40 41 42 43 44 45 46 47 48 49 50 51 52 53 54 55 56 57 58 59 60 61 62 63 64 655
On this stage, we perform an additional filter to obtain the tweets mentioning traffic related
121
words. To this end, we created a dictionary of highways, arterials, roads, and incident related
122
words. We used regular expressions to filter the acquired tweets using the keyword dictionary.
123
Table 1 shows an example of some of the keywords and road names used for filtration. In
124
addition, we used this stage to remove all retweets, as they do only contain repeated
125
information.
126
Traffic keywords Road names
Accident M6
Congestion A449
Roadworks M42
Traffic delays A41 Stuck traffic M5
Table 1: Keywords for filtration
127
128
3.3 Pre-processing
129
Due to their informal nature, tweets usually contain mentions, hashtags, links, special
130
characters and emoticons. This information needs to be removed before tweets are fed into the
131
classifier. In the following sections, the text mining techniques applied to the dataset are
132
described in detail.
133
3.3.1 Tokenisation
134
Tokenisation is the task of transforming a character sequence into pieces, called tokens, and at
135
the same time removing certain characters. There are a wide range of tokenization tools,
136
however they fail to recognise special tweet features such as @mentions, emoticons, URLs and
137
hashtags as individual tokens. For this reason, we employed a pre-processing chain based on
138
regular expressions that considers all these aspects. During this step, the tokeniser removes
139
mentions, hashtags, URLs, punctuation and emoticons, and splits each tweet into a set of words
140
(‘tokens’).
141
3.3.2 Stop word removal
142
Stop words are those common words that have little value in helping characterise a text, such
143
as articles, conjunctions, and prepositions. These words are not very meaningful when deciding
144
1 2 3 4 5 6 7 8 9 10 11 12 13 14 15 16 17 18 19 20 21 22 23 24 25 26 27 28 29 30 31 32 33 34 35 36 37 38 39 40 41 42 43 44 45 46 47 48 49 50 51 52 53 54 55 56 57 58 59 60 61 62 63 64 656
if a tweet is traffic related or not, thus not valuable to be fed into a machine learning classifier. In
145
our approach, the full list of English stop words from the Natural Language Toolkit (NLTK)
146
library was used to remove stop words from the set of tokens.
147
148
3.4 Classification
149
Once tweets have been pre-processed, they were classified into traffic related or not. To
150
achieve this, a machine learning algorithm was employed. Studies in the literature have
151
employed and compared a wide range of text classification algorithms for incident detection
152
using Twitter data (Schulz, Ristoski & Paulheim, 2013, D'Andrea et al., 2015, Wanichayapong et
153
al., 2011, Gu, Qian & Chen, 2016). For this study, we compared a Ridge Classifier (RC), Naïve
154
Bayes (NB), k-Nearest Neighbour (kNN), Multilayer Perceptron (MLP) and a Support Vector
155
Machine (SVM). We combined and evaluated the classifiers with different word n-gram features
156
on the training dataset, and selected the most accurate parameters on each algorithm for the
157
test data. For this step, the machine learning library ScikitLearn was used.
158
159
4. Case study: West midlands region, England
160
161
We evaluated our methodology using tweets from the West Midlands area in the United
162
Kingdom. Firstly, we measured the performance of the classifiers using different features on the
163
training dataset. Then, we selected the most effective feature amongst each classifier for the
164
test dataset. Lastly, we compared our work to similar studies in the literature.
165
166
4.1 Twitter data acquisition
167
We collected 4 million tweets using an uninterrupted connection to the Twitter Streaming API
168
from March 1st, 2017 to May 31st, 2017, with the coordinates to the West Midlands region as a
169
geolocation filter. From these data, the regular expressions filter extracted 13,410 tweets, using
170
a dictionary of 265 road names and traffic related keywords. Tweets were then manually
171
labelled into traffic and non-traffic related, and divided into the following datasets:
172
Training: This is the portion of tweets used to train and validate the text classification
173
algorithms. It consisted of 785 traffic related tweets and 785 non-traffic related.
174
1 2 3 4 5 6 7 8 9 10 11 12 13 14 15 16 17 18 19 20 21 22 23 24 25 26 27 28 29 30 31 32 33 34 35 36 37 38 39 40 41 42 43 44 45 46 47 48 49 50 51 52 53 54 55 56 57 58 59 60 61 62 63 64 657
Test: To show the effectiveness of the classifiers on a different dataset than the training,175
we built a test dataset of 196 traffic tweets and 196 non-traffic related tweets.
176
177
From the three-month period, May obtained the highest amount of traffic related Tweets (see
178
figure 1). This was influenced by a high traffic of tweets on the 15th and 16th of May, due to the
179
identification of an undetonated WWII bomb in the city centre of Birmingham. Table 2 has some
180
examples of traffic and non-traffic related tweets from May 2017. It is important to mention that
181
even though our methodology does not include geolocation, we only took into consideration as
182
traffic tweets those that specify the location of the incident.
183
184
Tweet
Label
Brum traffic chaos all entry and exit slip roads to m6 at spaghetti
junction and the whole a38m are closed due to a bomb being
found #ww2
Traffic
massive car crash on pedmore road by merry hill going towards
halesowen road all shut off so avoid it
Traffic
traffic chaos bingo big delays in #birmingham #ww2bomb #aston
Traffic
just heard… interview car crash is an understatement
Non-traffic
after a few rough days following my crash im working hard staying
positive to get fixed for
Non-Traffic
Table 2: Examples of tweets and their label
185
186
4.2 Experimental results
187
With the purpose of identifying which feature works best with the different machine learning
188
algorithms, we tested each classifier with different n-gram values on the training dataset. For
189
this step, we used a k-fold cross validation methodology. K-fold crossvalidation randomly
190
partitions the dataset into k equal sized folds. From these folds, one is retained for testing the
191
model, while the remaining k-1 are used as training data. This process is repeated k times,
192
1 2 3 4 5 6 7 8 9 10 11 12 13 14 15 16 17 18 19 20 21 22 23 24 25 26 27 28 29 30 31 32 33 34 35 36 37 38 39 40 41 42 43 44 45 46 47 48 49 50 51 52 53 54 55 56 57 58 59 60 61 62 63 64 658
using each of the k folds exactly once as test data. We performed the k-fold crossvalidation with
193
n = 10 on the training dataset for each classifier/n-gram.
194
195
To evaluate the performance of the classifiers, we calculated the statistical metrics shown in
196
table 3. True negative (TN) and true positive (TP) correspond to the tweets that were classified
197
correctly as non-traffic and traffic related, respectively; while False negative (FN) and False
198
positive (FP) tweets are those that were misclassified as non-traffic and traffic tweets. Accuracy
199
is the overall efficiency of the classifier and corresponds to the fraction of correctly classified
200
tweets by the total number of tweets. Precision of a class represents the fraction of correctly
201
classified tweets within that class. Recall of a class is the number of correctly classified tweets
202
over the total number of tweets that belong to that class. F1-score is the weighted mean of
203
precision and recall.
204
Metric Formula Accuracy Precision Recall F1 scoreTable 3: Evaluation metrics
205
206
Table 4 shows the results from the cross validation of the training data using different n-gram
207
ranges. For each classifier, we performed the 10-fold cross validation using unigrams, bigrams,
208
unigrams and bigrams, and unigrams, bigrams and trigrams. We calculated the average of the
209
10 values of accuracy obtained in the cross validation. It can be perceived that most of the
210
classifiers have higher perfomance using unigrams or the combination of the three features,
211
while the worst performance amongst all is observed on the trigrams.
212
213
1 2 3 4 5 6 7 8 9 10 11 12 13 14 15 16 17 18 19 20 21 22 23 24 25 26 27 28 29 30 31 32 33 34 35 36 37 38 39 40 41 42 43 44 45 46 47 48 49 50 51 52 53 54 55 56 57 58 59 60 61 62 63 64 659
Model
Unigrams Bigrams Trigrams
Unigrams
and Bigrams
Unigrams,
Bigrams and
Trigrams
RC
90.19%
84.92%
64.20%
90.04%
88.87%
KNN
86.88%
77.78%
50.38%
87.83%
87.90%
NB
87.96%
78.30%
56.18%
88.66%
88.98%
MLP
89.49%
84.87%
64.59%
90.32%
89.87%
SVM
90.32%
84.82%
64.20%
89.77%
88.64%
Table 4: Classifiers vs word n-gram features
214
215
We selected the feature with the highest accuracy for each classifier, and proceeded to evaluate
216
them on the test dataset. Table 5 depicts the classification results for each classifier on the test
217
dataset. The classifier with the highest accuracy was the Ridge classifier (RC) with a 92.86%.
218
MLP and SVM had similar performance to the Ridge classifier both with 92.6%, while the NB
219
was the one with the lowest accuracy with an 89.54%. These results show that the classifiers
220
are not overfitted to the events in the training data. The classifiers had more precision
221
predicting non-traffic related tweets, but less recall. This shows that while the model identified a
222
higher number of traffic related tweets, they had more precision identifying non-traffic related
223
ones.
224
Model
Traffic
Non-Traffic
Accuracy
Prec
Rec
F1
Prec
Rec
F1
RC
90.38%
95.92%
93.07%
95.65%
89.80%
92.63%
92.86%
KNN
86.18%
95.41%
90.56%
94.86%
84.69%
89.49%
90.05%
NB
84.14%
97.45%
90.31%
96.97%
81.63%
88.64%
89.54%
MLP
89.57%
96.43%
92.87%
96.13%
88.78%
92.31%
92.60%
SVM
89.57%
96.43%
92.87%
96.13%
88.78%
92.31%
92.60%
Table 5: Results on the test dataset
225
226
Results from the test dataset showed that a RC, MLP or a SVM would obtain high accuracy on
227
classifying tweets into traffic related or not. However, there are other aspects that need to be
228
taken into consideration, such as the training and prediction time. Table 6 contains the training
229
and prediction time of each algorithm on the test dataset in seconds. RC and SVM are the
230
fastest in both training and prediction both with 0.04s and 0.008s respectively. However,
231
although MLP obtained one of the highest accuracy scores, it needed 43.53s to train. This is
232
more than 1000 times more of what was needed by the RC and the SVM. Contrary to RC and
233
1 2 3 4 5 6 7 8 9 10 11 12 13 14 15 16 17 18 19 20 21 22 23 24 25 26 27 28 29 30 31 32 33 34 35 36 37 38 39 40 41 42 43 44 45 46 47 48 49 50 51 52 53 54 55 56 57 58 59 60 61 62 63 64 6510
SVM, MLP obtained more accuracy using unigrams and bigrams, instead of only unigrams,
234
which increases the computing time. However, MLP always obtained the highest computing
235
time amongst all the n-gram variations.
236
237
Algorithm Training time Prediction time
RC
0.044 0.008KNN
0.149 0.048NB
0.176 0.039MLP
43.53 0.02SVM
0.04 0.008Table 6: Training and prediction time (sec)
238
239
As seen in table 7, results from our RC outperformed studies in the literature. We only took into
240
consideration studies that tested their classifiers on a dataset different than the training one.
241
(Gu, Qian & Chen ,2016) obtained an accuracy of 90.5% on their test dataset, using a Naïve
242
Bayes classifier identifying traffic related tweets. On the other hand, (Schulz, Ristoski &
243
Paulheim ,2013) compared SVM, RIPPER and NB for the identification of car accidents, with
244
accuracies of 89.06%, 84.21% and 79.21%, respectively. In this paper, we used a split of
245
75%/25% of the train and test data, which was similar to the ones used by these studies. Both
246
studies employed the REST API for crawling tweets, while we used the Streaming API.
247
Author Algorithm Train/Test split Accuracy
(Gu, Qian & Chen ,2016)
Naives Bayes 77.5%/22.5%
90.5%
(Schulz, Ristoski & Paulheim, 2013) Support Vector Machine 75%/25% 89.06% RIPPER 84.21% Naïves Bayes 79.21%
Table 7: Results from the literature
248
249
4. Conclusions and future work
250
1 2 3 4 5 6 7 8 9 10 11 12 13 14 15 16 17 18 19 20 21 22 23 24 25 26 27 28 29 30 31 32 33 34 35 36 37 38 39 40 41 42 43 44 45 46 47 48 49 50 51 52 53 54 55 56 57 58 59 60 61 62 63 64 6511
We have developed a methodology for crawling, processing, and classifying traffic related
251
tweets in real-time. We fetched tweets using an uninterrupted connection to the Streaming API.
252
Then, we used natural language processing techniques to remove special characters and
stop-253
words. We compared five different machine learning algorithms, and obtained an overall highest
254
accuracy of 92.86% with a Ridge Classifier on our test data. Our results outperformed similar
255
studies in the literature.
256
257
Our experimental results show the ability of the system in detecting traffic incidents on real-time.
258
This information can be incorporated on AID systems to improve their accuracy to wider areas
259
of the network. Social media data can also be used to detect the feedback of the users in
260
specific parts of the network.
261
262
This paper is part of an on-going work for a real-time pipeline for incident detection using
263
Twitter. Future work includes the use of additional NLP techniques to improve the accuracy of
264
the classifier and to detect the location of the incident. Finally, sentiment and stress analysis will
265
be performed to obtain the user’s perspective of the network.
266
267
Acknowledgements
268
This research was supported by the European Union’s Horizon 2020 research and innovation
269
programme under grant agreement No 636160-2, the Optimum project
270
www.optimumproject.eu.
271
272
This paper is part of a PhD sponsored by the Dominican Republic’s Ministry of Education
273
(MESCyT).274
275
References276
Abdelhaq, H., Sengstock, C. & Gertz, M. 2013, "Eventweet: Online localized event detection
277
from twitter", Proceedings of the VLDB Endowment, vol. 6, no. 12, pp. 1326-1329.
278
Abel, F., Hauff, C., Houben, G., Stronkman, R. & Tao, K. 2012, "Twitcident: fighting fire with
279
information from social web streams", Proceedings of the 21st International Conference on
280
World Wide WebACM, , pp. 305.
281
1 2 3 4 5 6 7 8 9 10 11 12 13 14 15 16 17 18 19 20 21 22 23 24 25 26 27 28 29 30 31 32 33 34 35 36 37 38 39 40 41 42 43 44 45 46 47 48 49 50 51 52 53 54 55 56 57 58 59 60 61 62 63 64 6512
Atefeh, F. & Khreich, W. 2015, "A Survey of Techniques for Event Detection in Twitter",
282
Computational Intelligence, vol. 31, no. 1, pp. 132-164.
283
D'Andrea, E., Ducange, P., Lazzerini, B. & Marcelloni, F. 2015, "Real-Time Detection of Traffic
284
From Twitter Stream Analysis", IEEE Transactions on Intelligent Transportation Systems,
285
vol. 16, no. 4, pp. 2269-2283.
286
D'Andrea, E. & Marcelloni, F. 2017, "Detection of traffic congestion and incidents from GPS
287
trace analysis", Expert Systems with Applications, vol. 73, pp. 43-56.
288
DfT 2017, Road Traffic Estimates: Great Britain 2016. Available:
289
https://www.gov.uk/government/statistics/road-traffic-estimates-in-great-britain-2016
290
Gu, Y., Qian, Z.(. & Chen, F. 2016, "From Twitter to detector: Real-time traffic incident detection
291
using social media data", Transportation Research Part C: Emerging Technologies, vol.
292
67, pp. 321 342.
293
Gutierrez, C., Figuerias, P., Oliveira, P., Costa, R. & Jardim-Goncalves, R. 2015, "Twitter mining
294
for traffic events detection", Proceedings of the 2015 Science and Information Conference,
295
SAI 2015, , pp. 371-378.
296
Krstajic, M., Rohrdantz, C., Hund, M. & Weiler, A. 2012, "Getting there first: Real-time detection
297
of real-world incidents on twitter", .
298
N. Wanichayapong, W. Pruthipunyaskul, W. Pattara-Atikom & P. Chaovalit 2011, "Social-based
299
traffic information extraction and classification", ITS Telecommunications (ITST), 2011 11th
300
International Conference on, pp. 107.
301
Osborne, M., Moran, S., McCreadie, R., Von Lunen, A., Sykora, M.D., Cano, E., Ireson, N.,
302
Macdonald, C., Ounis, I. & He, Y. 2014, "Real-time detection, tracking, and monitoring of
303
automatically discovered events in social media", .
304
Parkany, E. & Xie, C. 2005, A complete review of incident detection algorithms & their
305
deployment: what works and what doesn't.
306
R. Li, K. H. Lei, R. Khadiwala & K. C. C. Chang 2012, "TEDAS: A Twitter-based Event Detection
307
and Analysis System", 2012 IEEE 28th International Conference on Data Engineering, pp.
308
1273.
309
Sakaki, T., Okazaki, M. & Matsuo, Y. 2010, "Earthquake shakes Twitter users: real-time event
310
detection by social sensors", Proceedings of the 19th international conference on World
311
wide webACM, , pp. 851.
312
Schulz, A., Ristoski, P. & Paulheim, H. 2013, "I See a Car Crash: Real-Time Detection of Small
313
Scale Incidents in Microblogs", Springer, Berlin, Heidelberg, , pp. 22.
314
Siripanpornchana, C., Panichpapiboon, S. & Chaovalit, P. 2016, "Incidents detection through
315
mobile sensing", IEEE, , pp. 1.
316
Twitter 2017. The Search API. Available: https://dev.twitter.com/rest/public/search.
317
318
1 2 3 4 5 6 7 8 9 10 11 12 13 14 15 16 17 18 19 20 21 22 23 24 25 26 27 28 29 30 31 32 33 34 35 36 37 38 39 40 41 42 43 44 45 46 47 48 49 50 51 52 53 54 55 56 57 58 59 60 61 62 63 64 65270 280 290 300 310 320 330 340 350 360 370 M A R C H A P R I L M A Y