The Role of Bi-doping in Promoting Electron Transfer
and Catalytic Performance of Pt/3DOM-Ce
1-xBi
xO
2-δKai Yu,[a][b][c] Da Lei,[a][b] Yajun Feng,[a] Yue Chang,[b] Haochen Yu,[b] Yanbing Wang,[b] Yaqi Liu,[a] Gui-Chang Wang,[d] Lan-Lan Lou,*[b][c] Shuangxi Liu,*[b] Wuzong Zhou*[c]
[a] MOE Key Laboratory of Pollution Processes and Environmental Criteria, College of
Environmental Science and Engineering, Nankai University, Tianjin 300350, China
[b] Institute of New Catalytic Materials Science and MOE Key Laboratory of Advanced Energy
Materials Chemistry, School of Materials Science and Engineering, National Institute of Advanced Materials, Nankai University, Tianjin 300350, China
[c] School of Chemistry, University of St Andrews, St Andrews, Fife KY16 9ST, United Kingdom
[d] College of Chemistry, Nankai University, Tianjin 300071, China
Corresponding authors:
Abstract
:
Investigation of Bi-doping effect on catalytic performance of Pt/3DOM-Ce1-xBixO2-δ in the aerobic
oxidation of 5-hydroxymethyl-2-furfural allows us to reveal the promoted catalytically active sites: the asymmetrical oxygen vacancies coordinated with one Bi and up to three Ce cations, e.g.
Bi-(-Ce)3, which can easily gain oxygen atoms in favor of the CeO2 structure, and, when filled by
oxygen, easily release oxygen anions in favor of six coordination for Bi3+. The loss of electrons in
the reduction of oxygen atoms at these sites would be replenished by electron transfer from Pt nanoparticles, eventually promoting the oxidation potential of the Pt nanoparticles. The present work points out that the promoted catalytic properties in Bi-doped CeO2 is mainly due to the
asymmetric structures of the oxygen vacancies, rather than simply to the number of the oxygen vacancies. The newly proposed model of asymmetrical active sites and electron transfer mechanism may shed light on the future investigation of the physico-chemical properties of other solid solution substrate supported metal nanoparticle catalysts.
1. Introduction
Supported metal nanocatalysts are commonly used in chemical industry and have been investigated extensively. However, to identify the active sites and to understand electron transfer process in between the metal nanoparticles and the substrates are still challenging targets.[1-3] To
evade the extreme difficulties of direct detection of the catalytically active sites and the charge transfer, we tried to gain the relevant information of changes in structures of catalysts and in catalytic activity of selected reactions, to reveal the active sites via an indirect method. The first selected example was Pt nanocatalyst supported by Bi-doped CeO2-δ used for aerobic oxidation of
5-hydroxymethyl-2-furfural (HMF).
As far as practical catalysts are considered, CeO2 and its ternary oxides, as efficient catalysts
or catalyst carriers, have been widely used in many catalytic systems.[4] The low redox potential
between Ce3+ and Ce4+ (1.3~1.8 V) and high oxygen-storage-capacity allow CeO
2–based catalysts
to exhibit promising catalytic activity for aerobic oxidation of various reactants, such as CO,[5,6]
soot,[7,8] and alcohols.[9,10]
The biomass-derived HMF is considered as an important intermediate from renewable biomass to industrial chemicals. It can be obtained from inexpensive and plentiful cellulosic derivatives, such as fructose, glucose, and cellulose,[11-13] and can be converted to a series of
important chemical compounds through aerobic oxidation, e.g. 2,diformylfuran (DFF), 5-hydroxymethyl-2-furancarboxylic acid (HMFCA), 5-formyl-2-furancarboxylic acid (FFCA), 2,5-furandicarboxylic acid (FDCA), etc.[14,15] Especially, its oxidation product, FDCA, is one of the
selected top value added platform chemicals from biomass, and can be used as a monomer for the production of new polyesters and nylons.[16] Metal oxide supported noble metal nanocatalysts are
FDCA.[17-19] Among them, CeO
2 supported Au,[20-22] Pt,[23] or Au-Cu alloy[20] nanocatalysts
exhibited notably enhanced catalytic performance in comparison with catalysts using other oxide carriers. Moreover, the Bi-doped CeO2, as an efficient carrier, can further improve their catalytic
properties.[21,23] Although it is believed that the promotion of the catalytic properties using CeO 2
as catalyst carrier is mainly attributed to a large amount of oxygen vacancies on the surface of the oxides, giving a true composition of CeO2−δ, till now, our understanding of the role of oxygen
vacancies and possible charge transfer in between the metal particles and the carriers is still superficial.
In the present work, a series of three-dimensionally ordered macroporous (3DOM) Ce1−xBixO2−δ were fabricated using polymethylmethacrylate (PMMA) colloidal crystals as
template and employed as catalyst carriers to support Pt nanoparticles. We found that the macroporous structure of these specimens could indeed greatly facilitate the mass transfer. More importantly, significant promotions of electron transfer from Pt nanoparticles to Bi-doped CeO2-δ
and catalytic performance of these catalysts in the aerobic oxidation of HMF were observed in comparison with the Bi-free catalyst. We infer based on the experimental data that the asymmetrical vacancy sites, represented by Bi-(-Ce)3, have different properties from the
symmetrical vacancy sites, e.g. (Ce-)2(-Ce)2 and (Bi-)2(-Bi)2, where represents an oxygen
vacancy. The role of Bi-doping in the catalytic process is elucidated in a proposed mechanism, which may be used for explanation of many other nanoscale catalysts supported by metal oxides, where an interaction between the surface nanoparticles and the oxide support is significant.
2. Experimental Section
All chemicals were obtained from commercial source and without further purification. HMF (97%) and FDCA (98%) were purchased from Heowns Biochemical Technology Co., Ltd. HMFCA (98%) was obtained from Matrix Scientific. DFF (98%) was provided by Sun Chemical Technology Co., Ltd. FFCA (98%) was supplied by Toronto Research Chemicals Inc. In quantitative analysis of chromatogram, the above specimens were used as the standards. Methanol, potassium persulfate (KPS, K2S2O8), and sodium bicarbonate were obtained from Sinopharm
Chemical Reagent Co., Ltd. Polyvinylpyrrolidone (PVP, MW = 58000) was obtained from Tianjing Guangfu Fine Chemistry Research Institute. Methyl methacrylate (MMA), ethylene glycol, ascorbic acid, cerium(III) nitrate hexahydrate (Ce(NO3)3·6H2O), bismuth(III) nitrate
pentahydrate (Bi(NO3)3·5H2O), and chloroplatinic acid hexahydrate (H2PtCl6·6H2O) were
purchased from Aladdin Chemicals Co., Ltd. 2.2. Characterization methods.
Powder X-ray diffraction (XRD) patterns were recorded on a Rigaku SmartLab 3 kW diffractometer with Cu Kα X-ray (λ = 1.541 Å) operating at 40 kV and 40 mA, in a 2θ range of
20° to 90° with a scanning rate of 6° min1. N
2 sorption analysis was carried out on a Micromeritics
Ultra DLD spectrometer employing a monochromatic Al Kα X-ray source (hν = 1486.6 eV) and
the binding energy was corrected using the C 1s peak (BE = 284.6 eV) of carbon contaminants as an internal standard. Raman spectra were collected on a Renishaw inVia model Raman microscope with a CCD detector (Renishaw Ltd., UK). The samples were excited using radiation at 514.5 nm. H2-temperature programmed reduction (H2-TPR) and pulse CO chemisorption experiments were
carried out on a Micromeritics ChemiSorb 2750 analyzer with a thermal conductivity detector. An Agilent 1200 series high-performance liquid chromatograph (HPLC) equipped with a Waters Atlantis T3 column and a UV-Vis detector operating at 271 nm was used to analyze the reaction solution. A H3PO4 aqueous solution (1 mmol L1) was used as the mobile phase at a flow rate of
0.6 mL min1.
2.3. Synthesis of Ce1-xBixO2-δ materials.
Ce1-xBixO2-δ materials with 3DOM structure were synthesized using PMMA colloidal crystal
(Figure S1) as a template. The PMMA colloidal crystal template with an average diameter of ca. 300 nm was synthesized through an emulsifier-free emulsion polymerization technique according to our previous work.[24]
In a typical synthesis process of 3DOM-Ce1-xBixO2-δ materials, ethylene glycol (2 mL),
methanol (7 mL), nitric acid (1 mL, 68 wt%), and ascorbic acid (10 mmol) were dissolved in deionized water (10 mL). Ce(NO3)3·6H2O and Bi(NO3)3·5H2O (with mole numbers nBi + nCe = 10
mmol) with a selected ratio were added into this solution. After 3 h stirring at room temperature, PMMA colloidal crystal (8.0 g) was soaked into this prepared solution for 3 h. Following a filtration and vacuum drying process, the yellowish sample was calcined in an air flow (80 mL min1) at a ramp of 1 °C min1 from room temperature to 550 °C and maintained at this temperature
different Bi3+ doping levels were obtained. For comparison, the nanosized Ce
1-xBixO2-δ samples
were prepared using the same method, but in the absence of PMMA colloidal crystal template. The obtained samples were designated as Ce1-xBixO2-δ (x = 0, 0.1, 0.2, 0.3).
2.4. Synthesis of Pt/3DOM-Ce1-xBixO2-δ catalysts.
3DOM-Ce1-xBixO2-δ or Ce1-xBixO2-δ (0.15 g) was dispersed into an aqueous solution of
H2PtCl6·6H2O (1.59 mL, 5.0 mg mL1) under stirring in an ultrasonic bath for 10 min, and the
resulted mixture was continually stirred for another 5 h. An ethylene glycol solution of PVP (0.31 mmol in 40 mL) was then added into the mixture. After further stirring for 30 min, the reaction mixture was heated to 130 °C and aged for 4 h to ensure completion of the reaction. The product was centrifuged and washed several times with absolute ethanol, and dried at 55 °C for 12 h. The obtained catalysts were designated as Pt/3DOM-Ce1-xBixO2-δ and Pt/Ce1-xBixO2-δ, respectively.
The nominal Pt content in these catalysts was 2 wt%, while the results of ICP-AES characterization indicated that the actual Pt loading was about 1.88 wt%.
2.5. Oxidation of HMF.
The catalyst (0.039 g) was added into a solution of HMF (0.40 mmol) and NaHCO3 (1.6
mmol) in deionized water (20 mL). The suspension was heated to 90 °C under stirring and bubbled with O2 at a flow rate of 70 mL min1. An aliquot (50 μL) of the reaction mixture was taken out at
using Pt/3DOM-Ce0.8Bi0.2O2-δ as catalyst. The RSD values for yield of HMFCA, FFCA and FDCA
were determined as 1.7%, 2.4% and 2.5%, respectively. 2.6. Computational methods.
The DFT+U calculation using the Vienna ab initio simulation package (VASP)[25, 26] was
introduced to investigate the thermodynamic properties of obtained solid solution samples. All calculations in this work used the generalized gradient approximation (GGA-PW91)[27] as the
exchange-correlation functional, and energy cutoff of 500 eV was used for the plane-wave expansion of the electronic wave function. The DFT+U method evaluated the on-site coulomb and exchange interactions in the localized 4f orbital electrons of Ce by adding an effective Hubbard-U parameter to repulse electrons on the same orbitals.[28,29] It was reported that the theoretical U
value was 5 eV.[30,31] The p(2√3×3) slab models of Ce(111) with top four atomic layers relaxed
and bottom three layers fixed were used in the present work, the corresponding k-point meshes were set to 2 × 2 ×1. The vacuum space was set to 20 Å between the slabs to minimize their interaction.
3. Results and Discussion
3.1. Characterization of 3DOM-Ce1-xBixO2-δ specimens.
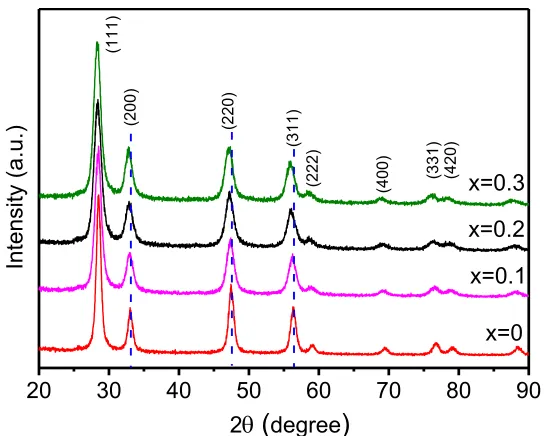
Initial characterization of the 3DOM-Ce1-xBixO2-δ samples was by using XRD as shown in
Figure 1. All the diffraction peaks can be indexed onto a CeO2-like unit cell, with a peak shift to a
lower angle region corresponding to the Bi-doping, indicating a solid solution state in the whole compositional range up to the Bi-doping of 30%. This can be understood since the high temperature phase, δ-Bi2O3, has also a fluorite structure with 25% oxygen vacancies, which can
be stabilized at room temperature in a form of solid solution with less oxygen vacancies.[32] In
Figure 1. XRD patterns of the 3DOM-Ce1-xBixO2-δ specimens with x from 0 to 0.3. The diffraction
peaks are indexed to the CeO2-like face-centered cubic unit cell with a = 0.5416 nm (JCPDS
34-0394). The dashed lines mark the peak positions of the x = 0 sample.
Typical SEM image of 3DOM-Ce1-xBixO2-δ (x = 0.2) is shown in Figure 2a. More SEM
images of 3DOM-Ce1-xBixO2-δ at lower magnifications are shown in Figure S2. It can be seen from
these images that a well-ordered array of cages, with an inverse opal structure, appears in the porous specimens. A typical diameter of the cages (negative replica of the close packed PMMA colloidal spheres) is about 160 nm, implying a shrinkage of ca. 47% in comparison with the size of PMMA spheres. The cages are inter-connected via open windows about 78 nm in diameter, and the average thickness of cage wall is about 23 nm. EDS elemental mapping of 3DOM-Ce0.8Bi0.2O 2-δ exhibits even distributions of both Ce and Bi elements in this solid solution material as shown in
Figure 2b.
20 30 40 50 60 70 80 90
(420)
(331)
(400)
(222)
x=0 x=0.1 x=0.2
Intensity (a.u.)
x=0.3
(311)
(220)
(200)
(111)
Figure 2. (a) SEM image and (b) EDS elemental mapping of 3DOM-Ce0.8Bi0.2O2-δ. The
dimensions of the cage, inter-cage window and the wall thickness are marked in (a).
The macroporous structure and specific surface areas of these 3DOM-Ce1-xBixO2-δ materials
were measured by nitrogen sorption method. The type II characteristic isotherms with an H3 hysteresis loop in the relative pressure (p/p0) range of 0.8~1.0 were observed from 3DOM-Ce 1-xBixO2-δ, indicating the existence of macroporous structure. The BET surface areas of the
[image:10.612.108.514.72.232.2]3DOM-Ce1-xBixO2-δ specimens are in a range of 30~42 m2 g1 (Figure S3 and Table S1).
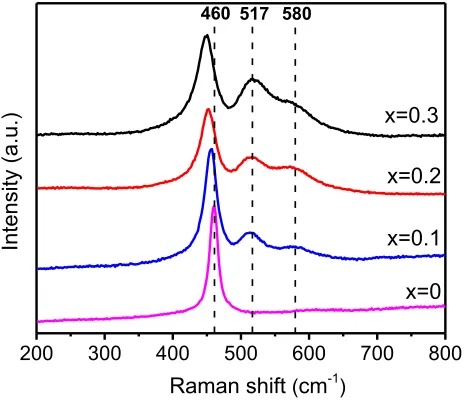
Figure 3. Raman spectra of the 3DOM-Ce1-xBixO2-δ specimens with x from 0 to 0.3.
200 300 400 500 600 700 800
580 517 460
x=0 x=0.1 x=0.2 x=0.3
Intensity (a.u.)
[image:10.612.196.428.474.676.2]Bi3+ cations have six coordination of oxygen in the fluorite-type δ-Bi
2O3, leaving two
oxygen vacancies in the eight coordinated environment. In the present work, Raman spectroscopy was used to detect any possible local distortion induced by such Bi-doping (Figure 3). The spectrum of Bi-free CeO2 displays a strong peak at 460 cm1, which is assigned to the F2g
vibrational mode of cubic fluorite structure of CeO2.[33] With the Bi3+-doping, this peak slightly
red-shifts to a lower wavenumber, suggesting an obvious variation of the Ce-O bonding symmetry.[34] The peak at 517 cm1, being absent in pure CeO
2 and increasing its intensity with
the Bi-doping, can be assigned to BiO6 octahedral units in fluorite-type CeO2 structure. This peak
was also detected from fluorite-type δ-Bi2O3.[35,36] The peak at 580 cm1, also absent in pure CeO2,
can be assigned to Ce3+-O bonds associated with the asymmetric Bi3+-(-Ce3+)
3 sites.[37] The curve
fitting of the Raman spectra (Figure S4a-c) suggests that 3DOM-Ce0.8Bi0.2O2-δ has the largest
amount of Ce3+ among these specimens.
To further quantitatively determine the concentration of Ce3+, which normally co-exist with
oxygen vacancies, Ce 3d and O 1s XPS spectra of these catalysts were measured. Ten characteristic peaks are observed in the Ce 3d curves (Figure 4a). The five peaks centered at 880.6, 882.2, 885.3, 888.8, and 898.0 eV, corresponding to v0, v, v’, v’’, and v’’’, respectively, can be attributed to the
Ce 3d5/2 contributions. The peaks at 899.2, 900.7, 904.0, 907.3, and 916.5 eV, corresponding to
u0, u, u’, u’’, and u’’’, respectively, are derived from the Ce 3d3/2 contributions. Among these Ce
3d peaks, u0, u’, and v0, v’, can be ascribed to the Ce3+ 3d3/2 and Ce3+ 3d5/2. While the peaks labeled
as u, u’’, u’’’ and v, v’’, v’’’ are assigned to Ce4+ 3d
3/2 and Ce4+ 3d5/2, respectively.[38,39] It can be
seen that more Ce3+ species are detected in all the Bi-doped specimens compared with the Bi-free
CeO2. 3DOM-Ce0.8Bi0.2O2-δ exhibits the highest ratio of Ce3+ to total Ce (16.5%) among these
Figure 4. (a) Ce 3d and (b) O 1s XPS spectra of 3DOM-Ce1-xBixO2-δ with x from 0 to 0.3.
The O 1s XPS was employed to study the chemical states of oxygen in the surface regions of 3DOM-Ce1-xBixO2-δ. As shown in Figure 4b, the peaks centred at 529.0-529.1 eV can be attributed
to the lattice O2− (denoted as O
β), and the peaks centred at 531.2-531.4 eV can be assigned to the
chemisorbed oxygen species (denoted as Oα), such as O22− and O2−.[40] The weak peaks at ~533 eV
can be attributed to the absorbed water.[41] The ratio of O
α/(Oα+Oβ) represents the oxygen
activation capacity of the specimens, which is normally related with their amount of oxygen vacancies. It can be found that 3DOM-Ce0.8Bi0.2O2-δ exhibits the highest amount of Oα, which is
well consistent with the results of Ce 3d XPS.
3.2. Characterization of Pt/3DOM-Ce1-xBixO2-δ catalysts.
After deposition of Pt nanoparticles, the inverse opal morphology of the 3DOM-Ce1-xBixO2-δ
particles was unchanged as seen in TEM image of Pt/3DOM-Ce0.8Bi0.2O2-δ (Figure S5). At a higher
magnification, Pt nanocrystallites dispersed on the surface of carrier are visible as dark spots in
920 910 900 890 880
Ce3+: 12.9% Ce3+: 14.9% Ce3+: 16.5%
Intensity (a.u.)
x=0 x=0.1 x=0.2
Ce3+: 14.4%
x=0.3
Ce3+
u''
u''' u0
u' u v''' v''
(a)
v v' v 0Binding energy (eV)
534 532 530 528 526
(b)
x=0.1 x=0.2
Intensity (a.u.)
O: 22.7% O: 25.7% O: 33.3% O: 26.7%
x=0 x=0.3
TEM images (Figure 5a). The particle size distribution, measured from 130 randomly chosen Pt nanoparticles, is quite narrow with the average diameter of about 2.1 nm. The HRTEM image of Pt/3DOM-Ce0.8Bi0.2O2-δ catalyst in Figure 5b shows lattice fringes corresponding to the (111)
planes of cubic CeO2 and Pt crystals. It is noticed that the oxide wall is polycrystalline, constructed
with Bi-doped CeO2 nanocrystals, which is consistent with the observation of the wide XRD peaks.
The XRD patterns of these Pt/3DOM-Ce1-xBixO2-δ catalysts are shown in Figure S6. All the
diffraction peaks derived from CeO2-like face-centered cubic unit cell were still distinct after the
deposition of Pt nanoparticles. No diffraction peaks derived from Pt particles can be observed because of their nanoscale particle sizes.
[image:13.612.110.510.345.546.2]
Figure 5. (a) TEM and (b) HRTEM images of Pt/3DOM-Ce0.8Bi0.2O2-δ catalyst. The inset in (a) is
The obtained Pt/3DOM-Ce1-xBixO2-δ catalysts were investigated by XPS to reveal electron
transfer from Pt to carrier. As seen in Figure 6a, the proportion of Ce3+ in Pt/3DOM-Ce
1-xBixO2-δ
significantly increases compared with 3DOM-Ce1-xBixO2-δ, which means that the Ce4+ ions are
further reduced to Ce3+ with the deposition of Pt. Figure 6b shows the Pt 4f spectra from
Pt/3DOM-Ce1-xBixO2-δ. The deconvoluted peaks with binding energies of 70.6~70.7 and 73.9~74.0 eV can
be attributed to Pt 4f7/2 and Pt 4f5/2 of Pt0, respectively. The peaks assigned to Pt2+ appear at 71.8
and 75.2 eV. It can be clearly observed that Pt mainly exists as Pt0 in these samples. But about
26.9-34.3% of Pt are oxidized to Pt2+. Taking into account the further reduction of Ce4+ and the
partial oxidation of Pt in Pt/3DOM-Ce1-xBixO2-δ catalysts, the charge transfer from Pt to
3DOM-Ce1-xBixO2-δ can be confirmed. In addition, from the Bi 4f XPS spectra of 3DOM-Ce0.8Bi0.2O2-δ
and Pt/3DOM-Ce0.8Bi0.2O2-δ (Figure S7), it can be seen that the Bi cations are in the Bi3+ state.
[image:14.612.136.488.401.646.2]
Figure 6. (a) Ce 3d and (b) Pt 4f XPS spectra of the Pt/3DOM-Ce1-xBixO2-δ with x from 0 to 0.3.
920 910 900 890 880
Ce3+: 25.7%
Ce3+
Intensity (a.u.)
Ce3+: 29.7%
x=0 x=0.1 x=0.2 x=0.3
Ce3+: 18.9%
(a)
Binding energy (eV)
Ce3+: 18.2%
80 78 76 74 72 70
Pt2+: 30.5%
(b)
Intensity (a.u.)
Pt2+: 34.3%
Pt2+
Pt0 Pt0
x=0.2 x=0.3
Pt2+: 27.8%
Pt2+: 26.9%
x=0 x=0.1
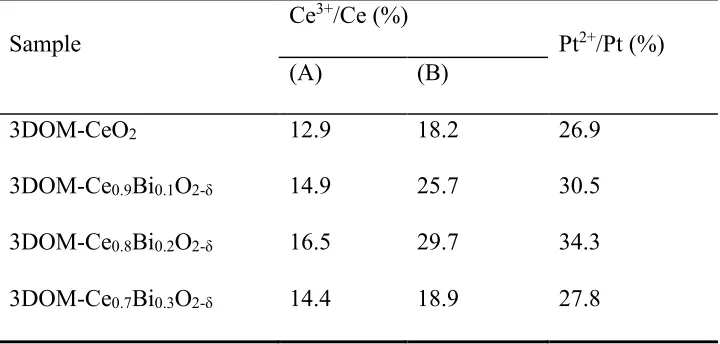
The percentages of Ce3+ in 3DOM-Ce
1-xBixO2-δ before and after the deposition of Pt, and the
relative abundances of Pt2+ in Pt/3DOM-Ce
1-xBixO2-δ catalysts are listed in Table 1. It is interesting
to see that Pt/3DOM-Ce0.8Bi0.2O2-δ with the highest amount of Pt2+ exhibits the largest extra
increase of Ce3+ induced by the deposition of Pt, suggesting the largest amount of charge transfer
from Pt to carrier, in spite of the highest amount of Ce3+ also exists in this catalyst. This observation
is of great interest, since we normally think that the existence of Ce3+ would imply that charge
[image:15.612.127.487.349.521.2]transfer from Pt to carrier is inhibited.[1,42]
Table 1. The concentrations (%) of Ce3+ and Pt2+ cations in the surface region of 3DOM-Ce
1-xBixO2-δ and Pt/3DOM-Ce1-xBixO2-δ detected by XPS. (A) Before and (B) after deposition of Pt.
Sample
Ce3+/Ce (%)
Pt2+/Pt (%)
(A) (B)
3DOM-CeO2 12.9 18.2 26.9
3DOM-Ce0.9Bi0.1O2-δ 14.9 25.7 30.5
3DOM-Ce0.8Bi0.2O2-δ 16.5 29.7 34.3
3DOM-Ce0.7Bi0.3O2-δ 14.4 18.9 27.8
3.3. Effect of Bi-doping on structural properties.
The appearance of the maximum concentrations of Ce3+ and Pt2+ cations in the 20% Bi-doped
sample indicates that the doping effect on the electronic structure of CeO2 is not monotonous.
Although there are several differently coordinated oxygen sites on the crystal surface, such as M-O-M, M-O-M2, and M2-O-M2 (M = Ce or Bi), to simplify the discussion, we only use the four
octa-coordinated Ce4+ is replaced by a hexa-coordinated Bi3+, two oxygen vacancies will be generated
around this Bi3+, forming a cluster of (Ce-)3-Bi-(-Ce)
3, as shown in Figure S8a. Around the
oxygen vacancy, Bi3+ maintains its original oxidation state and Ce4+ would be reduced to Ce3+,
forming a cluster of Bi3+-(-Ce3+)
3. The actual oxidation state of a cerium cation depends on its
total coordination number of oxygen. It is obvious that the concentration of Ce3+ would be
increased with the Bi-doping until formation of stable Bi--Bi or tetrahedral (Bi-)2(-Bi)2 clusters.
When the Bi-doping level is low, all the Bi3+ cations are separated by Ce. In other words, no
Bi-O-Bi or Bi--Bi connection forms. The shortest possible distance between two Bi cations is the same as the fluorite unit cell parameter. The theoretical maximum Bi substitution in such a structure is 25% according to the ordered model shown in Figure S8b. In the range of Bi-doping below 25%, including Ce0.9Bi0.1O2-δ and Ce0.8Bi0.2O2-δ, part of Bi3+ cations replace six coordinated
Ce3+ without breaking the neutrality and rest of Bi3+ cations replace eight coordinated Ce4+ plus
two associated O2, leading to breaking the local charge balance. To meet the requirement of
neutrality at the Bi-(-Ce)3 sites, some Ce4+ will be reduced to Ce3+. Consequently, with the
Bi-doping, not only the number of oxygen vacancies, but also the number of Ce3+ would increase.
When the content of Bi3+ is further increased to 30%, two or more Bi3+ would link to the same
oxygen vacancy, forming Bi--Bi and even larger Bi-rich clusters. This so called ‘like with like’ phenomenon has been often found in fluorite-type solid solutions.[43] The amount of asymmetrical
Bi-(-Ce)3 sites would decrease, while a decrease of the concentration of holes in the Pt
nanoparticles was observed.
Compared with the symmetrical (Ce-)2(-Ce)2 sites, the asymmetrical Bi-(-Ce)3 sites would
easily gain oxygen atoms to form Bi-O(-Ce)3, and easily release oxygen anions to return to Bi-
reduction of oxygen. Therefore, Pt/3DOM-Ce0.8Bi0.2O2-δ with the largest amount of Bi-(-Ce)3
[image:17.612.187.441.155.358.2]sites exhibits the highest ability of electron transfer from Pt.
Figure 7. The H2-TPR results of the 3DOM-Ce1-xBixO2-δ specimens with x from 0 to 0.3.
The difference between the oxygen sites in Bi-doped CeO2, e.g. Bi-(-Ce)3 and the sites in
pure CeO2, e.g. (Ce-)2(-Ce)2 can be experimentally confirmed by the H2-TPR of 3DOM-Ce 1-xBixO2-δ, as shown in Figure 7. With the Bi3+-doping, the reduction peaks of 3DOM-Ce1-xBixO2-δ
are shifted from 509 °C to at least two lower-temperature regions centered at ca. (I) 345 °C and (II) 465 °C, indicating the formation of new types of redox sites and the interaction between CeO2
and the dopant ions. The reduction peaks located at 345 °C should be attributed to oxygen removal from the redox sites associated with Bi3+, including Bi-O(-Ce)
3 clusters. The reduction peaks
centered at 465 °C can be derived from the redox sites associated with Ce4+, which moved from
509 °C to lower-temperature region because of the interaction between Ce4+ and the doped Bi3+ ions. The related hydrogen consumption data have been listed in Table S2. The results show
200 300 400 500 600
x=0.3
x=0.2
x=0.1
x=0
H 2
Consumptio
n (a.u.)
Temperature (°C) 345
465
unambiguously that the Bi-doping not only decreases the reduction temperature, but also increases the H2 consumption in comparison with pure CeO2, suggesting a better redox property.
3.4. DFT calculation of the asymmetrical oxygen vacancy sites.
In order to further prove the excellent oxygen adsorption ability and oxygen release ability of these asymmetrical Bi-(-Ce)3 sites compared with symmetrical (Ce-)2(-Ce)2 sites, the
adsorption energy of oxygen (Eads) and the formation energy of oxygen vacancy [Ef(Ov)] of these
sites were calculated. On the surface of CeO2(111), the coordination number of oxygen in these
oxygen vacancy sites is three. Thus, Bi-(-Ce)2 and Ce-(-Ce)2 should be the main existence forms
[image:18.612.141.470.347.593.2]of these oxygen vacancy sites.
Figure 8. (a) The geometries of O2 adsorbed on Bi-(-Ce)2 and Ce-(-Ce)2 sites. The relevant
bond lengths are marked. (b) DFT-calculated structure for Ef(Ov) on Bi-O(-Ce)2 and Ce-O(-Ce)2
sites. The Ce4+, O, Bi are colored by grey, red and purple, respectively. The circled O atoms in
The Eads of these sites were calculated as Eads = EA/S - (EA + ES), where EA, ES and EA/S represent for the energy of adsorbed species, the energy of free substrate and total energy of
adsorbate−substrate system, respectively. The geometrical structures of O2 adsorbed into
asymmetrical Bi-(-Ce)2 or symmetrical Ce-(-Ce)2 sites are shown in Figure 8(a), the related Eads
data are listed in Table 2. The O2 molecule was adsorbed at the hollow site of Bi-(-Ce)2 or Ce-(-Ce)2. It can be found that the adsorption of O2 on these oxygen vacancy sites is an exothermic
process. Although a lower Eads of O2 on the Ce--(Ce)2 sites is obtained, the Eads of O2 on the Bi--(Ce)2 sites is also very low (-4.61 eV), indicating that O2 is easily adsorbed on both oxygen
vacancy sites. On the other hand, the bond length of adsorbed oxygen molecule on the Bi-O-(Ce)2
sites is relatively shorter and the Bi-O and Ce-O bond lengths are significantly longer than those in the Ce-O-(Ce)2 sites, as seen in Figure 8(a). It implies that the oxygen molecules on the
Bi-O-(Ce)2 sites are less stable and tend to leave as activated pieces. The charge imbalance at the Bi
[image:19.612.151.461.551.639.2]cations introduced by an extra Bi-O bond further increases the instability of the oxygen.
Table 2. The calculated adsorption energy of oxygen and the formation energy of oxygen vacancy on different sites of CeO2(111) surface
Energy Bi-(-Ce)2 Ce-(-Ce)2
Eads (eV) -4.61 -6.83
The Ef(Ov) of these sites (Figure 8b) was calculated through the formula of Ef(Ov) = Edef –
Efree + 1
2
EO
2, in which Edef, Efree and EO2 are the energies of the defective structure with an oxygen vacancy, the perfect system and the free molecular oxygen, respectively.[44] The obtained Ef(Ov)
results are also listed in Table 2. It can be found that the Ef(Ov) of Ce-O(-Ce)2 site is 1.67 eV,
which is significantly higher than that of asymmetrical Bi-O(-Ce)2 site (0.70 eV). This result
indicates that the oxygen atoms in the asymmetrical Bi-O(-Ce)2 sites are more active and easily to
be released from these sites. The DFT calculation results further prove the notably enhanced redox property of these asymmetrical oxygen vacancy sites compared with symmetrical sites in pure CeO2-.
3.5. Effect of Bi-doping on catalytic performance.
The influence of Bi-doping in Pt/3DOM-Ce1-xBixO2-δ on catalytic performance was evaluated
in the aerobic oxidation of HMF toward FDCA at ambient pressure (Figure 9). The final results after 10 h reaction over these catalysts and the calculated turnover frequency (TOF) values are listed in Table 3.
0 2 4 6 8 10
0 20 40 60 80 100
(a)
%
Time (h) 0 2 4 6 8 10
0 20 40 60 80 100
(b)
%
Figure 9. Reaction profiles for the oxidation of HMF on Pt/3DOM-Ce1-xBixO2-δ catalysts, when
(a) x = 0, (b) x = 0.1, (c) x = 0.2, (d) x = 0.3. Reaction conditions: nHMF/nPt = 100, nHMF/nNaHCO3 =
0.25, 90 °C, with O2 bubbling (70 mL min1).
Table 3. Catalytic performance of Pt/3DOM-Ce1-xBixO2-δ catalysts for the aerobic oxidation of
HMF[a]
Entry Catalyst HMF Conv.
(%)
Yield (%) Carbon Balance
(%)
TOF value[b]
(min1)
FDCA FFCA HMFCA
1 Pt/3DOM-CeO2 100 73 14 2 89 3.24
2 Pt/3DOM-Ce0.9Bi0.1O2-δ 100 93 6 1 >99 4.24
3 Pt/3DOM-Ce0.8Bi0.2O2-δ 100 >99 0 0 >99 9.27
4 Pt/3DOM-Ce0.7Bi0.3O2-δ 100 76 14 6 96 7.00
5 Pt/3DOM-Ce0.5Bi0.5O2-δ 100 66 14 5 85 ----
6 3DOM-CeO2 40 0 0 2 62 ----
7 3DOM-Ce0.8Bi0.2O2-δ 50 4 3 2 59 ----
[a] Reaction conditions: n
HMF/nPt = 100, nHMF/nNaHCO3 = 0.25, 90 °C, 10 h, O2 bubbling (70 mL
min1).
0 2 4 6 8 10
0 20 40 60 80 100
(c)
%Time (h) 0 2 4 6 8 10
0 20 40 60 80 100
(d)
% Time (h)0 2 4 6 8 10
0 20 40 60 80 100
Conversion of HMF Carbon Balance
Yield of HMFCA Yield of FFCA Yield of FDCA
(a)
Con
v./Yield (%)
[image:21.612.78.534.463.672.2]Pt dispersion was determined by CO chemisorption.
TOF (min−1) =ConvHMF(%) × (𝑛HMF/𝑛Pt)
time(min) × Pt dispersion
As shown in Figure 9 and Table 3, all of these Pt/3DOM-Ce1-xBixO2-δ catalysts exhibited good
catalytic activity for the aerobic oxidation of HMF. In the first 2 h, FFCA was the main intermediate product in these reaction system, indicating that the conversion from FFCA to FDCA is the rate determining step of the reaction over Pt/3DOM-Ce1-xBixO2-δ, which can be clearly
observed from the kinetic simulation results according to the reported methods [46,47] based on these
reaction data (as shown in Figure S9), and was also found in relevant literatures on Pt-based catalysts[19, 48, 49]. It is very different with Au or Pd catalyzed reaction[17,18,20,21,22,45], in which the
dehydrogenation of hydroxymethyl group of HMFCA to FFCA is the rate determining step. Among these Pt/3DOM-Ce1-xBixO2-δ catalysts, Pt/3DOM-CeO2 exhibited relatively poor catalytic
performance. When 10% of cerium were replaced by Bi3+, the catalytic behavior of the catalyst
was enhanced significantly. The highest yield of FDCA was achieved with 20% Bi-doping. When the Bi-doping level increased to 30%, the yield of FDCA decreased to 76%. Further increasing the Bi-doping level to 50%, the obtained Pt/3DOM-Ce0.5Bi0.5O2-δ catalyst exhibited the
lowest yield of FDCA among these Pt/3DOM-Ce1-xBixO2-δ catalysts (entry 5, Table 3). In addition,
as shown in Table 3, the carbon balance values for the reactions over Pt/3DOM-Ce0.9Bi0.1O2-δ and
Pt/3DOM-Ce0.8Bi0.2O2-δ (>99%) are notably higher than those over Pt/3DOM-Ce0.7Bi0.3O2-δ
(96%), Pt/3DOM-CeO2 (89%) and Pt/3DOM-Ce0.5Bi0.5O2-δ (85%), which can be attributed to the
faster conversion of intermediate products to relatively stable FDCA over Pt/3DOM-Ce0.9Bi0.1O 2-δ and Pt/3DOM-Ce0.8Bi0.2O2-δ. It can be also observed from Table 3, the TOF value of
Compared with ever reported catalysts as listed in Table S3, Pt/3DOM-Ce0.8Bi0.2O2-δ should be a
promising catalyst under mild reaction conditions. Although the same optimized doping level of Bi3+ was found in Pt/3DOM-Ce
1-xBixO2-δ catalysts compared with the ever reported
literatures,[21,23] an obviously different promoting mechanism of Pt/3DOM-Ce
1-xBixO2-δ compared
with Pt/3DOM-CeO2 was proposed in this work. We believe this Bi-doping effect associates
closely to the newly created asymmetrical oxygen vacancy site of Bi-(-Ce)3 as discussed above.
3.6. Role of the asymmetrical oxygen vacancy site in promoting electron transfer and
catalytic performance
In order to investigate the electronic interaction between the sites of oxygen vacancy and the Pt nanoparticles, a calculation model with a tetrahedral Pt4 cluster adsorbed on Bi-(-Ce)2, Ce-
(-Ce)2 and Ce-O(-Ce)2 sites on the surface of CeO2(111), as described in Figure 10, was employed.
The Bader charge analysis was carried out to study the electron density of Pt4 cluster [50,51] and the
results are listed in Table 4. Bader valence of Pt atoms adsorbed on Ce-based metal oxide can indicate the directionality and the quantity of electron transfer.[52] It can be seen that the Bader
valence of Pt atoms on Bi-(-Ce)2, Ce-(-Ce)2, and Ce-O(-Ce)2 decreased by -0.71|e|, -0.62|e|, and
-0.76|e|, respectively. The electro-positivity of Pt4 cluster indicates the electron transfer from Pt4 cluster to the carrier, which is consistent with the results of XPS characterization. Moreover, compared with the symmetrical Ce-(-Ce)2 sites, Pt4 cluster adsorbed on asymmetrical Bi-(-Ce)2
sites exhibited larger amount of electron transfer, although the strongest charge transfer took place on Pt4/Ce-O(-Ce)2 sites from Bader charge analysis.
indicates that Pt nanoparticles are likely to be preferentially adsorbed on the oxygen vacancy sites. From the results of DFT calculation, the conclusion can be deduced that the existence of asymmetrical Bi-(-Ce)3 oxygen vacancy sites can effectively stabilize Pt nanoparticles and
[image:24.612.134.487.189.479.2]promote the electron transfer from Pt to carrier.
Figure 10. Geometries of (a) Pt4/Ce-(-Ce)2, (b) Pt4/Bi-(-Ce)2 and (c) Pt4/Ce-O(-Ce)2.
Table 4. The Bader charge and adsorption energy of Pt4 cluster on Bi-(-Ce)2, Ce-(-Ce)2 or
Ce-O(-Ce)2 sites of CeO2(111) surface.
Pt4/Bi-(-Ce)2 Pt4/Ce-(-Ce)2 Pt4/Ce-O(-Ce)2
Bader valence |e| -0.71 -0.62 -0.76
Ead (eV) -7.15 -7.67 -4.92
Pt4/Ce-□(-Ce)2 Pt4/Bi-□(-Ce)2
(a)
(b)
Pt4/Ce-O(-Ce)2
[image:24.612.98.516.606.693.2]However, the dehydrogenation reactions of HMF on the surface of Pt nanoparticles with the assistance of OH anions would leave excess electrons on Pt nanoparticles.[53,54] Therefore, a
continuous electron transfer from Pt to carrier may exist on these Pt/3DOM-Ce1-xBixO2-δ catalysts
under the aerobic oxidation conditions. It has been known that the oxygen vacancies in CeO2
-based materials can be active sites for oxygen activation. The adsorbed O2 can be activated and
converted to superoxo- or peroxo- oxygen (i.e. O2 or O22) as described in eq. (1)-(3). The O22
can be dissociated to monatomic O, and further reduced to lattice oxygen (O2) at these sites.[55]
On the other hand, these active oxygen species can leave the crystals, restoring the oxygen vacancies, by reacting with H2O to form H2O2 and OH (eq. 4). These O2 activation reactions
occurred at CeO2 surface can consume a large amount of electrons. Consequently, this process
should be the real driving force of continuous electron transfer from Pt to carrier.
O2 + Ce3+→ O2+ Ce4+ (1)
Ce4+ + e→ Ce3+ (2)
O2+ e→ O22 (3)
O22+ 2H2O → H2O2 + 2OH (4)
Following the above discussions, we are now able to propose a mechanism of Bi-doping on the promoting electron transfer and catalytic performance for the aerobic oxidation of HMF, as illustrated in Figure 11. In this schematic, only tetrahedral clusters, Bi-O(-Ce)3 were used to
Figure 11. Top: Plausible reaction mechanism of HMF oxidation over Pt/3DOM-Ce1-xBixO2-δ
catalysts. Surface oxygen anions are not shown for a simplicity. Bottom: A schematic drawing to show a process of oxygen activation at a site of Bi-(-Ce)3.
The principal role of the Bi-doping in the improvement of catalytic activity is to modify the properties of the oxygen vacancies, allowing oxygen easy come, easy go. When the oxygen is removed, the Bi-(-Ce)3 cluster has a special electronic structure and an interesting improved
redox property. Let us start with Bi3+-(-Ce3+)
3 (Figure 11a). The vacancy is favorable to Bi3+ as
far as the coordination number is considered, but not to cerium cations, which prefers eight coordination. Therefore, it is still easy to adsorb oxygen. The adsorbed oxygen gains electrons from Ce3+ cations, forming a cluster of Bi3+-O(-Ce4+)
[image:26.612.193.428.69.335.2]The occupation of the vacancy favors Ce4+, but generates a too high coordination number for
Bi3+, and an unbalanced charge at Bi3+. The oxygen intends to leave as an anion, reacting with
H2O, leading to the formation of a Bi3+-(-Ce4+)3 cluster (Figure 11c). At this stage, electrons may
transfer from the Pt nanoparticles to reduce the Ce4+ cations to stabilize the cluster, returning back
to Bi3+-(-Ce3+)
3. This three-step circle demonstrates how the oxygen vacancies activate oxygen
from the solution and how a potential of electron transfer from Pt to the clusters is created.
Scheme 1. Proposed mechanism for the oxidation reactions from HMF to FDCA on a Pt/3DOM-CexBi1-xO2-δ catalyst.
On the other hand, 3DOM-CeO2 and 3DOM-Ce0.8Bi0.2O2-δ in absence of Pt nanoparticles
exhibit extremely lower catalytic performance for HMF oxidation as listed in Table 3 (entries 6 and 7). About 40%~50% of HMF converted to side products through ketonization and condensation reactions.[17,56] This can be understood that the Bi3+-O(-Ce4+)
3 clusters cannot be
self-reduced to Bi3+-O(-Ce3+)
3 without receiving electron from other parts of the particle. Therefore,
the aerobic oxidation of HMF must occur on the Pt nanoparticles, leaving electrons there. The electrons are then donated to the Bi3+-O(-Ce4+)
3 clusters in the carrier. The clusters play
nanoparticles have a potential to attract OH anions and HMF molecules, resulting in the
continuous oxidation of HMF towards FDCA through dehydrogenation reactions on the surface of Pt nanoparticles. A more detailed process of the reactions is depicted in Scheme 1.
3.7 Effect of 3DOM structure.
In order to investigate the influence of 3DOM structure on the catalytic performance of these catalysts, the nanosized Pt/Ce1-xBixO2-δ catalysts were also evaluated in the oxidation of HMF
under the same reaction conditions. The reaction results are shown in Figure S10. It can be found from Figure 9 and Figure S10, the Pt/3DOM-Ce1-xBixO2-δ catalysts exhibit notably improved
catalytic performance in the oxidation of HMF compared with Pt/Ce1-xBixO2-δ. Especially for the
yield of FDCA, the 3DOM samples show a significantly higher selectivity than the non-porous samples when the Bi-doping levels are the same. For instance, as seen in Figures 9c and S10c, although comparable HMF conversions were obtained over Pt/3DOM-Ce0.8Bi0.2O2-δ and
Pt/Ce0.8Bi0.2O2-δ catalysts, an obviously increased FDCA yield was achieved by the former for 10
h (100%) compared with the latter (78%). The improved FDCA yield can be attributed to the 3DOM structure of these catalysts. Firstly, the surface of the ordered macroporous structure may contain more defects created during the calcination to decompose PMMA, and become more suitable to house active Pt nanoparticles. Secondly, the inter-connected and ordered macroporous structure can significantly facilitate the mass transfer of the reactants and products and, therefore, can promote the multi-step oxidation reaction of HMF.
3.8 Reusability of the catalyst.
The stability of the Pt/3DOM-Ce1-xBixO2-δ catalysts in the aerobic oxidation of HMF was
investigated using Pt/3DOM-Ce0.8Bi0.2O2-δ as a model catalyst. After each oxidation run, the
order to detect the actual stability of the catalyst, the reaction time of 6 h in each run was chosen, because the oxidation reaction was still in progress at this reaction time. The results of five consecutive cycle experiments are shown in Figure 12. It can be seen that Pt/3DOM-Ce0.8Bi0.2O 2-δ exhibits excellent reusability in the aerobic oxidation of HMF. 100% of HMF conversion and
90% of FDCA yield are achieved in the fifth cycle, which are comparable with the results in the first cycle (100% of HMF conversion and 89% of FDCA yield). The reaction solution catalyzed by Pt/3DOM-Ce0.8Bi0.2O2-δ was detected by ICP-AES after centrifuging for the separation of
catalyst. Only 0.06% of Pt leaching was observed in the reaction solution of the first cycle, and no Pt leaching can be detected in the reaction solution of the second cycle. This indicates that the Pt/3DOM-Ce1-xBixO2-δ catalysts obtained in the present work are stable and can be reused at least
[image:29.612.179.436.401.605.2]five times without any notable loss in catalytic performance.
Figure 12. Recycling tests of Pt/3DOM-Ce0.8Bi0.2O2-δ for the aerobic oxidation of HMF.
1 2 3 4 5
0 20 40 60 80
100 HMF Conv. FDCA Yield
H
M
F
C
onv
./
F
D
C
A
Yield
(%)
4. Conclusion
In summary, the principal role of the Bi-doping in the Pt/3DOM-Ce1-xBixO2-δ catalysts for the
aerobic oxidation of HMF is to form an asymmetric environment of some oxygen vacancies, such as Bi-(-Ce)3. The chief advantage of these asymmetric clusters, in comparison with symmetric
clusters, e.g. (Ce-)2(-Ce)2 or the clusters containing more than one Bi3+ cation, is that both the
occupied and unoccupied states at the oxygen sites in these clusters are metastable, making oxygen easy come, easy go. More importantly, in the oxygen adsorption/desorption circle at these clusters, oxygen molecules are reduced by taking electrons from the Ce3+ cations in the clusters, increasing
the potential of electron transfer from the Pt nanoparticles to these clusters. It is obvious that the Bi-doping effect on the promotion of catalytic properties is not simply increasing the number of oxygen vacancies, but more importantly modifying the environment of the oxygen vacancies. We anticipate that this work can shed light on the future investigation of electron transfer between catalytic nanoparticles and oxide substrates, and relevant mechanisms of many other catalytic processes.
Acknowledgements
References:
[1] Y. Lykhach, S. M. Kozlov, T. Skála, A. Tovt, V. Stetsovych, N. Tsud, F. Dvořák, V. Johánek, A. Neitzel, J. Mysliveček, S. Fabris, V. Matolín, K. M. Neyman, J. Libuda. Counting Electrons on Supported Nanoparticles. Nat. Mater. 15 (2016) 284289.
[2] A. Bruix, J. A. Rodriguez, P. J. Ramírez, S. D. Senanayake, J. Evans, J. B. Park, D. Stacchiola, P. Liu, J. Hrbek, F. Illas. A New Type of Strong Metal−support Interaction and the Production of H2 through the Transformation of Water on Pt/CeO2(111) and Pt/CeOx/TiO2(110) Catalysts. J. Am. Chem. Soc. 134 (2012) 89688974.
[3] C. T. Campbell. Electronic Perturbations. Nat. Chem. 4 (2012) 597598.
[4] T. Montini, M. Melchionna, M. Monai, P. Fornasiero. Fundamentals and Catalytic Applications of CeO2-Based Materials. Chem. Rev. 116 (2016) 59876041.
[5] J. Ke, J. W. Xiao, W. Zhu, H. C. Liu, R. Si, Y. W. Zhang, C. H. Yan. Dopant-Induced Modification of Active Site Structure and Surface Bonding Mode for High-performance Nanocatalysts: CO Oxidation on Capping-free (110)-oriented CeO2:Ln (Ln = La−Lu)
Nanowires. J. Am. Chem. Soc. 135 (2013) 1519115200.
[6] H. Y. Kim, H. M. Lee, G. Henkelman. CO Oxidation Mechanism on CeO2-supported Au
Nanoparticles. J. Am. Chem. Soc. 134 (2012) 15601570.
[7] E. Aneggi, D. Wiater, C. de Leitenburg, J. Llorca, A. Trovarelli. Shape-dependent Activity of Ceria in Soot Combustion. ACS Catal. 4 (2014) 172181.
[8] Y. C. Wei, J. Liu, Z. Zhao, A. J. Duan, G. Y. Jiang. The Catalysts of Three-dimensionally Ordered Macroporous Ce1-xZrxO2-supported Gold Nanoparticles for Soot Combustion: The
[9] M. J. Beier, T. W. Hansen, J.-D. Grunwaldt. Selective Liquid-phase Oxidation of Alcohols Catalyzed by a Silver-based Catalyst Promoted by the Presence of Ceria. J. Catal. 266 (2009) 320330.
[10]M. Tamura, K. Tomishige. Redox Properties of CeO2 at Low Temperature: The Direct
Synthesis of Imines from Alcohol and Amine. Angew. Chem. Int. Ed. 54 (2015) 864867. [11]M. E. Zakrzewska, E. Bogel-Łukasik, R. Bogel-Łukasik. Ionic Liquid-mediated Formation of
5-Hydroxymethylfurfural—A Promising Biomass-derived Building Block. Chem. Rev. 111 (2011) 397417.
[12]R.-J. van Putten, J. C. van der Waal, E. de Jong, C. B. Rasrendra, H. J. Heeres, J. G. de Vries. Hydroxymethylfurfural, A Versatile Platform Chemical Made from Renewable Resources.
Chem. Rev. 113 (2013) 14991597.
[13]G. Yong, Y. Zhang, J. Y. Ying. Efficient Catalytic System for the Selective Production of 5-Hydroxymethylfurfural from Glucose and Fructose. Angew. Chem. Int. Ed. 47 (2008) 93459348.
[14]Z. Zhang, K. Deng. Recent Advances in the Catalytic Synthesis of 2,5-Furandicarboxylic Acid and Its Derivatives. ACS Catal. 5 (2015) 65296544.
[15]X. Zhang, K. Wilson, A. F. Lee. Heterogeneously Catalyzed Hydrothermal Processing of C5−C6 Sugars. Chem. Rev. 116 (2016) 1232812368.
[16]A. J. J. E. Eerhart, A. P. C. Faaij, M. K. Patel. Replacing Fossil Based PET with Biobased PEF; Process Analysis, Energy and GHG Balance. Energy Environ. Sci. 5 (2012) 64076422. [17]O. Casanova, S. Iborra, A. Corma. Biomass into Chemicals: Aerobic Oxidation of
5-Hydroxymethyl-2-furfural into 2,5-Furandicarboxylic Acid with Gold Nanoparticle Catalysts.
[18]Z. Zhang, J. Zhen, B. Liu, K. Lv, K. Deng. Selective Aerobic Oxidation of the Biomass-derived Precursor 5-Hydroxymethylfurfural to 2,5-Furandicarboxylic Acid under Mild Conditions over a Magnetic Palladium Nanocatalyst. Green Chem. 17 (2015) 13081317. [19]X. Han, L. Geng, Y. Guo, R. Jia, X. Liu, Y. Zhang, Y. Wang. Base-free Aerobic Oxidation of
5-Hydroxymethylfurfural to 2,5-Furandicarboxylic Acid over a Pt/C-O-Mg Catalyst. Green Chem. 18 (2016) 15971604.
[20]S. Albonetti, A. Lolli, V. Morandi, A. Migliori, C. Lucarelli, F. Cavani. Conversion of 5-Hydroxymethylfurfural to 2,5-Furandicarboxylic Acid over Au-based Catalysts: Optimization of Active Phase and Metal–support Interaction. Appl. Catal. B: Environ. 163 (2015) 520530. [21]Z. Miao, Y. Zhang, X. Pan, T. Wu, B. Zhang, J. Li, T. Yi, Z. Zhang, X. Yang. Superior Catalytic Performance of Ce1-xBixO2-δ Solid Solution and Au/Ce1-xBixO2-δ for
5-Hydroxymethylfurfural Conversion in Alkaline Aqueous Solution. Catal. Sci. Technol. 5 (2015) 13141322.
[22]A. Lolli, R. Amadori, C. Lucarelli, M. G. Cutrufello, E. Rombi, F. Cavani, S. Albonetti. Hard-template Preparation of Au/CeO2 Mesostructured Catalysts and Their Activity for the
Selective Oxidation of 5-Hydroxymethylfurfural to 2,5-Furandicarboxylic Acid. Micropor. Mesopor. Mater. 226 (2016) 466475.
[23]Z. Miao, T. Wu, J. Li, T. Yi, Y. Zhang, X. Yang. Aerobic Oxidation of 5-Hydroxymethylfurfural (HMF) Effectively Catalyzed by a Ce0.8Bi0.2O2−δ Supported Pt
Catalyst at Room Temperature. RSC Adv. 5 (2015) 1982319829.
[24]K. Yu, C. Zhang, Y. Chang, Y. Feng, Z. Yang, T. Yang, L.-L. Lou, S. Liu. Novel Three-dimensionally Ordered Macroporous SrTiO3 Photocatalysts with Remarkably Enhanced
[25]G. Kresse, J. Furthmüller. Efficiency of ab-initio Total Energy Calculations for Metals and Semiconductors Using a Plane-wave Basis Set. Comp. Mater. Sci. 6 (1996) 1550.
[26]G. Kresse, J. Furthmüller. Efficient Iterative Schemes for ab initio Total-energy Calculations Using a Plane-wave Basis Set. Phys. Rev. B. 54 (1996) 1116911186.
[27]J. P. Perdew, Y. Wang. Accurate and Simple Analytic Representation of the Electron-gas Correlation Energy. Phys. Rev. B. 45(1992) 1324413249.
[28]Z. Yang, Q. Wang, S. Wei. D. Ma, Q. Sun. The Effect of Environment on the Reaction of Water on the Ceria(111) Surface: A DFT+U Study. J. Phys. Chem. C. 114 (2010) 1489114899.
[29]C. Loschen, J. Carrasco, K.M. Neyman, F. Illas. First-principles LDA+U and GGA+U Study of Cerium Oxides: Dependence on the Effective U Parameter. Phys. Rev. B. 75 (2007) 5115. [30]M. Nolan, S. Grigoleit, D. C. Sayle, S. C. Parker, G. W. Watson. Density Functional Theory
Studies of the Structure and Electronic Structure of Pure and Defective Low Index Surfaces of Ceria. Surf. Sci. 576(2005) 217229.
[31]S. Fabris, S. de Gironcoli, S. Baroni, G. Vicario, G. Balducci. Taming Multiple Valency with Density Functionals: A Case Study of Defective Ceria. Phys. Rev. B. 71 (2005) 11021105. [32]W. Z. Zhou. Defect Fluorite–related Superstructures in the Bi2O3–V2O5 System. J. Solid State
Chem. 76 (1988) 290300.
[34]S. Ramana, B. G. Rao, P. Venkataswamy, A. Rangaswamy, B. M. Reddy. Nanostructured Mn-doped Ceria Solid Solutions for Efficient Oxidation of Vanillyl Alcohol. J. Mol. Catal. A: Chem. 415 (2016) 113121.
[35]Y. Zhang, Y. Yang, J. Zheng, W. Hua, G. Chen. Effects of Oxidizing Additives on Optical Properties of Bi2O3–B2O3–SiO2 Glasses. J. Am. Ceram. Soc. 91 (2008) 34103412.
[36]F. Schröder, N. Bagdassarov, F. Ritter, L. Bayarjargal. Temperature Dependence of Bi2O3
Structural Parameters Close to the α–δ Phase Transition. Phase Transit. 83 (2010) 311325. [37]M. Guo, J. Lu, Y. Wu, Y. Wang, M. Luo. UV and Visible Raman Studies of Oxygen Vacancies
in Rare-earth-doped Ceria. Langmuir 27 (2011) 38723877.
[38]M. A. Henderson, C. L. Perkins, M. H. Engelhard, S. Thevuthasan, C. H. F. Peden. Redox Properties of Water on the Oxidized and Reduced Surfaces of CeO2(111). Surf. Sci. 526 (2003)
118.
[39]L. Óvári, S. Krick Calderon, Y. Lykhach, J. Libuda, A. Erdőhelyi, C. Papp, J. Kiss, H.-P. Steinrück. Near Ambient Pressure XPS Investigation of the Interaction of Ethanol with Co/CeO2(111). J. Catal. 307 (2013) 132139.
[40]S. Zhan, H. Zhang, Y. Zhang, Q. Shi, Y. Li, X. Li. Efficient NH3-SCR Removal of NOx with
Highly Ordered Mesoporous WO3(χ)-CeO2 at Low Temperatures. Appl. Catal. B: Environ.
203 (2017) 199209.
[41]N. Jabeen, Q. Xia, S. V. Savilov, S. M. Aldoshin, Y. Yu, H. Xia. Enhanced Pseudocapacitive Performance of α-MnO2 by Cation Preinsertion. ACS Appl. Mater. Inter. 8 (2016)
3373233740.
[43]W. Z. Zhou. Defect Fluorite Superstructures in the Bi2O3–WO3 System. J. Solid State Chem.
108 (1994) 381394.
[44]J. Yang, C.-Q. Lv, Y. Guo, G.-C. Wang. A DFT+U Study of Acetylene Selective Hydrogenation on Oxygen Defective Anatase (101) and Rutile (110) TiO2 Supported Pd4
Cluster. J. Chem. Phys. 136 (2012) 104107.
[45]Y. Wang, K. Yu, D. Lei, W. Si, Y. Feng, L.-L. Lou, S. Liu. Basicity-Tuned Hydrotalcite-Supported Pd Catalysts for Aerobic Oxidation of 5-Hydroxymethyl-2-furfural under Mild Conditions. ACS Sustainable Chem. Eng. 4 (2016)47524761.
[46]D. Lei, K. Yu, M.-R. Li, Y. Wang, Q. Wang, T. Liu, P. Liu, L.-L. Lou, G. Wang, S. Liu. Facet Effect of Single-Crystalline Pd Nanocrystals for Aerobic Oxidation of 5-Hydroxymethyl-2-furfural. ACS Catal.7(2017) 421432.
[47]S. Siankevich, G. Savoglidis, Z. Fei, G. Laurenczy, D.T. L. Alexander, N. Yan, P. J. Dyson, A Novel Platinum Nanocatalyst for the Oxidation of 5-Hydroxymethylfurfural into 2,5-Furandicarboxylic Acid Under Mild Conditions. J. Catal. 315 (2014) 6774.
[48]H. Ait Rass, N. Essayem, M. Besson, Selective Aqueous Phase Oxidation of 5-Hydroxymethylfurfural to 2,5-Furandicarboxylic Acid over Pt/C Catalysts: Influence of the Base and Effect of Bismuth Promotion. Green Chem. 15 (2013) 22402251.
[49]H. Ait Rass, N. Essayem, M. Besson, Selective Aerobic Oxidation of 5-HMF into 2,5-Furandicarboxylic Acid with Pt Catalysts Supported on TiO2- and ZrO2- Based Supports. ChemSusChem 8 (2015) 12061217.
[51]G. Henkelman, A. Arnaldsson, H. Jónsson, A Fast and Robust Algorithm for Bader Decomposition of Charge Density. Comp. Mater. Sci. 36 (2006) 354360.
[52]D. Guo, G.-C. Wang. Partial Oxidation of Methane on Anatase and Rutile Defective TiO2
Supported Rh4 Cluster: A Density Functional Theory Study. J. Phys. Chem. C 121 (2017) 2630826320.
[53]S. E. Davis, B. N. Zope, R. J. Davis. On the Mechanism of Selective Oxidation of 5-Hydroxymethylfurfural to 2,5-Furandicarboxylic Acid over Supported Pt and Au Catalysts.
Green Chem. 14 (2012) 143147.
[54]B. N. Zope, D. D. Hibbitts, M. Neurock, R. J. Davis. Reactivity of the Gold/Water Interface During Selective Oxidation Catalysis. Science 330 (2010) 7478.
[55]Y. M. Choi, H. Abernathy, H.-T. Chen, M. C. Lin, M. Liu. Characterization of O2-CeO2
Interactions Using in situ Raman Spectroscopy and First-principle Calculations.
ChemPhysChem 7 (2006) 19571963.