Munich Personal RePEc Archive
Using Simulation and Six-Sigma Tools in
Improving Process Flow in Outpatient
Clinics
Heidarzadeh, Elham and Sajadnia, Sahar
B.Sc., Industrial Engineering, Faculty of Engineering, Islamic Azad
University, Karaj Branch, Iran, M.Sc., Industrial Engineering,
Faculty of Engineering, Islamic Azad University, West Tehran
Branch, Iran
31 October 2017
Online at
https://mpra.ub.uni-muenchen.de/82436/
Using Simulation and Six-Sigma Tools in Improving Process Flow in
Outpatient Clinics
Elham Heidarzadeh 1, Sahar Sajadnia 2
1 B.Sc., Industrial Engineering, Faculty of Engineering, Islamic Azad University, Karaj
Branch, Iran
2 M.Sc., Industrial Engineering, Faculty of Engineering, Islamic Azad University, West
Tehran Branch, Iran
Abstract
It is apparent that outpatient clinics are becoming complex and need to be optimized and improved on a daily basis. In this project, we used several methods including discrete event simulation, quality function deployment (QFD), and failure modes and effects analysis (FMEA) to optimize and improve these clinics. We conducted this study at a major suburban outpatient clinic to propose main recommendations which most likely apply to a vast majority of such clinics. Firstly, the simulation-based modeling that we ran assisted us in recognizing optimum staff number which would result in decreasing waiting times that patients usually spend and making the process flow at the facility smoother. Secondly, QFD approach for analyzing outpatient clinic requirement is also proposed and realized through a case study. It is realized that the proposed approach can adjust service quality toward customer requirements effectively. Lastly, the health care failure modes and effects analysis (FMEA) that we implemented as a novel method to discover conditions and active failures and to prioritize these based on the potential severity of risks associated with them.
1. Introduction
Over the past years, due to the dramatic increase in the cost of healthcare, stakeholders have forced the healthcare professionals to explore and develop new ways for reducing cost and improving the operational efficiency. One such area of development is improving the total patient time in outpatient clinic. This is one area that needs continuous attention and has become a background for a lot of researches going on in healthcare.
Several related papers have appeared in the literature review. It is a common practice at many outpatient clinics for providers to book multiple patients at the same time. Part of the reason for this is to ensure that patients are always available to see doctors or other expensive, scarce health care resources [1]. However, if all the scheduled patients show up on time or early, significant patient waiting is a certainty. Isken et al. [2] outlined a general framework for modeling outpatient clinics with the purpose of exploring questions related to demand, appointment scheduling, patient flow patterns and staffing. They assumed a fully loaded one week appointment book as input for their simulation. Ming et al. [3] used simulation approach for an outpatient clinic to increase overall efficiency of the patient flow. Their problem consists of determining prioritization (triage) rules so that adequate patient care is guaranteed, resources (provider schedules) were utilized efficiently and a service guarantee can be ensured. Everett [4] described a simulation model that provides a means for a central bureau to schedule the flow of elective surgery patients to appropriate hospitals in Australia to reduce wait times. Van et al. [5] used simulation to determine the optimal production and inventory policies for each combination of patient type and cytostatic drug type to minimize patient wait times and costs. Furthermore, Blake et al. [6] described a simulation model of the emergency room to investigate issues contributing to patient wait times, and indicate that patient wait time is affected by the availability of staff physicians and the amount of time physicians are required to spend engaged in the education of medical residents. Lane et al. [7] also described a simulation model to understand patient wait times in an accident and emergency department, and find that while some delays to patients are unavoidable, reductions can be achieved by selective augmentation of resources within, and relating to, the accident and emergency department.
Apart from discrete event simulation that we performed, Failure Mode Effects Analysis (FMEA) and Quality Function Deployment (QFD) are powerful techniques that are implemented in this paper in order to increase reliability and improve quality of process flows in outpatient clinics. Failure Modes and Effects Analysis (FMEA) is used prospectively to identify possible system failures and to fix these problems to make the system more robust before an adverse event occurs [8, 9]. Moreover, the results from house of quality can help managers and engineers to use the demanded quality and customer requirement relationship matrix to create a numerical understanding of the allocation of effort within specific areas of an outpatient case [10, 11]. This application can serve as a highly viable optimization tool within the healthcare system.
2. Out-Patient Clinics
A major suburban outpatient clinic is modeled using the arena simulation. This modeling helps us in finding bottle and to make the process better. Arena modeling also helps us in understanding the process much better since all the processes are shown in detail and animated for easy viewing.
All the process is divided into four sections namely entrance gate, check-in area, process treatment and the exit. All these are again divided further as per the process and the treatment in the health services.
[image:4.595.158.436.199.333.2]The entrance gate is the first process where the entities are created and they are assigned some picture for identification and attributes to calculate the time in the system. Then they are sent to the reception through station and route.
Figure 1. Entrance gate
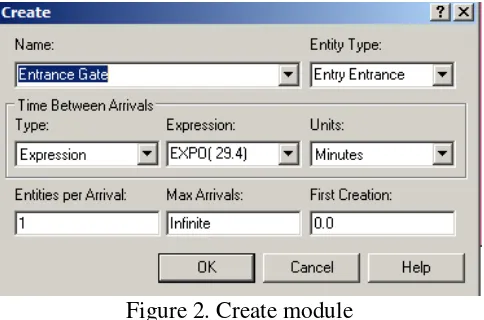
The create module is used to create the entities with an expression EXPO (29.4) which was calculated from the n value calculation. All the time is in minutes. The first creation is a 0 and an infinite number of arrivals.
Figure 2. Create module
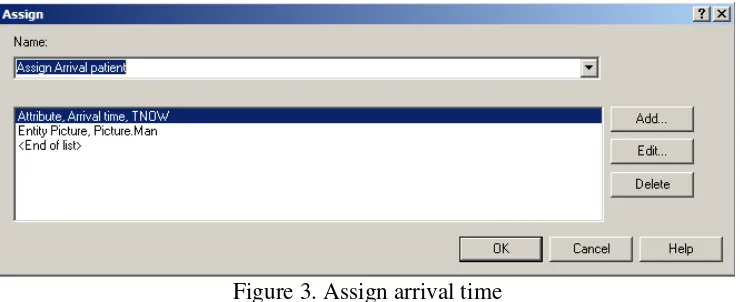
[image:4.595.178.420.408.568.2]Figure 3. Assign arrival time
Since there is only one type of patient, so that entity is sent directly to the receptionist using a process module. There is a set of receptionists used and the seize delay release for the set is also used to the process. The time for this process is calculated as GAMM (10.4,1.64) which is obtained from the calculation of n.
Figure 4. Process at reception
[image:5.595.142.455.336.639.2]which has particular time set. If the patient has an appointment then they are checked for their visit to the clinic.
Figure 5. Decision the patient status
There are two conditions of true or false on the patient visit to the hospital. If the patient is new then he must fill the application, show the proof of identification to the receptionist. If the patient is old, the data is retrieved for that patient to continue in the process of treatment. The last step is if the patient is new and does not have an appointment, then they must exit the system which is considered as unseen patient.
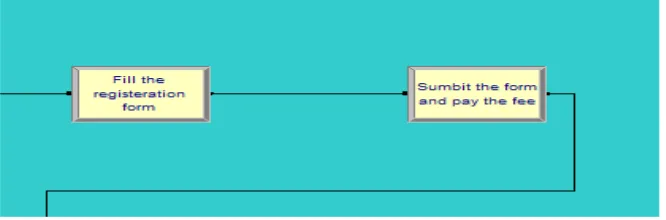
The case where the patient is new and has an appointment, there are two processes as filling the application and paying fees for the appointment.
Figure 6. New patient with appointment
[image:6.595.133.466.518.628.2]Figure 7. Decision on patients condition
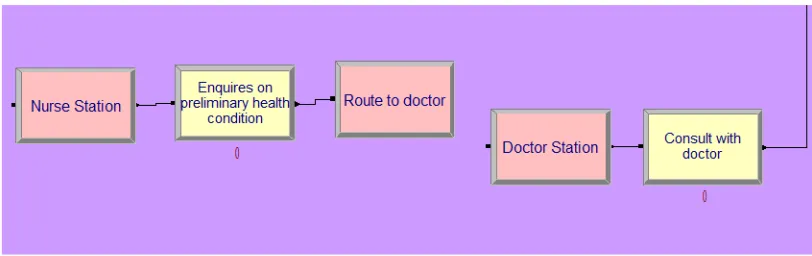
If the patient needs to be admitted then they are sent or referred to adjacent hospital where inpatient facility is available. If the patient is not that serious then they are routed to nurse queue and a physician’s queue as described above. After the preliminary check in and initial process, the patient is sent to nurse queue as shown in the picture below.
Figure 8. Nurse and doctor Queue
The nurse enquires on the initial condition of the patient and then the patient is routed to the doctor using the station and route. Then the patient is received at the doctor station.
[image:7.595.94.500.408.536.2]Figure 9. After doctor’s consultation
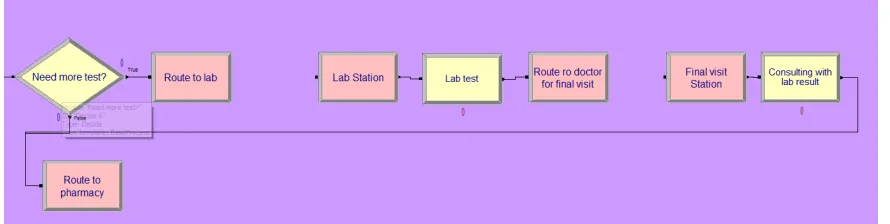
The lab test is a process which is estimated to be around 15 minutes of time. After the lab test the entity is routed to doctor consultation process using a route called “Route to doctor for final visit”. The consultation is for a fixed time such as 15 minutes.
[image:8.595.139.457.342.412.2]The last stage is the pharmacy station where the patient comes after the doctor consultation. The pharmacy is for a time of 15 minutes. A record module is used in order to have a count of number of people leaving the system after consulting with the doctor.
Figure 10. Pharmacy
After all the consultation and the treatment process the entity at all the stages is routed to the station called “Patient Leave”. There is one more record module to count the number of patients leaving the clinic be it seen by the doctor or not seen.
Figure 11. Patient’s exit
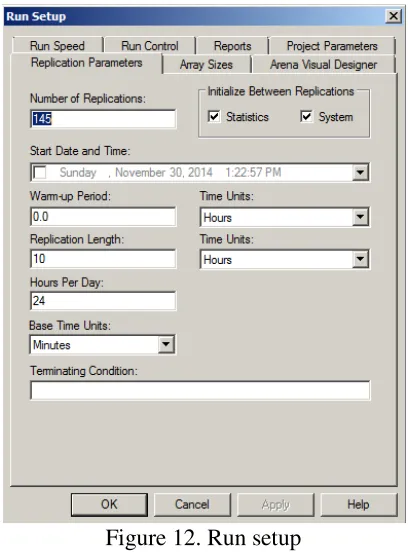
[image:8.595.175.419.485.598.2]Figure 12. Run setup
After the entire logic is done, the system is animated for its better viewing and understanding. The small icons in the picture represent the entities such as doctor, nurse, receptionist etc.
Figure 13. Animation
[image:9.595.78.468.442.631.2]3. Implementation/Application/Discussion
3.1. Implementation of Quality Function Deployment (QFD)
QFD is a practical methodology that has been used to translate the customer requirements into design quality, to deploy the functions forming quality, and to employ methods for achieving the design quality aimed at satisfying the customer into subsystems and component parts, and ultimately to specific elements of the manufacturing process [12-14]. Many articles have utilized QFD in different industries for different purposes based on their requirements and intentions [15-22]. In this project, we implemented a similar approach proposed in Akar’s et al [14] and Feili’s et al [18] research articles to adapt and run QFD model in healthcare sector.
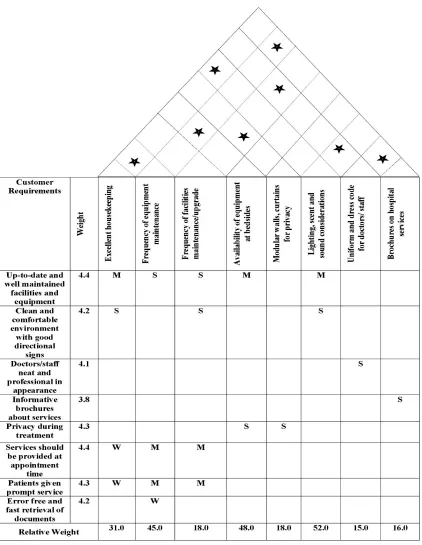
We followed steps below to build our house of quality in figure 14: 1. List Customer Requirements (What’s);
2. List Technical Descriptors (How’s); 3. Develop Relationship (What’s & How’s); 4. Develop Interrelationship (How’s); 5. Competitive Assessments;
3.2. Implementation of Failure Mode Effects Analysis (FMEA)
Failure Mode Effects Analysis (FMEA) has been used in different studies and projects [23-27]. It is basically a practical method for risk assessment applicable to literally all industries. Tables 1-3 also show rating scales for Severity (S), Occurrence (O), and Detection (D), respectively.
Table 1
[image:12.595.68.531.207.373.2] [image:12.595.65.529.372.671.2]Severity rating scale for FMEA (Adapted from [28])
Table 2
Occurrence rating scale for FMEA (Adapted from [28])
Table 3
Detection rating scale for FMEA (Adapted from [28]) Rank of
Detection
Description
1–2 Very high probability that the defect will be detected. 3–4 High probability that the defect will be detected. 5–7 Moderate probability that the defect will be detected. 8–9 Low probability that the defect will be detected.
10 Very low (or zero) probability that the defect will be detected.
The RPN was also calculated using the formula: S x O x D, where high numbers indicated a high priority for intervention and action. Eight failure modes were identified with RPN values ranging from 60 to 360 points (Table 4).
Description Rank of
Severity
Failure is of such minor nature that the operator will probably not detect the failure.
1–2
Failure will result in slight deterioration of part or system performance. 3–5
Failure will result in operator dissatisfaction and/or deterioration of part or system performance.
6–7
Failure will result in high degree of operator dissatisfaction and cause non- functionality of system.
8–9
Failure will result in major operator dissatisfaction or major damage. 10
Description Rank of
Occurrence
An unlikely probability of occurrence: Probability of Occurrence < 0.001 1
A remote probability of occurrence: 0.001< Probability of Occurrence < 0.01 2–3
An occasional probability of occurrence: 0.01< Probability of Occurrence < 0.10
4–6
An occasional probability of occurrence: 0.10 < Probability of Occurrence < 0.20
7–9
Table 4
Proposed FMEA worksheet
Failure Modes Proximate Causes S O D RPN Corrective Action
Diagnosis incorrect Diagnostic tests are not performed
4 10 9 360 Testing protocols for patients who present with signs of problem
Wrong medicine selected for the patient
Clinical diagnosis nor
unknown/considered
10 4 6 240 Pharmacy monitoring service
Failure to initiate standard order set / preprinted orders
Not followed/don’t agree with the protocols
10 3 5 150 Interdisciplinary treatment guidelines
Order not received / processes in pharmacy
Unaware of order on nursing unit
8 4 3 96 Flagging system for new orders
Order not processed Order not flagged 5 4 3 60 Flagging new orders Order misunderstood Illegible order 9 4 2 72 Standard and efficient
process for sending orders to the pharmacy
Wrong drug, dose, or flow rate
Failure to review/consider current lab values
6 5 5 150 Pharmacy review before administration
Lab tests not
performed, incomplete, or inaccurate
Failure to request prescribed lab tests
8 4 6 192 Clinical pharmacy program
4. Results
4.1. Simulation Model
We ran the model and concluded results below.
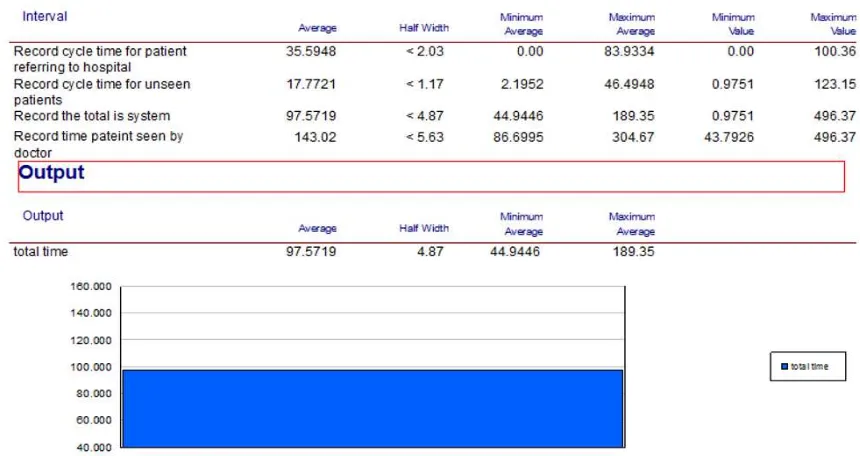
[image:13.595.79.509.491.719.2]In each day, 17 patients are coming to the outpatient clinic and the average time for each of them in the system is 97.57 minutes. The average waiting time in minute for each section can be seen in below table.
Table 5
Average wait for outpatient
Consult with doctor Lab test Pharmacy Reception Retrieve history file
18.15 0.76 2.38 1.07 1.55
[image:14.595.72.534.182.253.2] [image:14.595.67.539.350.421.2]The table 5 shows the average wait time of the patent at each process. From the values obtained we can say that consultation with the doctor has long time. The average utilization of staffs can be seen in below table.
Table 6
Staff utilization of outpatient
Out of all the resources used in the outpatient clinic, we can say that the doctor is the main resource that is more intensively used. As the doctor has multiple queues, so the utilization of the doctor is more. The best total would be obtained when we manipulate the number of doctors in the system keeping the cost parameter in mind, we may end up having a best solution for this system.
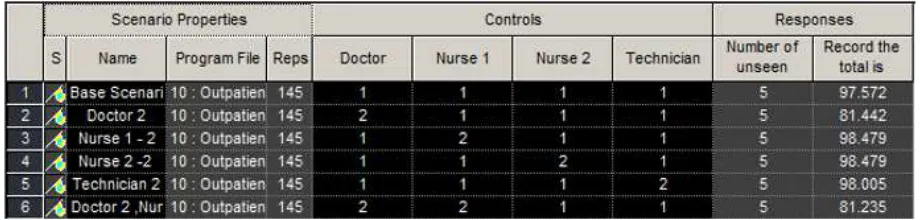
4.1.1. Process analyzer-best scenarios
For calculating the optimal solution, we have used the process analyzer. The optimal solution is the best scenario that the analyzer gives that reduces the total time in the system. We have taken into consideration only the resources to change the total time in the system which is the objective of the process. We have used different combinations by manipulating the resources. The cost analysis was not in the scope of the project.
Figure 16. Outpatient best scenario
Doctor Nurse 1 Nurse 2 Pharmacist Receptionist 1 Receptionist 2 Technician
[image:14.595.68.528.607.717.2]The system ran for a value of 145 replications which was calculated as per the calculations shown above in the n calculation. From the figure 16, we see that the process ran for different combinations of resources.
4.2. QFD and FMEA
During QFD process, we successfully figured relationship among 8 technical requirements and 8 customer requirements in terms of strong, medium, and weak bases. The results interestingly show that lighting, scent, and sound considerations is critical to improve patients’ satisfaction in outpatient clinics. We also realized that frequency of equipment maintenance is another important consideration that should be focused during improving outpatient clinics.
During FMEA implementation, we found 8 major failure modes in outpatient clinics which have different severity, occurrence, and detection rates with ultimately distinct RPNs. Corrective actions have been proposed for all 8 failure modes accordingly. Among all 8 failure modes, incorrect diagnosis and wrong medicine selected for the patient have the most RPNs which means they need immediate attention to provide improvements to outpatient clinics.
5. Conclusion
By using the process analyzer and different combinations we found out the level of resources that give us the best total time in the system. If the total time is less then obviously the wait time can be reduced. In the outpatient clinic that we considered, increasing the number of doctors to two gave us best results. The total time in the system is 81.442 which are 16 minutes less than the base scenario with one for each resource. In a healthcare set up, the ideal situation would be to decrease the total time of a patient in the system which would help treating more number of patients in the facility and hence would increase the facility efficiency and patient satisfaction. We also realized that by considering close attention to lighting, scent, and sound considerations and frequency of equipment maintenance, we can expect improvements in outpatient clinics. It’s worth mentioning that incorrect diagnosis and wrong medicine selected for the patient have been the most critical and damaging consequences that we can see in outpatient clinics which can be prevented by testing protocols for patients who present with signs of problem and providing pharmacy monitoring service.
References
[1] C.E. Noon, C.T. Hankins, M.J. Cote, “Understanding the Impact of Variation in the Delivery of Healthcare Services,” J. HealthcManag, Volume No. 48, PP. 82–98, 2003.
[2] M.W. Isken, T.J. Ward, T.C. McKee, “Simulating Outpatient Obstetrical Clinics,” Proceedings of the 1999 Winter Simulation Conference, PP. 1557-1563. Piscataway, New Jersey, 1999.
[3] M. Guo, M. Wagner, C. West, “Outpatient Clinic Scheduling – a Simulation Approach,” Proceedings of the 2004 Winter Simulation Conference, PP. 1250-1268, Piscataway, New Jersey 2004.
[5] V. Merode, G.G. Groothuis, S. Schoenmakers, M. Boersma, “Simulation Studies and the Alignment of Interests,” J. Health Care Management Science, Volume No. 5, PP. 97-102, 2002.
[6] J.T. Blake, M.W. Carter, S. Richardson, “An Analysis of Emergency Room Wait Time Issues via Computer Simulation,” J. INFOR, Volume No. 34, PP. 263-73, 1996.
[7] D.C. Lane, C. Monefeldt, J.V. Rosenhead, “Looking in the Wrong Place for Healthcare Improvements: a System Dynamics Study of an Accident and Emergency Department,” J. Operational Research Society, Volume No. 51, PP. 518-31, 2000.
[8] D.H. Stamatis. “Failure mode and effects analysis: FMEA from theory to execution”, Milwaukee, WI: ASQC Quality Press; 1995.
[9] Strategies and tips of maximizing failure mode and effects in your organization. White Paper. Chicago: American Society for Healthcare Risk Management; 2002. Available at: www.ashrm.org/ashrm/resources/files/FMEAwhitepaper.pdf. Access April 7, 2008.
[10] L. K. C. Chan, & M. L. W. Wu, “Quality function deployment: A literature review”, Informally published manuscript, Management Sciences, City University of Hong Kong, Kowloon, Hong Kong, China, 2001.
[11] G. H. M. Mazur, “The application of quality function deployment (qfd) to design a course in total quality management (tqm) at the university of Michigan college of engineering”. Unpublished manuscript, College of Engineering, University of Michigan, Michigan, 1996.
[12] Y. Akao, “An Introduction to Quality Function Deployment; Quality Function Deployment (QFD): Integrating Customer Requirements Into Product Design”, Productivity Press, Cambridge, Massachusetts, (1990) 1-24.
[13] V.T. Luu, S.Y. Kim, T.Q. Truong, O.O. Stephen, Quality improvement of apartment projects using fuzzy-QFD approach: A case study in Vietnam, KSCE J. Civil Engineering 13 (2009) 305-315.
[14] Akar, Navid, and Hossein Lotfizadeh. “A New Integrated FQFD Approach for Improving Quality and Reliability of Solar Drying Systems.” arXiv preprint arXiv:1704.07895 (2017).
[15] L. Wang, Y.K Juan, J. Wang, K.M. Li, C. Ong , Fuzzy-QFD approach based decision support model for licensor selection, J. Expert Systems with Applications 39 (2012) 1484–1491.
[16] L.K. Chan, M.L. Wue, A systematic approach to quality function deployment with a full illustrative example, J. Management and Science 33 (2005) 119–139.
[18] Feili, H. R., Molaee Aghaee, E., Bairampour, M., Akar, N., & Fadaee, A. (2012, May). Development of Solar Drying Systems in Saffron Industry Using FAHP & FQFD. In 3rd International Conference on Nuclear & Renewable Energy Resources, Turkey (pp. 20-23).
[19] E. Bottani, A. Rizzi, Strategic management of logistics service: A fuzzy-QFD approach. J. Production Economics 103 (2006) 585–599.
[20] Akar, N., Daj, E., & Boroojerdi, S. S. (2016). Using Fuzzy Quality Function Deployment in Improving Reliabality of Wind Power Systems.
[21] C. Kahraman, T. Ertay, G. Buyukozkan, A fuzzy optimization model for QFD planning process using analytic network approach, J. Operational Research 171 (2006) 390–411.
[22] D.E. Lee, T.K Lim, D. Arditi, Automated stochastic quality function deployment system for measuring the quality performance of design/build contractors, Automation in Construction 18 (2009) 348–356.
[23] Xiao N, Huang HZ, Li Y, He L, Jin T. Multiple failure modes analysis and weighted risk priority number evaluation in FMEA. J Eng Fail Anal 2011;18:1162–70.
[24] Mazur Z, Garcia Illescas R, Porcayo Calderon J. Last stage blades failure analysis of a 28 MW geothermal turbine. J Eng Fail Anal 2009;16:1020–32.
[25] Feili, H. R., Akar, N., Lotfizadeh, H., Bairampour, M., & Nasiri, S. (2013). Risk analysis of geothermal power plants using Failure Modes and Effects Analysis (FMEA) technique. Energy Conversion and Management, 72, 69-76.
[26] Narayanagounder S, Gurusami K. A new approach for prioritization of failure modes in design FMEA using ANOVA. World Acad Sci, Eng Technol 2009;49.
[27] W.W. Vandenbrande, “How to use FMEA to reduce the size of your qualitytoolbox”, J Qual Prog 1998;31:97–100.
![Table 2 Occurrence rating scale for FMEA (Adapted from [28])](https://thumb-us.123doks.com/thumbv2/123dok_us/190829.518004/12.595.65.529.372.671/table-occurrence-rating-scale-fmea-adapted.webp)