Original Article
Differentiation of prostate cancer and prostatitis in the
peripheral zone with diffusion-weighted imaging: ADC
value versus normalized ADC value
Dong Yang1, Nan Jin2, Yan Guo3, Huan-Jun Wang3, Bi-Tao Pan3
1Department of Radiology, The First Affiliated Hospital of Chongqing Medical University, Chongqing, People’s Republic of China; 2Chongqing Center for Disease Control and Prevention, Chongqing, People’s Republic of China; 3Department of Radiology, The First Affiliated Hospital of Sun Yat-sen University, Guangzhou, People’s Republic of China
Received October 30, 2015; Accepted January 15, 2016; Epub February 15, 2016; Published February 29, 2016
Abstract: Purpose: The purpose of this study is to compare the diagnostic accuracy of prostate apparent diffusion coefficient (ADC) versus normalized prostate ADC using the normal peripheral zone as the reference site for the dif-ferentiation of prostate cancer and prostatitis in the peripheral zone. Methods: Fifty-two patients, 32 with prostate cancer and 19 with prostatitis, were assessed with single-shot echo-planar diffusion-weighted imaging using b values of 0 and 1000 s/mm2. Prostate ADC and normalized prostate ADC (defined as the ratio of lesion ADC to nor-mal peripheral zone ADC) were compared between prostate cancer and prostatitis in the peripheral zone. Receiver operating characteristic (ROC) analysis was used to determine the performance of ADC and normalized prostate ADC for differentiation of prostate cancer and prostatitis in the peripheral zone. Results: There were significant dif-ferences in ADC and nADC between prostate cancer and prostatitis in the peripheral zone. ROC analysis showed no significant differences between ADC and nADC for differentiation of prostate cancer and prostatitis in the peripheral zone (area under the ROC curve, 0.935 vs. 0.926; P=0.843). Conclusions: Our results suggest that nADC with nor-mal peripheral zone as the reference site had similar performance to ADC for the differentiation of prostate cancer and prostatitis in the peripheral zone when using diffusion-weighted imaging.
Keywords: Prostate cancer, magnetic resonance, apparent diffusion coefficient, normalized apparent diffusion coefficient, peripheral zone
Introduction
Prostate cancer (PCa) and prostatitis are the most common disease of prostate in the clini-cal. Prostate cancer is the most common malig-nancy in the European Union and the second among men in the United States being the sec-ond leading cause of cancer-related deaths. Its incidence is increasing as routine screening [e.g. serum prostate-specific antigen (PSA) and digital rectal examination (DRE)] becomes more common; on the other hand, the wide-spread use of screening tests has led to a sig-nificant decrease in prostate cancer-related mortality, likely due to earlier detection. So the earlier detection of prostate cancer is very important. However, the specificity of PSA level for prostate cancer screening is limited, and
even if PSA levels are between 2.5 and 4 ng/ mL, cancer is detected in 25-30% of biopsies [1].
Localization of prostate cancer is important given the emergence of disease-targeted thera-pies, such as intensity-modulated radiation therapy, interstitial brachytherapy, and cryosur-gery, as part of patient care [2]. Knowledge of the tumor location within the prostate can help direct maximal therapy to the largest focus of tumor while minimizing damage to the sur-rounding structures, such as the neurovascular bundles, the rectal wall, and the neck of the bladder [3].
inter-nal zointer-nal anatomy of the prostate as well as its contours. Prostate cancer in the peripheral zone is hypointense on T2-weighted images and isointense on T1-weighted images. However, low T2-weighted signal is not specific for cancer. Underlying hemorrhage resulting from biopsy, prostatitis, atrophy, or posttreat-ment changes can present with low signal intensity [4, 5].
Diffusion-weighted imaging (DWI) is a novel imaging technique that reflects microscopic water diffusion using a pair of strong diffusion gradients. High-b-value DWI provides better contrast, yielding greater tissue diffusivity and less T2 shine-through effect. Apparent diffu-sion coefficient (ADC) has been shown to be a promising marker for prostate cancer detection and localization by several independent investi-gators [6-10]. The ADC of prostate cancer has been reported to be lower than that of normal peripheral zone across these multiple studies, although reported ADC values vary between studies, partly because of differences in acqui-sition parameters. A hurdle to the widespread clinical application of DWI lies in the lack of standardization of parameters, with reported interscanner and intrascanner variability of approximately 5-15% [11]. The variability in reported ADC measurements is further compli-cated by the use of different b values, which can affect ADC quantification [12].
Normalized ADC (nADC), known as relative ADC (rADC), using a reference site that remains rela-tively constant across patients or systems may help reduce variability in ADC calculations. For instance, a recent study showed that normal-ized ADC (using the spleen) appeared to decrease variability of ADC on the basis of choice of b values for benign and malignant liver lesions [13]. The normal peripheral zone may be an ideal reference site, because its anatomic border is clear on DWI, thus providing easy measurement of the ADC; and it maintains a relatively stable ADC. Another recent study showed that normalization of pelvic lymph node ADC using renal cortex as a reference helped improve the diagnostic accuracy for detecting metastatic cervical cancer [14]. ADC normaliza-tion has been rarely used outside the brain [13, 14]. To our knowledge, there has been no attempt to use rADC to diagnose prostate dis-eases. The objective of this study is to compare
the diagnostic accuracy of ADC versus normal-ized ADC using the normal peripheral zone as a reference site for the differentiation of prostate cancer and prostatitis in the peripheral zone.
Materials and methods
Ethics
Our retrospective study was approved by our Institutional Review Board for human investiga-tion and informed consent was waived.
Patients
From December 2010 to August 2012, 32 patients with prostate cancer(mean age: 71 years, range: 56-85 years; mean total PSA: 55.79, range: 10.6-246 ng/ml) and 19 patients with prostatitis (mean age: 66 years, range: 46-75 years; mean total PSA: 23.54, range: 5.2-76.3 ng/ml) were assessed with single-shot echo-planar diffusion-weighted imaging using b values of 0 and 1000 s/mm2. The
par-ticipating patients had undergone no prior treatment for prostate cancer. All patients were confirmed by transrectal ultrasound (TRUS)-guided biopsy of the prostate within one month after MR imaging.
Imaging technique
All scans were performed before prostate biop-sy on a 3-Tesla MR scanner (Magnetom Trio; Siemens Medical Solutions, Erlangen, Germany) using an eight-channel phased-array body coil for signal reception.
The entire prostate gland and seminal vesicles were covered by axial T1-weighted spin-echo MR imaging with 600 msec/21 msec (repeti-tion time/echo time) and an echo train length of 17, and 3 averages, and axial, coronal and sag-ittal fat suppression T2-weighed turbo-spin-echo MR imaging with 3500-3920 msec/83-95 msec (repetition time/echo time) and an echo train length of 17, and 3 averages. These conventional MR images were each obtained with a 3-mm slice thickness, a 0.6-mm inter-slice gap, a 200×200 mm field of view (FOV), and a 288×320 matrix. The voxel size was 0.7×0.6×3.0 mm, equaling 1.26 mm3. The
seconds for the axial, coronal and sagittal fat suppression T2-weighed images.
Axial diffusion-weighted images (DWIs) were obtained using a single-shot echo-planar imag-ing (EPI) sequence with the followimag-ing parame-ters: repetition time of 4000 msec, echo time of 81 msec, and b-factors of 0 and 1000 sec/ mm2. The bandwidth was 1202 Hz/pixel with a
120×160 matrix, 260×220 mm field of view (FOV), 3-mm slice thickness, 0.6-mm interslice gap for covering the entire prostate and semi-nal vesicles. Following the acquisition of b=0 images, motion-probing gradients were applied in three orthogonal orientations for calculation of the apparent diffusion coefficient (ADC). The voxel size was 2.2×1.6×3.0 mm, equaling 10.56 mm3. For each b-factor, three DWI
acqui-sitions were averaged, giving a scan time of two minutes and 22 seconds. An acceleration fac-tor of two was applied using the modified sensi-tivity encoding (mSENSE) parallel imaging technique.
Image analysis
Location of prostate cancer and prostatitis in the PZ was decided using the results of the biopsy as the “gold standard”. The tumor or prostatitis site on each MR image was deter-mined, by a radiologist with 10 years experi-ence in prostate MR imaging (YAN Guo), to match the histologic findings (reference stan-dard) when the lesion depicted on the image was present in the same region of the prostate indicated in the pathology report on the US-guided biopsy specimen. ADC values were calculated from two DWI sequences acquired with b=0 sec/mm2 and b=1000 sec/mm2. ADC
maps were reconstructed by calculating ADC in each pixel of each slice. Mean ADC values for the prostate were calculated using regions of interest (ROIs). For each patient, regions of interest (ROIs) were drawn into the prostate cancer of PZ, or prostatitis in the PZ and normal PZ.
ROIs of tumor locations of PZ and prostatitis were set as large as possible. The PZ was defined as the peripheral area of the prostate gland with high signal on T2-weighted turbos-pin-echo images surrounding the posterior part of the central low-signal area (TZ). If the periph-eral area on one side had low signal on T2-weighted images, delineation of the PZ was estimated by referring to the other side.
Landmarks used for ROI localization were the urethra, the border between the PZ and CG, and the capsule of the prostate gland. If a pseudocapsule of a benign prostatic hyperplas-tic nodule was present, this was also used as a landmark. When the ROI was set, great care was taken to exclude both the neurovascular bundle and the urethra to reduce any error in ADC value calculations. ADC values in prostate cancer and prostatitis were assessed 3 times in the same site, and an average was ed. The ADC values in normal PZ were calculat-ed at 3 different sites and were then averagcalculat-ed. All the ROIs measurement was performed on the basis of histopathologic findings, with refer-ence to images from T2-weighted imaging and DWI. Each ROI was a circle or oval, with an area of 7 to 25 mm2. Normalized ADC values of
pros-tate cancer and prostatitis were calculated according to the formula [15]: normalized ADC=ADCles/ADCrs, where ADCles is the ADC of the lesion and ADCrs is the ADC of the reference site. In our study, the reference site was normal PZ, so the normalized ADC of prostate cancer, rADCPCa=ADCPCa/ADCPZ, normalized ADC of pros-tatitis, rADCP=ADCP/ADCPZ.
Statistical analysis
All analysis was performed with statistical soft-ware SPSS version 17.0. ADCs and nADCs of prostate cancer and prostatitis were compared with a nonparametric Mann-Whitney test. In order to evaluate the diagnostic performance of the ADCs and nADCs in differentiating pros-tate cancer from prostatitis in the PZ, receiver operating characteristics (ROC) curve analysis was performed. Then the areas under the ROC curve were compared between the ADC and the nADC using the Z test. From the ROC curves, the optimal cutoff value which showed the best separation, i.e., minimal false-negative and false-positive results, between the prostate cancer and prostatitis, was extracted. There- after, the sensitivity and specificity correspond-ing to the cutoff values were calculated. All tests were two-sided and P﹤0.05 was consid-ered indicative of a statistically significant difference.
Results
biopsy. Twenty-four patients had a single focus, 5 had two foci, and one had three foci. The median tumor Gleason score was 7 (Gleason score range, 5-9), consisted of 2 lesions with a Gleason score of 5, nine with a Gleason score of 6, eighteen with a Gleason score of 7, seven with a Gleason score of 8, and one with a Gleason score of 9. Mean ADC values were 0.77±0.19×10⁻³ mm2/sec for prostate cancer in
PZ and 2.06±0.16×10⁻³ mm2/sec for normal
[image:4.612.90.526.71.268.2]regions in PZ, representing a significant differ-ence (P﹤0.05). Examples of PCa are shown in
Figure 1.
In 19 patients with prostatitis, 32 PZ foci were confirmed by TRUS-guided biopsy. Seven pa- tients had a single lesion, eleven had two lesions, and one had three lesions. Mean ADC
[image:4.612.89.525.336.536.2]Figure 1. A 78-year-old patient with a serum PSA level of 60 ng/mL. Both T2W imaging (A) and the ADC map (B) showed a hypointense area in the left peripheral zone (arrow). Pathologic results revealed a cancer focus well-cor-related with the finding of the ADC map. ADC value of PCa and normal PZ were 0.664×10⁻³ mm2/s and 1.389×10⁻³ mm2/s, respectively, normalized ADC was 0.478.
values were 1.18±0.19×10⁻³ mm2/sec for
pros-tatitis in PZ and 1.98±0.18×10⁻³ mm2/sec for
normal regions in PZ, representing a significant difference (P﹤0.05). Examples of prostatitis are shown in Figure 2.
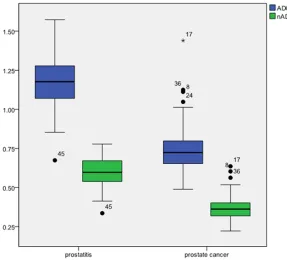
Mean ADCs of prostate cancer were significant-ly lower than prostatitis (0.77±0.19 vs. 1.18 ±0.19×10⁻³ mm2/sec; P﹤0.05). Mean nADCs of
prostate cancer were significantly lower than prostatitis (0.37±0.10 vs. 0.60±0.10; P﹤0.05). Overlap was seen between ADC and nADC val-ues of prostate cancer and prostatitis in PZ, shown in Figure 3.
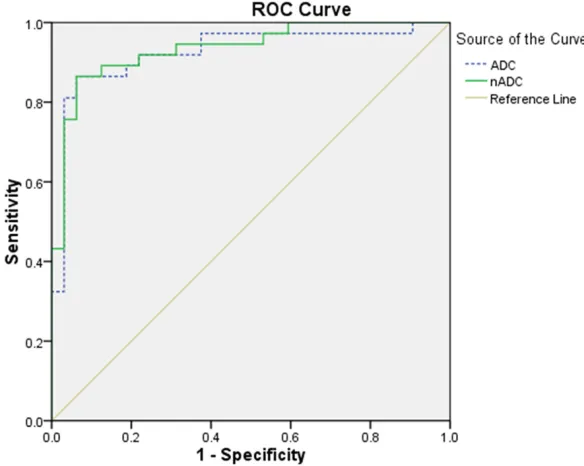
ROC analysis revealed similar performance using nADC compared with ADC. There was no significant differences between the area under the ROC curve for nADC (0.935; 95% CI, 0.877-0.993) and ADC (0.926; 95% CI, 0.858-0.877-0.993) (P=0.843). According to the ROC analysis, a hypointense lesion in PZ with an ADC equal to or less than 0.95×10⁻³ mm2/sec was
consid-ered prostate cancer. Using the ADC criteria, the sensitivity and specificity for differentiating prostate cancer from prostatitis were 86.5% and 93.8%, respectively. With the nADC criteria of 0.441, the sensitivity and specificity for dif-ferentiating prostate cancer from prostatitis
The diffusion-weighted imaging (DWI) findings add specificity to the MR imaging findings in cancer detection and localization. DWI is an MR imaging technique that derives its image con-trast on the basis of differences in the motion of water molecules between tissues. In tissues that are highly cellular (e.g., tumor tissues), the tortuosity of the extracellular space and the higher density of hydrophobic cellular mem-branes restrict the apparent diffusion of water protons. Water diffusion is said to be relatively “restricted” in such an environment. By con-trast, the apparent diffusion of water protons is relatively “free” in cystic or necrotic tissues. Thus, DWI is unique in its ability to provide infor-mation that reflects tissue cellularity and the integrity of cellular membranes.
[image:5.612.91.378.70.330.2]Prostate cancer can be distinguished from healthy peripheral zone tissue on the basis of qualitative and quantitative assessment of tis-sue diffusivity (apparent diffusion coefficient) without the use of gadolinium chelates. The reported sensitivity and specificity, respective-ly, for cancer localization within the peripheral zone of the prostate gland for DWI are 86.7% and 72.2% [16]. Combined results from MR imaging and DWI yield sensitivity of 87% and specificity of 80% [17].
Figure 3. Box plot illustrating ADC and nADC for prostate cancer and prostatitis. Mean ADC and nADC for cancer voxels were significantly less than that for pros-tatitis voxels, although overlap exists in individual values.
were 86.5% and 93.8%, respectively. ROC curves were shown in Figure 4.
Discussion
The ADC is basically a parameter that displays the characteristics of the structural and mag-netic environment that influences proton diffu-sion. The ADC then reflects various physical and physiologic characteristics of tissue but is not specific for cancer itself. Therefore, various abnormal conditions such as inflammation, ischemia, or benign prostatic hyperplasia, which cause structural changes, can alter the ADC value in a region of tissue [16].
Although many studies have proven the feasi-bility of ADC for cancer detection in prostate by showing a lower ADC in cancer tissue than in noncancerous tissue, the mean ADC in pros-tate cancer seems to vary according to the study. For instance, the mean ADC of prostate cancer ranged from 0.96±0.17×10⁻³ mm2/sec
to 1.38±0.52×10⁻³ mm2/sec in previous
stud-ies [8, 10, 18, 19], compared with 0.77 ±0.19×10⁻³ mm2/sec in the present study. The
reason for this variance is that the diffusivity of a certain tissue may change according to bio-logic factors, such as a patient’s age and body temperature, and technical factors, such as b value and location and area of region of inter-est [1, 20-24]. Therefore, the ADC threshold for the differentiation of cancer from
noncancer-tatitis in the peripheral zone, ADC also showed a significant overlap between them, which may results in false-negative or false-positive inter-pretations on DWI and ADC map. Although tis-sue diffusivity may differ between prostate can-cer and prostatitis in the peripheral zone, there must be an overlap, as various conditions such as ischemia and inflammation also reduce ADC. This overlap cannot be solved by nADC. A lower ADC pattern in areas of inflammation that is interpreted as compatible with high-grade malignant lesions can lead to overly aggressive surgical planning and, possibly, increased mor-bidity. Thus, findings at DWI and ADC map, as with those from all other clinical tests, must be interpreted critically and in conjunction with other available clinical data.
[image:6.612.91.383.75.308.2]The choice of the reference site for nADC in prostate may be difficult. In the present study, the normal peripheral zone was used as the ref-erence site for calculating nADC. The diagnos-tic accuracy of nADC with normal peripheral zone as the reference site was equivalent to ADC for differentiation of prostate cancer and prostatitis in the peripheral zone. We suggest that future efforts should therefore be made to determine the optimal reference site for nADC
Figure 4. Receiver operating characteristic (ROC) curves for nADC and ADC for the differentiation of prostate cancer and prostatitis in the peripheral zone. The area under the ROC curve for nADC was 0.935, versus 0.926 for ADC, there was no significant difference between the two ROC curves (P=0.843).
ous tissue may also vary, which makes it difficult to generally apply a certain ADC threshold for cancer detection. To overcome this potential limitation, normal-ized ADC, which is called relative ADC, can be calcu-lated with ADCles/ADCrs, wh- ere ADCles is the ADC of the lesion and ADCrs is the ADC of the reference site. Normalized ADC seems to be necessary because nor-malization can reduce the variability of ADC caused by various patient or technical factors.
pros-and to evaluate the benefit of nADC for the dif-ferentiation of prostate disease, particularly because this technique is completely noninva-sive and thus avoids the administration of con-trast agents.
Our study has several limitations. First, this study was performed in a retrospective man-ner; thus, our study may have a sampling bias. Our results need to be confirmed by additional studies including radical prostatectomy and whole-mount step-section examination. Seco- nd, only a small number of patients (N=51) were involved in this study. A larger patient pop-ulation with a broad range of tumor grades is needed to evaluate the diagnostic performance of nADC in prostate cancer and prostatitis detection. Third, this study obtained DWI using only two b values of 0 and 1000 s/mm2.
Although ADC can be calculated with two b val-ues, an exponential fit or a linear regression of DWIs with several b values can reduce the effect of image noise.
In conclusion, the results of our study indicate that that the diagnostic accuracy of nADC with normal peripheral zone as the reference site was equivalent to ADC for differentiation of prostate cancer and prostatitis in the peripher-al zone when using diffusion-weighted imaging. The utility of nADC as a noninvasive marker for prostate disease remains to be shown in fur-ther prospective studies.
Disclosure of conflict of interest
None.
Address correspondence to: Dr. Yan Guo, Depart- ment of Radiology, The First Affiliated Hospital of Sun Yat-sen University, 58 Zhongshan Road II, Guangzhou, Guangdong, China. Tel: +86 (20)-87755766-8471; Fax: +86 (20)-87615805; E-mail: [email protected]
References
[1] Kim CK, Park BK, Kim B. High-b-value diffu-sion-weighted imaging at 3 T to detect prostate cancer: comparisons between b values of 1,000 and 2,000 s/mm2. AJR Am J Roentgen-ol 2010; 194: W33-W37.
[2] Rouviere O, Glas L, Girouin N, Mège-Lechevalli-er F, Gelet A, Dantony E, Rabilloud M, Chapelon JY, Lyonnet D. Prostate cancer ablation with transrectal high-intensity focused ultrasound:
assessment of tissue destruction with con-trast-enhanced US. Radiology 2011; 259: 583-591.
[3] Akduman B, Barqawi AB, Crawford ED. Mini-mally invasive surgery in prostate cancer: cur-rent and future perspectives. Cancer J 2005; 11: 355-361.
[4] Kundra V, Silverman PM, Matin SF, Choi H. Im-aging in oncology from the University of Texas M. D. Anderson Cancer Center: diagnosis, staging, and surveillance of prostate cancer. AJR Am J Roentgenol 2007; 189: 830-844. [5] Shukla-Dave A, Hricak H, Eberhardt SC, Olgac
S, Muruganandham M, Scardino PT, Reuter VE, Koutcher JA, Zakian KL. Chronic prostatitis: MR imaging and 1H MR spectroscopic imaging findings--initial observations. Radiology 2004; 231: 717-724.
[6] Gibbs P, Pickles MD, Turnbull LW. Diffusion im-aging of the prostate at 3.0 tesla. Invest Radiol 2006; 41: 185-188.
[7] Tamada T, Sone T, Jo Y, Toshimitsu S, Yamashi-ta T, Yamamoto A, Tanimoto D, Ito K. Apparent diffusion coefficient values in peripheral and transition zones of the prostate: comparison between normal and malignant prostatic tis-sues and correlation with histologic grade. J Magn Reson Imaging 2008; 28: 720-726. [8] Sato C, Naganawa S, Nakamura T, Kumada H,
Miura S, Takizawa O, Ishigaki T. Differentiation of noncancerous tissue and cancer lesions by apparent diffusion coefficient values in transi-tion and peripheral zones of the prostate. J Magn Reson Imaging 2005; 21: 258-262. [9] Kim CK, Park BK, Han JJ, Kang TW, Lee HM.
Diffusion-weighted imaging of the prostate at 3 T for differentiation of malignant and benign tissue in transition and peripheral zones: pre-liminary results. J Comput Assist Tomogr 2007; 31: 449-454.
[10] Hosseinzadeh K, Schwarz SD. Endorectal dif-fusion-weighted imaging in prostate cancer to differentiate malignant and benign peripheral zone tissue. J Magn Reson Imaging 2004; 20: 654-661.
[11] Sasaki M, Yamada K, Watanabe Y, Matsui M, Ida M, Fujiwara S, Shibata E; Acute Stroke Im-aging Standardization Group-Japan (ASIST-Ja-pan) Investigators. Variability in absolute ap-parent diffusion coefficient values across dif-ferent platforms may be substantial: a multivendor, multi-institutional comparison study. Radiology 2008; 249: 624-630.
[13] Papanikolaou N, Gourtsoyianni S, Yarmenitis S, Maris T, Gourtsoyiannis N. Comparison be-tween two-point and four-point methods for quantification of apparent diffusion coefficient of normal liver parenchyma and focal lesions. Value of normalization with spleen. Eur J Radi-ol 2010; 73: 305-309.
[14] Park SO, Kim JK, Kim KA, Park BW, Kim N, Cho G, Choi HJ, Cho KS. Relative apparent diffusion coefficient: determination of reference site and validation of benefit for detecting meta-static lymph nodes in uterine cervical cancer. J Magn Reson Imaging 2009; 29: 383-390. [15] Lim HK, Kim JK, Kim KA, Cho KS. Prostate
can-cer: apparent diffusion coefficient map with T2-weighted images for detection--a multiread-er study. Radiology 2009; 250: 145-151. [16] Desouza NM, Reinsberg SA, Scurr ED,
Brews-ter JM, Payne GS. Magnetic resonance imaging in prostate cancer: the value of apparent diffu-sion coefficients for identifying malignant nod-ules. Br J Radiol 2007; 80: 90-95.
[17] Haider MA, van der Kwast TH, Tanguay J, Ev-ans AJ, Hashmi AT, Lockwood G, Trachtenberg J. Combined T2-weighted and diffusion-weight-ed MRI for localization of prostate cancer. AJR Am J Roentgenol 2007; 189: 323-328. [18] Manenti G, Squillaci E, Di Roma M, Carlani M,
Mancino S, Simonetti G. In vivo measurement of the apparent diffusion coefficient in normal and malignant prostatic tissue using thin-slice echo-planar imaging. Radiol Med 2006; 111: 1124-1133.
[19] Issa B. In vivo measurement of the apparent diffusion coefficient in normal and malignant prostatic tissues using echo-planar imaging. J Magn Reson Imaging 2002; 16: 196-200. [20] Mulkern RV, Barnes AS, Haker SJ, Hung YP,
Ry-bicki FJ, Maier SE, Tempany CM. Biexponential characterization of prostate tissue water diffu-sion decay curves over an extended b-factor range. Magn Reson Imaging 2006; 24: 563-568.
[21] Bilgili Y, Unal B. Effect of region of interest on interobserver variance in apparent diffusion coefficient measures. AJNR Am J Neuroradiol 2004; 25: 108-111.
[22] Tamada T, Sone T, Toshimitsu S, Imai S, Jo Y, Yoshida K, Yamamoto A, Yamashita T, Egashira N, Nagai K, Fukunaga M. Age-related and zonal anatomical changes of apparent diffusion co-efficient values in normal human prostatic tis-sues. J Magn Reson Imaging 2008; 27: 552-556.
[23] Jacobs MA, Ouwerkerk R, Petrowski K, Macura KJ. Diffusion-weighted imaging with apparent diffusion coefficient mapping and spectrosco-py in prostate cancer. Top Magn Reson Imag-ing 2008; 19: 261-272.