Eur Abstr Des transp their perfor studie from tools indica Keyw 1 In Man good supp comp atten fact, there goal resea supp mana shou Corr ropean Tran
How d
perform
Department o ractspite of its or port and logis performance rmance assess es have been m
the definition used to evalu ators used to a
ords: Supply
1. Introdu
the last yea agement (S ds, in fact, ly chain c pany. For ntion from a aims at as efore help c
of custom arch in the ly chain pe agement wh uld consider responding au
nsport \ Tras
do you e
mance?
of Civil and E
rigins, logistic stics activities strongly in sment system made on SC p ns of logistics uate supply c assess logistics
Chain Manag
ction
ars, the need SCM) and
represent t osts and th this reason academics, c
ssisting ma ompanies to mer satisfac
field of SC erformance hich aims a r an holisti uthor: Daniela
sporti Europ
evaluat
? A revi
in
Dan
Environmental
cs concept is t s are more an nfluence cust is so essential erformance as and supply c chain perform s performance
gement; Suppl
d to define distribution the essentia heir poor m n, it was b
consultants, anagers in o survive un
tion. Over CM which l
measurem at achieving c approach
Paddeu (dani
pei (2016) I
te logist
ew of th
ndicator
niela Padd
l Engineering Cagliari,Italy
today strictly d more respo tomer loyalty l for the finan ssessment and hain, this pap mance. In parti
e.
y Chain Perfo
a tool to su n arose. Lo al compone managemen born the SC
, profession the manag nder the con
the past d leads, amon ment (SCPM g the busine h to evaluat
iela.paddeu@u
Issue 61, Pa
tics and
he main
rs
deu
and Architect yrelated to com onsible for the
y. An efficie ncial wellness
d they have b per presents a icular, it focu
ormance; Perfo
upport busin ogistics, tra ents of SCM nt could un
CM, which nals and bus
ement of t nstant press decade, the ng others, t M), essentia ess success. te SC proce
unica.it)
aper n° 4, IS
supply
n metho
ture, Universi
mmercial acti e success of a ent and upd of a business. een all carried
review of the uses on the an
formance Asse
nesses with ansport and M; they str ndermine th h has recen
siness leade the supply sure to achi ere has bee
to the defin al for an ef Supply ch esses perfo
SSN 1825-3
y chain
ods and
ty of Cagliari,
ivities. In part a company, b dated supply
. However, no d out lately. S e main metho nalysis of the
essment; Revi
hin Supply C d distributio
rongly influ he success ntly gained ers. The SC
activities, functions and systems should be integrated for a success management of the SC (Vickery et al., 2003). Stevens (1989) and Tan et al. (1998) showed that integrated business processes create value for the firm’s customers. For these reasons, the SC should be considered as the whole within the performance assessment process. Based on an in-depth study of the literature published in the field of SCM (in particular on SCPM), with this paper the author aims to review the main methods and tools developed, in order to provide a framework which allows choosing the best tool to measure and monitor the performance of the logistics and transport processes, thus to help managers in the decision process.
2. Logistics versus Supply Chain Management
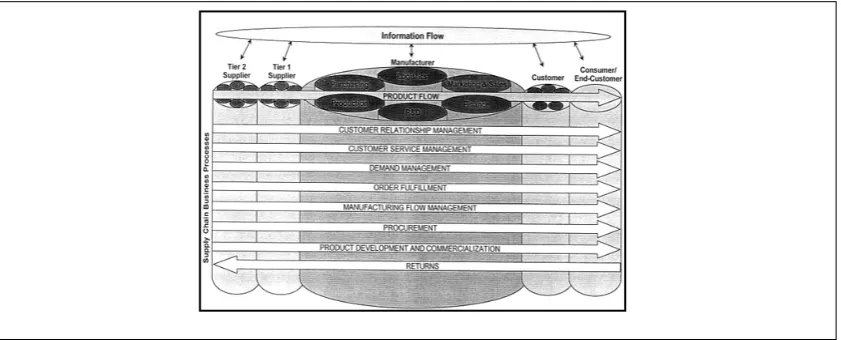
Nowadays logistics can be considered a branch of engineering which creates “people systems” rather than “machine systems” (Islam et al., 2013) and it is strictly related to the evaluation and optimization of times and costs related to processes and services of commercial activities. In fact, logistics can be considered the science that studies the management of the supply chain as the whole, which includes supply of raw materials, production processes, warehousing and goods transport from one point to another one. Despite of this modern concept of logistics, it is worth noting that the term “logistics” finds its origins in the ancient Greece, exactly in the military discipline. There were a specific department of the army that was responsible for providing the necessary weapons, ammunition and rations when they were needed (Islam et al., 2013). On the other hand, the term “Supply Chain Management” was introduced at the beginning of the ‘80s (Cooper et al., 1997) and it started drawing the attention of the researchers at the beginning of the ‘90s. Actually, SCM interested not only the marketing and business world, but also the world of scientific literature (Lambert et al., 2000). But, what is the difference between logistics and SCM? It is very thin. In fact, till few time ago, SCM was considered as the logistics related to the external stakeholders: suppliers and customers. For this reason, in 1998, the Council of Logistics Management (CLM) provided a new definition for logistics: ‘‘that part of the supply chain process that plans, implements, and controls the efficient, effective flow and storage of goods, services, and related information from the point of origin to the point of consumption in order to meet customers’ requirements ’’ (Cooper et al., 1997). On the other hand, the Global Supply Chain Forum (GSCF), a group of non-competing firms and a team of academic researchers, provided a definition for SCM, which was defined as: “the integration of key business processes from end user through original suppliers that provides products, services, and information that add value for customers and other stakeholders”. With the latter definition, therefore, not only products’ flows, but also information flows, stakeholders integration and management are considered. The GDCF also defined the 8 key supply chain processes (Figure 1):
1.Customer relationship management; 2.Customer service management; 3.Demand management;
4.Order fulfilment;
European Transport \ Trasporti Europei (2016) Issue 61, Paper n° 4, ISSN 1825-3997
[image:3.595.90.511.124.294.2]7.Product development and commercialization; 8.Returns.
Figure 1: Supply chain management: integrating and managing business processes across the supply chain.
Source: Cooper et al., 1997.
3. The concept of measure and the performance measurement in the Supply
Chain
An effective system of performance measurement allows making decisions and undertaking actions in order to make the evaluator able to quantify the efficiency and effectiveness of past actions through the collection, selection, analysis, interpretation and dissemination of suitable data (Neely et al., 2001). The performance measurement is defined as the process that quantifies the efficiency and effectiveness of the action (Neely et al., 1995). Effectiveness is the measure to which customer needs are met, while the cost-efficiency measures as the company's resources are used to achieve a predetermined level of customer satisfaction (Agami et al., 2012). In the last years, researchers have deeply studied supply chain performance measurement - SCPM (Agami et al., 2012). Performance assessment is an important and essential tool to successfully manage the supply chain (Gunasekaran et al., 2001) and the lack of a suitable assessment represents the main obstacle to an efficient supply chain management (Lai et al., 2002). The design and development of a SCPM system implies various difficulties because it represents a tool that generally leads to a company organizational change. As said by Agami et al. (2012), in their review of the main methods used to measuring SC performance, according to leading researchers in this field (Beamon, 1999; Keebler, 2001; Gunasekaran et al, 2004; Tangen, 2004; Ramaa et al, 2009; Akyuz and Erkan, 2010; Kurien and Qureshi, 2011), an effective SCPM should be characterized by:
1.“Wholeness”: it must cover all supply chain aspects and processes;
2.“Universality”: should allow comparison of performance over time and under different operating conditions;
3.“Measurability”: the output should be a quantitative measure;
The choice of the right measurement system represents an important problem. In fact, the most appropriate measure should not only provide an indication of the actual distance of the company from its objectives, but should also provide a means to define its strategy and encourage its implementation (Agami et al., 2012). In the literature there are several works related to the definition of the more appropriate measurement system. According to Gunasekaran et al. (2004), a measurement system shall be used along the SC and have to be "balanced", i.e. it must consider both financial and non-financial indicators that can be classified at strategic, tactical and operational levels. The SC performance measurement (SCPM), thus allows evaluating in both qualitative and quantitative terms if a supply chain is working well or not. The performances of a company have always been assessed through different measurement systems, which evolved over the centuries. Before the nineteenth century, performance measurements were expressed in terms of financial indicators related with the amount of product sold or purchased (for example: cost per ton, cost per kilo, and so on). In the twentieth century, the company DuPont (1903) defined the "Rate of Return on Investment" (ROI - Return on Investment) to evaluate the performance of different units and so they developed the "DuPont System Scale", which has been widely adopted later. Since then, the financial indicators have become the most widely used method for measuring performance (Parker, 2000). After World War II, the climate of uncertainty has meant the birth of the need to balance marketing relationships, research and development, human resources and finance (Kurien and Qureshi, 2011). For these reasons, companies started using both financial and non-financial indicators. However, before the '80s, there was a tendency to still use traditional accounting systems with pure financial guidance. They relied only on quantitative generic financial parameters, ignoring any other important not financial indicator: such as the quality of service or customer loyalty. In the first following decade, these accounting systems have been strengthened and their application has been extended to the evaluation of specific processes and tasks within the supply chain. In the early 90's, Kaplan and Norton (1992) developed the Balanced Scorecard model (BSC), which represents the introduction of the concept of mixed systems for the first time. As widely pointed out by the literature (Kurien and Qureshi, 2011; Lapide, 2000), despite the financial measures are important to evaluate the financial health of a company, they are insufficient to measure the performance of the supply chain. Indeed, they tend to give short-term measures, which focus on the inner vision of the company and are focused on historical data. They also do not make reference to important strategic non-financial performance indicators such as customer satisfaction and the quality of the product and are not directly related to the measure of operational effectiveness and efficiency.
4. Performance measurement models
Performance measurement is critical to improve the effectiveness and efficiency of a company (Beamon, 1999) and of the supply chain (Shepherd and Günter, 2006). The literature review showed the most used models for the measurement of logistics performance are the following:
1.Key Performance Indicators (KPIs); 2.Balanced Scorecard (BSC) model;
European Transport \ Trasporti Europei (2016) Issue 61, Paper n° 4, ISSN 1825-3997
4.Performance Prism model;
5.Supply Chain Operations Reference (SCOR) model.
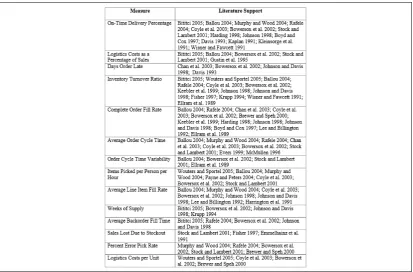
4.2 Key Performance Indicators (KPIs)
Figure 1. Example of SC performance indicators
Source: Griffis et al., 2007
4.3Balanced ScoreCard (BCS)
Another important model for SC performance assessment is the Balanced Scorecard model (BCS), introduced by Kaplan and Norton (Kaplan and Norton, 1992); it proposes a balanced approach between financial measures and non-financial measures. Kaplan and Norton believed that the traditional financial measures (i.e. the indicator on return on investment - ROI) would offer an incomplete framework of the corporate performance and that did not provide a tool for continuous improvement and innovation. They argued instead the criteria for performance evaluation should also include non-financial indicators, which would consider customers, internal processes and learning and growth processes. These indicators are very important for the competitiveness of a company; in fact, they allow managers to consider all measures of performance and to assess whether it is possible to achieve improvement in a specific area, without affecting the performance of other areas (Wu and Chang, 2012). The BSC has been widely applied to many services sectors, such as banking (Beechey and Garlick, 1999), various commercial activities, such as customer relationship management (Kim et al., 2006) and the supply chain management - SCM (Brewer and Speh, 2000). However, there are few studies that investigate the potential application of BSC to SC performance evaluation with respect to the external relations (Wu and Chang, 2012).
4.4Business Excellence Model (EFQM)
European Transport \ Trasporti Europei (2016) Issue 61, Paper n° 4, ISSN 1825-3997
European Foundation for Quality Management to help businesses to be more competitive. The model provides a non-prescriptive framework based on nine criteria:
Five are called "enablers" and reflect the tasks carried out by the company;
Four are called "results" and reflect on what the company achieves.
[image:7.595.86.512.212.358.2]Results are strongly dependent on enablers criteria. This model is usually used as a tool of quality control, so it has not to be limited to the evaluation of SC performance (Figure 3).
Figure 2. Business Excellence Model.
Source: McAdam, R. Business Excellence Model. Wiley Encyclopedia of Management
4.5Performance Prism
The Performance Prism is designed to meet the needs of a business in a dynamic environment, in which variables and processes often change over time. This model considers the relationships between the different actors involved in the SC and the processes and activities they carry out within the SC. The stakeholders are the core of the model, which considers five different (but related with each other) performance perspectives (Neely et al., 2012):
1.Stakeholders satisfaction; 2.Strategies;
3.Processes; 4.Ability;
5.Stakeholders contribution.
However, despite being the model that considers more the contribution of stakeholders, this limits it in terms of effectiveness measurement; it offers few, if any, guidance as to the attributes should be identified and performance to be selected (Neely et al. 2012).
4.6Supply Chain Operations Reference (SCOR)
model for the management of the processes that characterize the supply chain (Hwang et al., 2008). It enables companies to analyze the performance of their supply chain in a systematic way by improving communication between the various members of the chain, while, at the same time, optimizing the network and the performance of each region and then of the supply chain as a whole. The model has a hierarchical structure characterized by three levels, for each of which processes and KPIs (shared into the areas: reliability, responsiveness, flexibility, cost and resources) are defined with a level of detail which increases from level 1 to level 3. The processes associated with each level are:
1.Source, ordering and receiving raw materials and products;
2.Make, manufacturing, producing, repairing, modifying or recycling materials and products;
3.Deliver, receiving, programming, taking, packing and delivering products that are ordered by customers;
4.Return, managing the logistics of returning products and goods not suitable for sale and packaging.
There is also another process, Plan, which involves all the previous processes. For each process it is also possible to identify three different decision levels: strategic, tactical and operational, corresponding respectively to the long (years), medium (months) and short (days) period (Souza, 2014).
5. Statistics analysis for supply chain performance assessment
Eur towa cons asses (Vick Garc 6 The supp the f citati and rifer ques perfo (Figu follo summ autho Fig Fig ropean Tran
ard the bra tructs. For ssment to e kery et al., cía-Alcaraz
6. Summar
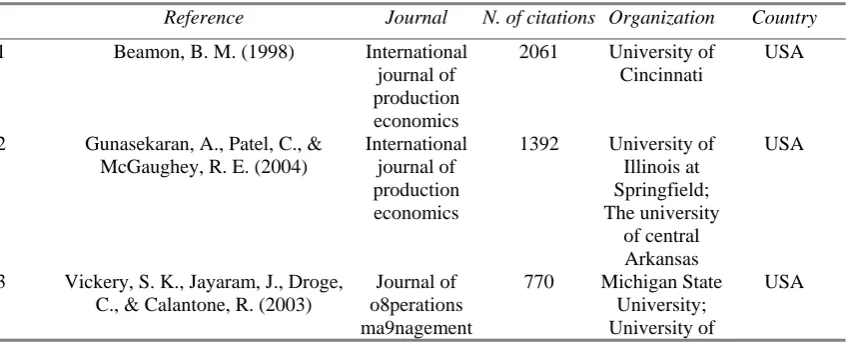
author sele ply chain pe first place ions are con
Figure 5).
rimento no
tionnaires. ormance an ure 6). Al owed by "f mary of the ors of the se
gure 3. Geogra
gure 4. Rankin
nsport \ Tras
and") rathe its charact explain dire , 2003; Wis et al., 2015
ry of the m
ected the f erformance
if both th nsidered (F Case study
on è stata
Moreover, nalysis are so, the mo financial pe
e methodol elected pap
aphic location
ng of citations Sw Italy 4% Switzerland 4% Taiwan 4% USA 29% 4976 901 sporti Europ
r than on teristics, SE ect and ind
sner, J. D., 5).
most relevan
following p evaluation he geograph Figure 4Err
y analysis (
trovata.) a , in the m
carried by ost used v erformance" logy used f pers.
of the researc
by country Argentina 4% weden 4% d 326 225 7
pei (2016) I
the manife EM it has b irect relatio , 2003; Fug
nt contribu
papers as th n, published
hic location
rore. L'orig
half of the are carried ost of the means of variable to " and "cus for perform
ches
.
73 73 59
Issue 61, Pa
fest variabl been applie onships am gate et al.,
utions from
he most sig d on interna n of the st
gine riferim
sample in out by co cases con statistics m
performan tomer" (Fi mance analy Chin 9% Spain 8%
50 39 1
aper n° 4, IS
es used to ed also to S mong perform
2010; Gar
the scienti
gnificant p ational jour tudies and
mento non
Table 1Er
ollecting da sidered, da methods an nce assessm
gure 7). T ysis and ass
a Egypt 4% India 9% Iran 8% Mexico 13%
12 8 8
SSN 1825-3
o measure SC perform
mance vari cía et al., 2
ific literatu
papers relat rnals. USA the numb
è stata tro rrore. L'or
ata by mea ata analysis nd SCOR m ment is "co Table 2 sho
Figure 5. Summary of the methodology used for data analysis
Figure 6. Variables used for performance assessment
Table 1:Summary of the most relevant contributions from the scientific literature Reference Journal N. of citations Organization Country
1 Beamon, B. M. (1998) International journal of production economics
2061 University of Cincinnati
USA
2 Gunasekaran, A., Patel, C., & McGaughey, R. E. (2004)
International journal of production economics
1392 University of Illinois at Springfield; The university
of central Arkansas
USA
3 Vickery, S. K., Jayaram, J., Droge, C., & Calantone, R. (2003)
Journal of o8perations ma9nagement
770 Michigan State University; University of
USA
0 5 10 15 20
Descriptive Statistics Structural Equation Modeling …
SCOR Literature review Balanced ScoreCard Benchmarking KPIs What‐if Scenarios Cycle quality network model; Analytic Network Process / … Analytic Network Process; / … Fuzzy Game theory
Time
11% Sustainability 2%
Quality 6%
Production 2% Financial
Performance 13%
Level of
service 2% Lean/Agile SC
2%
Inventory 6% Information
technologies 2% HR
4% Stakeholders
Management 9% Order
Management 2% Flexibility
9% Costs
15% Deliveries
2%
[image:10.595.87.512.581.753.2]European Transport \ Trasporti Europei (2016) Issue 61, Paper n° 4, ISSN 1825-3997
South Carolina 4 Agarwal, A., Shankar, R., & Tiwari,
M. K. (2006)
European Journal of Operational
Research
463 Indian Institute of technology;
National Institute of Forged and Foundry Technology
India
5 Bhagwat, R., & Sharma, M. K. (2007)
Computers & Industrial Engineering
438 J.N.V. University
India
6 Gunasekaran, A., & Kobu, B. (2007) European Journal of Operational
Research
380 University of Massachusetts
Dartmouth
USA
7 Wisner, J. D. (2003) Journal of Business Logistics
344 University of Nevada
USA
8 Fleisch, E., & Tellkamp, C. (2005) International journal of production economics
326 University of St. Gallen
Switzerland
9 Cai, J., Liu, X., Xiao, Z., & Liu, J. (2009)
Decision Support Systems
199 Peking University
China
10 Fugate, B. S., Mentzer, J. T., & Stank, T. P. (2010).
Journal of Business Logistics
89 Colorado State University ; University of
Tennessee
USA
11 Persson, F., & Araldi, M. (2009) Journal of Production Economics
73 Linköping Institute of Technology; University of
Parma
Sweden; Italy
12 Griffis, S. E., Goldsby, T. J., Cooper, M., & Closs, D. J. (2007).
Journal of business logistics
70 Air Force
Institute of Technology; University of Kentucky; The
Ohio State University; Michigan State
University
USA
13 Hwang, Y. D., Lin, Y. C., & Lyu, J. (2008)
International journal of production economics
50 Leader University;
National Cheng Kung
University
Taiwan
14 Naini, S. G. J., Aliahmadi, A. R., & Jafari-Eskandari, M. (2011)
Resources, Conservation and Recycling
49 University of science and techonology
Iran
15 Garcia, F. A., Marchetta, M. G., Camargo, M., Morel, L., &
Forradellas, R. Q. (2012)
International journal of production economics
39 National University of Cuyo; Institut
National Polytechnique
de Lorraine
16 Xiao, R., Cai, Z., & Zhang, X. (2009) Progress in Natural Science 26 Huazhong University of Science and Technology; Wright State University China; USA
17 Shafiee, M., Lotfi, F. H., & Saleh, H. (2014)
Applied mathematical
modelling
10 Islamic Azard University
Iran
18 Agami, N., Saleh, M., & Rasmy, M. (2012) Journal of Organizational Management Studies 8 Cairo University Egypt
19 García, J. L., Rivera, L., Blanco, J., Jiménez, E., & Martínez, E. (2014)
International Journal of Production Research 4 Autonomous University of Ciudad Juarez; University of la Rioja Mexico; Spain
20 Palma-Mendoza, J. A. (2014) International Journal of Information Management 4 Instituto Tecnologico Autonomo de Mexico Mexico
21 García-Alcaraz, J. L., Prieto-Luevano, D. J., Maldonado-Macías,
A. A., Blanco-Fernández, J., Jiménez-Macías, E., &
Moreno-Jiménez, J. M. (2015)
International Journal Adv Manuf Technol 4 Autonomous University of Ciudad Juarez; University of la Rioja Mexico; Spain
22 Souza, G. C. (2014) Business Horizons
3 Indiana University
[image:12.595.88.518.466.758.2]USA
Table 2: Review of the methodology used Reference Data collection
method
Type of model Performance measurement
Case Study
Beamon, B. M. (1998) - Literature review
Costs; Customers; Responsiveness; Time; Flexibility Gunasekaran, A., Patel, C., &
McGaughey, R. E. (2004)
Questionnaire (ranking: low important-to-high
important)
SCOR; - -
Vickery, S. K., Jayaram, J., Droge, C., & Calantone, R.
(2003)
Questionnaires (mail); telephone calls; To the CEO
of the organization Correlation analysis; factorial analysis; Cronbach's alpha; Structural equativo models (SEM); Path models; Descriptive statistics Financial performance; Information technologies; Supply chain integration; Customers Automotive Industry Action Group (AIAG)
Agarwal, A., Shankar, R., & Tiwari, M. K. (2006)
Questionnaires to experts' opinion Analytic Network Process; Correlation
Lead time; Costs; Quality; level of service; Lean/Agile
SC;
European Transport \ Trasporti Europei (2016) Issue 61, Paper n° 4, ISSN 1825-3997
analysis Bhagwat, R., & Sharma, M. K.
(2007) - Balanced ScoreCard; Orders; customers; deliveries; Financial performance; costs Manufacturing: 2 SME (India)
Gunasekaran, A., & Kobu, B. (2007)
- Literature review
- -
Wisner, J. D. (2003) Questionnaires - Likert scale Structural equation models (SEM); Hypothesis test; Cronbach's alpha; model fit test; Supplier management; Customers; Supply
chain Management
1,000 manufacturing firms and 2,000
service firms
Fleisch, E., & Tellkamp, C. (2005) - ANOVA; Hypothesis test; Simulation Financial performance; costs; Inventory Retail (supermarket)
Cai, J., Liu, X., Xiao, Z., & Liu, J. (2009)
Employees and Managers Interviews and Questionnaires
SCOR; KPIs; Correlation analysis; Activity Based Costing; Costs; Financial performance; Customers; flexibility Retail (electronic)
Fugate, B. S., Mentzer, J. T., & Stank, T. P. (2010)
Questionnaire - Likert Scale Descriptive statistics; Hypothesis test; Structural Equation Models (SEM); Efficiency, Effectiveness; -
Persson, F., & Araldi, M. (2009) SCOR; Simulation
("what if" scenarios)
Manufacturing: Ericsson; Autoliv
Griffis, S. E., Goldsby, T. J., Cooper, M., & Closs, D. J.
(2007). Questionnaires - Likert scale KPIs; Hypothesis test (Hotelling T2 test) Time; Costs; Inventory; Order; -
Hwang, Y. D., Lin, Y. C., & Lyu, J. (2008)
Questionnaires - Likert scale SCOR; Regression models; Cronbach's alpha; - Manufacturing:TFT-LCD industry
Naini, S. G. J., Aliahmadi, A. R., & Jafari-Eskandari, M. (2011)
- Balanced ScoreCard;
Game theory;
- Automotive: SAIPA (Iran) the biggest
auto maker Garcia, F. A., Marchetta, M. G.,
Camargo, M., Morel, L., & Forradellas, R. Q. (2012)
Questionnaires KPIs; Benchmarking;
SCOR
KPIs with respect to the following areas: 1) quality; 2)
timeliness; 3) Logistics costs; 4)
productivity and capacity
Food industry: (wine production)
Xiao, R., Cai, Z., & Zhang, X. (2009)
- SCOR; Cycle
Shafiee, M., Lotfi, F. H., & Saleh, H. (2014)
- Balanced ScoreCard;
DEMATEL; Data Envelopment
Analysis;
Financial performance;
Efficience; Flexibility; Quality&Security;
Customers
Food industry: 22 SC Iranian food
industries
Agami, N., Saleh, M., & Rasmy, M. (2012)
- Literature review
- -
García, J. L., Rivera, L., Blanco, J., Jiménez, E., & Martínez, E.
(2014)
Questionnaires Structural Equation Models (SEM);
descriptive statistics;
factorial analysis; Cronbach's
alpha;
relationships management;
suppliers management; HR ;
Just-in-time; Inventory; Productivity;
Manufacturing: assembly factory
(maquilladores, Mexico)
Palma-Mendoza, J. A. (2014) SCOR; Analytical Hierarchy Process (AHP);
- -
García-Alcaraz, J. L., Prieto-Luevano, D. J.,
Maldonado-Macías, A. A., Blanco-Fernández, J., Jiménez-Macías,
E., & Moreno-Jiménez, J. M. (2015)
Questionnaires - Likert scale
Descriptive statistics; Cronbach's
alpha; Structural
Equation Models (SEM);
Hypothesis test; regression
models; Path analysis
HR; Production processes; Inventory; Financial performance
-
Souza, G. C. (2014) - Literature review; SCOR
- -
7. Conclusions
Based on several studies examined, the literature review on SCM showed that the effective management of the SC helps companies to acquire customers and to improve the level of service offered. However, improving the performance of a company is not simple (Gunasekaran et al., 2004).
European Transport \ Trasporti Europei (2016) Issue 61, Paper n° 4, ISSN 1825-3997
There is also a gap between research and application in measuring and improving SC performance (Cai et al., 2009). Also, the performance indicators are often chosen depending on the opinions expressed by experts in the field (by means of questionnaires in which it is asked to rate the usefulness of an indicator rather than another on the basis of a scale - Likert-type scales) rather than on a rigorous scientific evaluation that proved the real effectiveness (Griffis et al., 2007; García-Alcaraz et al., 2015; Hwang et al., 2008; Wisner, 2003; Gunasekaran et al., 2004).
There exists so the need to define a universally valid framework, that identifies the variables that most influence on the overall performance of the SC, and thus a tool which allows evaluating and monitoring them over time, and so making decision with the aim to optimize SC processes and improve SC performance.
References
Agami, N., Saleh, M. and Rasmy, M. (2012). “Supply chain performance measurement approaches: Review and classification”, Journal of Organizational Management Studies, 1-20.
Beamon, B.M. (1999). “Measuring supply chain performance”, International Journal of Operations & Production Management, 19 (3), pp. 275–292
Beechey, J. and Garlick, D. (1999). “Using the balanced scorecard in banking”.
Australian Banker,113, 28-31.
Brewer, P. C. and Speh, T. W. (2000). “Using the balanced scorecard to measure supply chain performance”, Journal of Business logistics. R.S.
Kaplan, D.P. Norton, (1992). “The balanced scorecard-measures that drive performance”. Harvard Business Review, 70 (1) 71–79.
Cai, J., Liu, X., Xiao, Z. and Liu, J. (2009). “Improving supply chain performance management: A systematic approach to analyzing iterative KPI accomplishment”,
Decision Support Systems, 46(2), 512-521.
Cooper, M.C., Lambert, D.M., Pagh J.D. (1997). “Supply Chain Management: More Than a New Name for Logistics”, The International Journal of Logistics Management, 8 (1), pp. 1–14
Frazelle, E.H. (2002). Supply Chain Strategy The Logistics of Supply Chain Management. Mc Graw-Hill.
Garcia, F. A., Marchetta, M. G., Camargo, M., Morel, L. and Forradellas, R. Q. (2012). “A framework for measuring logistics performance in the wine industry”,
International Journal of Production Economics, 135(1), 284-298.
Gunasekaran, A., Patel, C. and McGaughey, R. E. (2004). “A Framework for Supply Chain Performance Measurement”, International Journal of Production Economics, 87(3), 333-347.
Gunasekaran, A., Patel, C. and Tittiroglu, E. (2001). “Performance Measures And Metrics in a Supply Chain Environment”, International Journal of Operations and Production Management, 2(1-2), 71–87.
Islam, D. M. Z., Meier, J. F., Aditjandra, P. T., Zunder, T. H. and Pace, G. (2013). “Logistics and supply chain management”, Research in Transportation Economics, 41(1), 3-16.
Kaplan, R. S. and Norton, D.P. (1996). “Linking the balanced scorecard to strategy”,
California management review, 39(1).
Kaplan, R.S. and Norton, D.P. (1996). “Using the balanced scorecard as a strategic management system”, Harvard business review, 74(1), 75-85.
Kim, D., Cavusgil, S.T., Calantone, R.J. (2006). “Information system innovations and supply chain management: channel relationships and firm performance”, Journal of the Academy of Marketing Science 34 (1) 40–54
Kurien, G. P. and Qureshi, M. N. (2011). “Study of Performance Measurement Practices in Supply Chain Management”, International Journal of Business Management and Social Sciences, 2(4), 19-34.
Lai, K., Ngai, E. W. T. and Cheng, T. C. E. (2002). “Measures for Evaluating Supply Chain Performance in Transport Logistics”, Journal of Transportation Research: Part E, 38(6), 439-456.
Lambert, D. M. And Cooper, M. C. (2000). “Issues in supply chain management”,
Industrial marketing management, 29(1), 65-83.
Lapide, L. (2000). “What about Measuring Supply Chain Performance?” AMR Research, ASCET - White Paper, 2(15), 287-297.
Neely, A., Adams, C. and Crowe, P. (2001). “The Performance Prism in Practice”,
Journal of Measuring Business Excellence, 5(2), 6 -13.
Neely, A., Gregory, M. and Platts, K. (1995). “Performance Measurement Systems Design: A Literature Review and Research Agenda”, International Journal of Operations and Productions Management, 15(4), 80-116.
Parker, C. (2000). Performance Measurement. Work Study, 49(2), 63-66.
Shepherd, C. and Günter H. (2006). “Measuring supply chain performance: current research and future directions”, International Journal of Productivity and Performance Management, 55 (3/4), pp. 242–258
Souza, G. C. (2014). “Supply chain analytics”, Business Horizons, 57(5), 595-605. Stevens, G. (1989). “Integrating the supply chain”, International Journal of Physical
Distribution and Materials Management, 19 (8) (1989), pp. 3–8
Tan, K.C., Kannan, V.R, Handfield, R.B. (1998). “Supply chain management: supplier performance and firm performance”, International Journal of Purchasing and Materials Management, 34 (3), pp. 2–9