warwick.ac.uk/lib-publications
Original citation:Johnson, Rebecca E., Grove, Amy L. and Clarke, Aileen (2017) Pillar integration process : a joint display technique to integrate data in mixed methods research. Journal of Mixed Methods Research .doi:10.1177/1558689817743108
Permanent WRAP URL:
http://wrap.warwick.ac.uk/95495 Copyright and reuse:
The Warwick Research Archive Portal (WRAP) makes this work by researchers of the University of Warwick available open access under the following conditions. Copyright © and all moral rights to the version of the paper presented here belong to the individual author(s) and/or other copyright owners. To the extent reasonable and practicable the material made available in WRAP has been checked for eligibility before being made available.
Copies of full items can be used for personal research or study, educational, or not-for profit purposes without prior permission or charge. Provided that the authors, title and full bibliographic details are credited, a hyperlink and/or URL is given for the original metadata page and the content is not changed in any way.
Publisher’s statement:
Johnson, Rebecca E., Grove, Amy L. and Clarke, Aileen (2017) Pillar integration process : a joint display technique to integrate data in mixed methods research. Journal of Mixed Methods Research .doi:10.1177/1558689817743108
Copyright © 2017 The Authors Reprinted by permission of SAGE Publications. A note on versions:
The version presented here may differ from the published version or, version of record, if you wish to cite this item you are advised to consult the publisher’s version. Please see the ‘permanent WRAP url’ above for details on accessing the published version and note that access may require a subscription.
Title
Pillar Integration Process: A joint display technique to integrate data in mixed
methods research
Authors and affiliations
Dr Rebecca Johnson
Division of Health Sciences, Warwick Medical School, The University of Warwick,
Coventry, UK, CV4 7AL
Mrs Amy Grove
Division of Health Sciences, Warwick Medical School, The University of Warwick,
Coventry, UK, CV4 7AL
Professor Aileen Clarke
Division of Health Sciences, Warwick Medical School, The University of Warwick,
Coventry, UK, CV4 7AL
Contact information for the corresponding author
Dr Rebecca Johnson
Room B-162, Division of Health Sciences
Warwick Medical School,
The University of Warwick
Coventry, UK, CV4 7AL
The authors would like to acknowledge the participants who contributed to the
research project. All authors are supported by the National Institute for Health
Research (NIHR) Collaboration for Leadership in Applied Health Research and Care
West Midlands at University Hospitals Birmingham NHS Foundation Trust. AG is
also supported by the NIHR Doctoral Fellowship Programme (project number
DRF-2013-06-064). The views expressed are those of the authors and not necessarily
Abstract
Despite an emphasis on integration in mixed methods research, there remain
relatively few well-articulated integration techniques for use by researchers. We
developed the Pillar Integration Process, a transparent and rigorous four-stage
technique for integrating and presenting qualitative and quantitative findings in a joint
display. The purpose of this paper is to describe the technique and illustrate how it
was developed and applied using via two examples from health sciences. The first is
an evaluation of a health improvement program, the second is a mixed methods
systematic review to identify interacting factors which influenced decision-making in
orthopedics. Future research can provide additional evidence on the value of the PIP
technique within a mixed method approach.
Keywords
Integration, mixed methods, joint display, intervention evaluation, evidence synthesis
Word count
Interest in mixed methods research is expanding, and it has become increasingly
sophisticated in research which spans different disciplines (Creswell et al., 2011).
Greene (2007) suggested that strategies for integrated data analysis are a priority.
(Bazeley, 2009a) discussed how data integration can help to generate insights such
as the identification of subgroup characteristics, demonstrating parallels between
behavioral characteristics and scaled scores, showing the pattern of relationships
between different variables, and the identification of deviant cases within a study set.
Several authors have developed critical appraisal frameworks and methods of
assessing the quality of mixed methods research, including Onwuegbuzie and
Johnson (2006), Dellinger and Leech (2007), and Heyvaert et al. (2013), who
considered integration techniques necessary to promote methodological rigor. In
their best practice guidance, Creswell et al. (2011) described a methodological
preference for systematic integrative procedures. These include merging, connecting
and embedding described below:
merging (e.g., joint display [also referred to as a metamatrix or matrix] using
tables or figures that combine and display both quantitative and qualitative data
together);
connecting (e.g., analyzing a quantitative dataset and using the information to
inform subsequent qualitative data collection); and
embedding (e.g., a qualitative dataset of secondary priority is embedded within a
larger, primary quantitative design) (Creswell, 2003; Creswell & Clark, 2007)
Despite the rapid adoption of mixed methods, Fetters and Freshwater (2015)
whole through integration that is greater than the sum of the individual qualitative
and quantitative parts” (p.116). Yin (2006) provided insight into the challenge of
structuring integration approaches, noting particularly that “of all the procedures,
analytic integration may be the trickiest” (p.45).
Data Integration Approaches and Techniques
Creswell and Clark (2007) have described three main approaches to mixed methods
research which contain six basic study designs and four common analytical
techniques. Data integration is one part of a mixed methods analysis which can be
conducted using a broad spectrum of approaches and techniques. These are used
to blend, weave, combine and ultimately synthesize two or more types of data
together. The overall approach to data integration could utilize one of the four
common techniques highlighted below:
data transformation or conversion (i.e., transforming qualitative textual data into
quantitative numerical data, or vice versa);
visual presentation of data using a matrix or joint display (i.e., to study qualitative
and quantitative data from the same case in parallel);
following a thread (a multistage technique that aims to conduct primary analysis
of all aspects of a study, identifying key themes for further exploration and
following those key issues across other data groups within the study); and
triangulation/comparison of datasets (data are collected and analyzed separately
and then combined at the point of interpretation, checking for agreement or
disagreement between findings which examine the same phenomena) (Bazeley,
2013; Harden & Thomas, 2005; Miles & Huberman, 1994; O'Cathain et al., 2007,
2010; Teddlie & Tashakkori, 2009; Yin, 2006).
In this paper, we define the integration or mixing ‘approach’ as one that merges,
connects or embeds qualitative and quantitative procedures at some point in the
collection, analysis and interpretation of data. In contrast, we define a mixed method
analytical integration ‘technique’ as a procedure to combine or integrate findings
specifically within the analytical or interpretation stages of a study.
Visualizing Data Using Joint Displays
A key feature of data integration can be the visual presentation of data and the
synthesis or merging itself. Leaders in the field of mixed methods have called for
greater articulation of data integration methods and an increased use of joint
displays to enhance the insight of findings obtained through mixed methods
approaches (Bazeley, 2009b, 2012; Fetters & Freshwater, 2015; Guetterman et al.,
2015; O'Cathain et al., 2008; Yin, 2006).
Miles and Huberman (1994) popularized the use of joint displays and more
generally the visual presentation of data using a matrix, with other important
contributions made by Happ et al. (2006) and Bazeley (2009a). The joint display
technique to integrate data can be used when qualitative and quantitative data exist
for the same case and can be studied together (O'Cathain et al., 2010). Cases are
the units of study and can be individuals, settings, phenomena or data on the same
topic or result in an evidence synthesis.
Guetterman et al. (2015) reviewed different types of joint displays for visualizing
including: label quantitative and qualitative results; be consistent with the design and
the integration approach; and identify inferences or insights generated.
Problem to be Addressed
These examples of best practice and guidelines support increased quality in the
design, reporting and evaluation of mixed methods studies. Researchers are
encouraged to describe their integration approaches, not least to provide more
consistent and greater transparency to help develop and improve mixed methods
techniques (O'Cathain et al., 2010). However, there remain few mixed methods
studies which systematically describe each of the components of mixed methods
integration, limiting the amount of knowledge that has been gained (Fetters &
Freshwater, 2015; O'Cathain et al., 2010). Existing studies do not discuss in-depth,
replicable techniques for integrating different types of data.
Objective
In order to address the lack of specific, transparent, well-defined analytical
techniques to support the integrated joint display approach, we define and describe
the development and validation of a four-stage analytical technique for systematically
integrating qualitative and quantitative findings using a joint display format, called the
“Pillar Integration Process” (PIP). PIP aimed to minimize observer bias and maximize
opportunities for synthesis, both visually and methodologically. We illustrate the
development of this technique using two different examples from Health Sciences.
The first example originates from a multi-intervention public health improvement
program that used a mixed methods evaluation framework R. E. Johnson (2013).
decision-making in orthopedic surgery (Grove et al., 2016). We sought to incorporate the
recommendations of Guetterman et al. (2015) for best integrative practice into the
development of this technique.
Pillar Integration Process Development Example One: City Health
Improvement Program
Context: Example One
The development of PIP was underpinned by a subtle realist epistemological view
(Hammersley, 1992). This view reflects the notion that we can only know reality from
our own perspective of it. This is aligned with the pragmatic approach to mixing
methods (R. B. Johnson & Onwuegbuzie, 2004; R. B. Johnson et al., 2007).
Methods: Example One
The Pillar Integration Process was initially developed to integrate quantitative and
qualitative data collected as part of an evaluation of a City Health Improvement
Program (CHIP) (example one). This was a three year (2009-2012) funded project
jointly managed and delivered by a City Council and the National Health Service
(NHS) in a city in England (we have anonymized the location). The program aimed to
minimize the burden of poor physical and mental health, and to maximize the
benefits associated with good physical and mental wellbeing, thereby improving the
quality of life for residents of the City. The CHIP comprised nine projects, including
over 40 short-and long-term interventions. Five CHIP interventions that specifically
intervention to improve mental wellbeing in school-age young people using
‘Wellbeing Mentors’, who acted as health and wellbeing counsellors.
These five interventions were evaluated in an enhanced mixed method
approach, using a sequential explanatory design (Figure 1). It included a
before-and-after quantitative evaluation (analyzed using descriptive and inferential statistics) and
15 semi-structured qualitative interviews with evaluation and management staff to
examine their attitudes towards, and the process of, delivering the CHIP
interventions (analyzed using a thematic analysis). A joint display was used for
integration because it provided adequate methodological structure without being rigid
in defining criteria for use. It enabled us to focus on the issues surrounding each
intervention separately (O'Cathain et al., 2010). Full details of data collection and
analysis are available elsewhere (R. E. Johnson, 2013).
<Inset Figure 1 about here>
Figure 1. The individual components of the City Health Improvement Program
evaluation
Initial quantitative analysis of the Wellbeing Mentors intervention revealed
variation across settings. There were low rates of participation and high rates of
invalid data in some schools. Initial qualitative analysis revealed problematic
processes during the delivery and evaluation of the intervention that posed
challenges and barriers to public health practice (R. E. Johnson et al., 2016). Gaps
remained in our understanding of how the quantitative limitations identified in the
evaluation might have been empirically connected to the qualitative barriers that staff
step-by-step instructions for creation and analysis of a joint display. It was in this context that
we developed the Pillar Integration Process, both to expand our understanding of
these barriers (Greene et al., 1989) and to provide a more transparent explanation of
what was happening at each stage of the analytic process. Therefore, PIP was
created to integrate quantitative and qualitative data that have undergone an initial
separate analysis, for example quantitative results and qualitative findings that have
been produced, but not yet integrated.
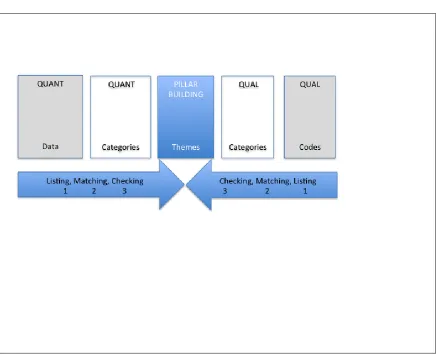
The Four Stages of the Pillar Integration Process
There are four stages to PIP (listing, matching, checking, and pillar-building) that are
completed sequentially, after the initial quantitative and qualitative analyses have
been completed separately. A blank PIP diagram is included in Figure 2 for
illustrative purposes. The arrows in Figure 2 demonstrate how the joint display is
completed from the outside columns first, working towards the central column as the
data become integrated. Either the QUANT DATA or the QUAL CODES column can
be the starting point.
<Insert figure 2 about here>
Figure 2. A generic diagrammatic representation of the Pillar Integration Process to
demonstrate column headings and direction of integration
Each stage of the process is described below, illustrated with data from the
Stage 1 Listing. Raw data (e.g., percentages, selected quotations) and coded
or grouped data (e.g., abstracted into a category, transformed into text, themes) that
the researchers consider important for inclusion in the integration are ‘listed’ in the
joint display, either in the QUANT DATA and QUANT CATEGORIES columns, or in
the QUAL CODES and QUAL CATEGORIES columns. Listing can be
comprehensive (including all codes and data identified in a prior quantitative or
qualitative analysis) or selective (including only particular codes, data or emerging
themes from an earlier analysis that warrant further investigation), depending on the
focus and purpose of the integration for which PIP is being used. Therefore, either
column can be the starting point and there is flexibility in the variety of data that can
be included in these outside columns. By the end of this stage, two of the five
columns should be completed, on one side of the PIP template.
In example one, the quantitative evaluation limitations were listed in the ‘QUANT
DATA’ column (e.g., loss to follow up, miscoded data, invalid recording, outcome
effect size). These quantitative data were then transformed, abstracted, and listed in
the ‘QUANT CATEGORIES’ column. Table 1 shows excerpts from the listing stage
of the Wellbeing Mentors intervention, which focused on problematic aspects of the
intervention delivery and evaluation.
<Insert table 1 about here>
Table 1. An example of stage 1 of PIP, using data from a Wellbeing Mentor
intervention
Stage 2 Matching. Once the relevant data have been listed in the QUANT or
display. If the researcher has first listed quantitative data in the QUANT DATA
column, then matching a list of qualitative data in the QUAL CODES column is
needed, or vice versa. During the matching stage, the researcher matches the
opposite column data reflecting content that relates to the initial listed data,
horizontally aligning similar data, and refining and organizing categories that had
been generated in the two ‘categories’ columns. Each list is organized and compared
across rows of the joint display so that the qualitative items reflect patterns, parallels,
similarities or any other relational quality with the quantitative items. This process
may produce quantitative or qualitative items that do not appear to have a matching
counterpart. Where no match is found, this column can be labeled ‘not identified’ or
left blank, so the researcher can visually identify gaps in the matched data. By the
end of stage two, the QUANT DATA, QUANT CATEGORIES, QUAL CODES and
QUAL CATEGORIES columns should be completed.
During the development of PIP in example one, in the QUAL CODES column,
we matched the qualitative data (reflecting information, context, setting and any
other content) to the QUANT DATA and QUANT CATEGORIES columns. We
identified codes and then selected quotations that reflected and/or related to our
QUANT DATA. We listed them in the QUAL CODES column. For example, interview
quotations about school autonomy were matched with quantitative data illustrating
heterogeneity between schools. Some qualitative data were left unmatched at the
end of this process. We reflected and reorganized the unmatched qualitative data to
match quantitative data, where appropriate. If no match was found, this cell was
labeled ‘not identified’. This allowed us to identify clearly any gaps in the relationship
Stage 3 Checking. Once the data are matched and the researcher is satisfied
with the accuracy of the match, the data are checked for quality purposes. All data in
the four completed outside columns need to be cross-checked for completeness to
ensure the rows are appropriately matched. Any identified gaps should be
double-checked and verified to ensure that no raw data could provide an appropriate match.
These gaps are important because they aid the identification or confirmation of
emerging patterns, and of equal importance, a lack of pattern for some listed
elements. This improves the quality of the integration. The checking stage acts as a
point in the process to step back and reflect on the emerging pattern or lack of
pattern, and consequently refine and modify the nature of the lists and how they
match across the four columns. By the end of this stage, the researcher should have
checked that all relevant data and codes are categorized and have appropriate
matches.
In example one, gaps and patterns in the data were checked for quality. Any
gaps were cross-checked with raw data for completeness to ensure the rows were
appropriately matched.
Stage 4 Pillar Building. In stage 4 the PILLAR is built in the final central
column. To build the PILLAR, the researcher compares and contrasts the findings
that have developed from the listing, matching and checking stages, and
conceptualizes the insights identified from connecting and integrating the qualitative
and quantitative columns. The researcher builds inferences about what patterns,
insights or themes have emerged and the possible explanations. They locate these
themes in the PILLAR column. The PILLAR holds the integrated themes from each
can begin to weave together a meaningful narrative from the integration of
quantitative and qualitative data.
In the development of PIP, we synthesized the evidence presented on both
‘sides’ of our investigation into the PILLAR, and showed barriers to implementing
and evaluating the Wellbeing Mentors intervention. The PILLAR was the product of
the visual and conceptual integration of our understanding. Viewing the PILLAR and
the contributing data together helped clarify the connections between rows in the
joint display (Table 2).
<Insert table 2 about here>
Table 2. An example of stage 4 of PIP, using data from a Wellbeing Mentor
intervention
Results: Example One. What the Pillar Integration Process Added to the CHIP
Evaluation
In example one, PIP enabled us to determine the crossover between empirical
evaluation limitations and barriers, and interviewee responses relating to the impact
of the barriers on intervention delivery and evaluation. Initial quantitative findings
revealed limitations in the collection of evaluation data, while the ‘matched’
qualitative data enhanced our understanding of the mechanisms that were operating
within that context: school autonomy, hierarchy, varying beliefs and approaches on
how student wellbeing should be addressed, and how the roles of the Mentors
themselves were described.
In our example, the main issue that emerged was variation across settings.
adherence to the evaluation protocol, the process of building the PILLAR helped
reveal that these empirical limitations may have originated from the beliefs and
approaches of staff members and leadership which differed between schools. Our
recommendations for practice were greatly changed in light of this knowledge. While
adherence to a protocol can simply be suggested for future practice, implementing
those changes in a context where the beliefs of school leadership and the role and
ethos of the Wellbeing Mentors are not aligned may result in the delivery of a
sub-optimal intervention. Because we identified this issue using PIP, we could instead
recommend that future intervention delivery ensure that the settings in which the
intervention is delivered have a ‘wellbeing ethos’ aligned with that of the Wellbeing
Mentor intervention.
In this example, integrating the quantitative evaluation data and the qualitative
interview excerpts aided the identification of important contextual mechanisms at
work. The process of comparing and contrasting the columns and visually centering
the PILLAR concepts allowed for greater cohesion where context, intervention
components and evaluation results could be harmonized in a methodologically
rigorous and replicable way.
Pillar Integration Process Example Two: Mixed Methods Evidence Synthesis
In order to test the external validity of the Pillar Integration Process, we applied it in a
different context to integrate data unrelated to the original PIP development datasets.
In this second example, PIP was used to integrate the findings of a mixed methods
review of the barriers and facilitators to decision-making by orthopedic surgeons
were currently available to the research team, and also to demonstrate that the PIP
can be used to integrate and synthesize secondary as well as primary data.
Context: Example Two
Previous research has highlighted variation in surgical practice across and within
geographical areas (Ferlie et al., 1999; Glover, 2008; Wennberg, 2002) and within
surgical specialties (Moritz et al., 1997; Pope, 2002) and sub-specialties (Birkmeyer
et al., 1998; Dunn et al., 2005). These studies highlighted that rates of surgical
intervention did not align with rates of disease. There are many reasons for
performing surgery and these did not always directly link to the clinical needs of the
patient (McPherson, 2008). We aimed to systematically review and summarize all
types of published literature on methods, practices, barriers and facilitators to
evidence use in decision-making within orthopedic surgery, in particular aiming to
understand potentially unjustified variation.
Methods: Example Two
We conducted a mixed methods systematic review by combining a supplementary
search technique alongside the more traditional method of systematic searching
(Chalmers & Glasziou, 2009; Papaioannou et al., 2012). We used the references of
the papers we found to identify further clusters of publications based on relevant
theory and concepts, such as 'evidence based orthopedics', in order to obtain key
papers in the field. Full details of the study aims, search strategy, inclusion and
exclusion criteria, and analysis are available elsewhere (Grove et al., 2016).
Included studies were heterogeneous in terms of methods, phenomena
care and patient outcomes, and factors that influence treatment decisions and rates
of surgery). Hence, meta-analysis of the quantitative data was not feasible. In
example two, the Pillar Integration Process was used to integrate and synthesize all
of the qualitative and quantitative studies that were identified in the systematic
review.
Stage 1 Listing. We listed all the factors in the joint display that were reported to
influence decision-making from the included papers, with each row representing one
included study. We reported the quantitative data findings in text format, using the
terms or phrases from the individual papers. This enabled us to represent the
findings as codes instead of reporting the raw data in numeric form. An excerpt is
presented in Table 3 as an example of this stage.
<Insert table 3 about here>
Table 3. Excerpt of the Pillar Integration Process stage 1 listing process for a mixed
methods evidence synthesis
We then grouped the factor codes into broader conceptual categories iteratively.
This ensured that the ‘QUANT CATEGORIES’ column represented categories of
factors (e.g., ‘patient characteristics’), which helped to avoid repetition. Citation
numbers were then listed in ‘QUANT DATA’ column to show which paper generated
each factor. In our example we completed the ‘QUANT DATA’ first, then repeated
the listing process for the qualitative data, however this could be performed in the
Stage 2 Matching. In example two, we decided to match the qualitative studies
to the quantitative studies first. Therefore, we matched factors and ‘sources of
evidence’ from the qualitative column to those already present in the quantitative
column. Where no previous factor existed we added further factors to the ‘QUANT
CATEGORIES’ column to produce a group of qualitative factors not yet matched to
quantitative factors.
Stage 3 Checking. We ensured the validity of matches by checking
qualitative studies for references to factors identified from quantitative studies, and
vice versa. We checked for empty cells where no match had been made between
‘QUANT CATEGORIES’ and ‘QUAL CATEGORIES’. We cross-checked the original
study data to see if there should be a match (e.g. assessing whether categories
should be collapsed or were really standalone categories). The checking stage helps
to maintain a high quality standard of integration.
Stage 4 Pillar Building. We inspected the completed factor columns
(‘QUANT CATEGORIES’ and ‘QUAL CATEGORIES’) to allow us to integrate both
sets of data into a group of core findings represented in the central ‘pillar’ (PILLAR
BUILDING THEMES column). Table 4 provides an excerpt of the completed joint
display at this stage of the integration. Synthesizing the mix of study methods in this
way enabled us to compare and contrast the data sets and incorporate the data in a
meaningful and transparent way. It allowed us to move beyond the individual studies,
and the two separate data types, to develop meta themes which represented all the
<Insert table 4 about here>
Table 4. Excerpt of the Pillar Integration Process stage 4: pillar building in a mixed
methods evidence synthesis
Results: Example Two. What PIP Added to the Orthopedic Surgery Systematic
Review
In our second example, the Pillar Integration Process enabled us to systematically
combine findings from qualitative and quantitative studies to identify the barriers and
facilitators for decision-making in orthopedic surgery. Eight themes were generated
from the PIP which covered factors such as the surgeon or health care professional,
the source and type of evidence need, patient factors, or issues related to the health
system. Detailed results of the themes and the complete PIP can be found
elsewhere (Grove et al., 2016).
The PIP highlighted that sometimes the factors which influenced
decision-making were out of the control of the individual surgeon treating the patient, and
aided identification of all the interacting issues and contexts that should be
considered. This conceptual and contextual understanding was crucial when
developing appropriate strategies in the context of orthopedic surgery. To overcome
the issues that drive inappropriate decision-making in orthopedics, a multifaceted
solution functioning at various levels within healthcare organizations would be
required. For example, a single level intervention targeting individual surgeons to use
clinical guidelines in practice may not be as successful as anticipated. Nor may an
in practice. We were able to communicate this in-depth knowledge conceptually and
visually using PIP.
The application of the PIP in example two permitted us to treat the various data
types equally and group the categories based on the conceptual and contextual
ideas, rather than the quantity of each factor reported or the research method used.
The Pillar Integration Process as a technique allowed us to systematically present
the data from the included studies into a joint display. This enables the visualization
of the analysis process and the traceability of the core barriers and facilitators
(themes) to their original articles. Visualization helped to overcome the problem of
ensuring transparency in this mixed methods systematic review, as it gave the
narrative synthesis a well-defined and rigorous framework that could be followed and
clearly understood.
Discussion
The key focus for the development of Pillar Integration Process was to achieve a
systematic and replicable technique to integrate data in the analysis phase of mixed
methods research, for which there has been a reported demand (Fetters &
Freshwater, 2015). We have described, step by step, the four stages of the PIP – a
novel joint display technique to integrate quantitative and qualitative data. The
novelty of the Pillar Integration Process originates from the systematic and replicable
processes, which enable researchers to simultaneously convey both the process and
the findings of their mixed methods integration. Therefore allowing for transparency
in the integration processes. PIP provides support for the external validity of
integration in mixed methods analysis and can be used in a range of mixed methods
The Pillar Integration Process was developed in a mixed methods primary study
(example one), where it illuminated the underlying factors contributing to delivery and
evaluation challenges, which might otherwise be seen as normal and persistent
problems. It was validated using a second example. In the systematic review, it
highlighted conceptual meta-issues, for example the mixed definition of evidence,
and discerned various factors that influence decision-making in practice.
PIP Requirements
The Pillar Integration Process requires knowledge of both quantitative and qualitative
techniques of data collection and analysis. PIP is characterized by an ability to work
methodically to code, transform and condense the two data sources into categories,
and then into pillar themes. The resources required for this technique are no more or
less than other integration techniques available.
A researcher who is relatively inexperienced at data integration may use this
technique and rely on the four stage procedure we have described here. An
experienced researcher with knowledge of data integration, can use the Pillar
Integration Process with a team to undertake collaborative data integration. The
strengths and limitations of mixed methods team working would apply to PIP
(O'Cathain et al., 2010).
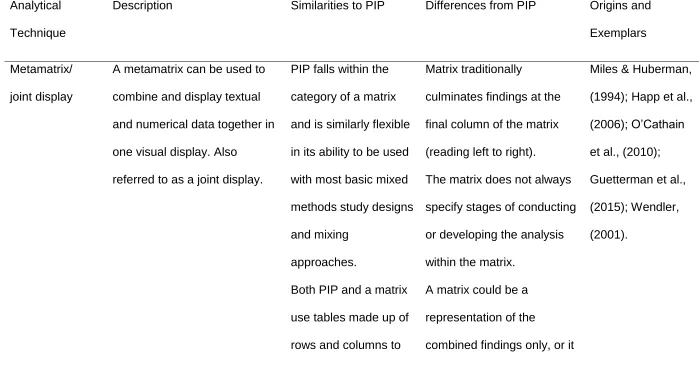
Comparisons with Other Integration Methods
Comparing the similarities and differences of the Pillar Integration Process with other
analytical techniques can help to contextualize PIP. Table 5 displays four common
between the PIP and traditional integration methods. The final column in Table 5
references seminal works and exemplars from each technique.
<Inset Table 5 about here>
Table 5. Comparison of the Pillar Integration Process with other analytical integration
techniques
PIP and joint display. The Pillar Integration Process is a type of joint display
rather than a stand alone approach to mixed methods analysis. It was adapted and
developed from traditional mixed methods matrix and joint display techniques to
integrate data, and it uses a table format for display (Creswell, 2003; Miles &
Huberman, 1994; O'Cathain et al., 2010). PIP is flexible in its ability to be used with
most basic mixed methods study designs and mixing approaches. Depending on the
nature and use of the data collected it is particularly suited to the convergent,
embedded, transformative or multiphase designs (Creswell & Clark, 2007). Joint
displays and matrices traditionally display study findings in the right hand column,
and do not always specify the stages of conducting or developing the analysis within
the matrix (Bazeley, 2006; Castro et al., 2010; Guetterman et al., 2015; Happ et al.,
2006; Miles & Huberman, 1994; O'Cathain et al., 2010; Wendler, 2001). While these
traditional techniques are easy to follow, they may not clearly convey the actual
processes of the integrator.
PIP differs as it centralizes the results of comparison and synthesis of the data in
the pillar, balancing the qualitative and quantitative data visually and technically. PIP
stages, in addition to presenting the findings, supporting the reader to understand
the process and the findings and showing the trustworthiness of the method.
Transforming qualitative into quantitative data and vice versa may be required at the
listing or matching stages of PIP, although PIP is broader than transformation, since
there are further stages of integration before interpretation can take place (Bazeley,
2009a; Griffiths et al., 2015; Onwuegbuzie & Teddlie, 2003; Teddlie & Tashakkori,
2009). The Pillar Integration Process promotes both the flexibility of developing the
joint display alongside rigor of pre-defined structured stages, supporting the
comprehension and trustworthiness of the method for the reader.
PIP and comparing/validating/triangulation. The Pillar Integration Process is
similar to the comparing technique, in that it allows for the clear identification of
instances of divergence or dissonance in the matching phase, through a systematic
method (Greene, 2007; Teddlie & Tashakkori, 2009). It differs in that it may or may
not be used to compare findings from two distinct methods with the purpose of
verification or validation. However, PIP focuses more on exploring or expanding
findings and generating new insights (Graham, 2005; Moran-Ellis et al., 2006; Ruffin
et al., 2009; Sandelowski, 1995). PIP allows for the identification of absence of data,
which may be as important as the presence of findings.
When using the PIP, it is essential to be rigorous in validating the work at the
checking stage, and useful frameworks exist to support checking within mixed
methods (Creswell et al., 2011; Dellinger & Leech, 2007; Pluye et al., 2009) and
PIP and following a thread. PIP has some similarities with following a thread,
as both techniques scrutinize themes across data types. The repetition within the
listing and matching stages of PIP reflects the following a thread technique whereby
key emerging issues are searched for, identified, and examined across other
components of study data. However, following a thread does not specify particular
steps as it focuses more heavily on early identification of common themes to be
explored across multiple components of a study or dataset (Adamson et al., 2009;
Moran-Ellis et al., 2006; O'Cathain et al., 2010). This is not the same in the Pillar
Integration Process as the four stages of PIP are a distinguishing component, and
central to the procedure and to the integration of findings.
PIP and transformation. Finally, transformation is necessary in the Pillar
Integration Process in order to formulate the central pillar. Transformation and PIP
differ in that transformation is a technique itself and a researcher may move directly
form transformation into the interpretation of quantified or qualitized data. When
using PIP however, there are two further stages of integration (matching and
checking) that are required before the final pillar building stage and interpretation can
take place.
In summary, there is a paucity of analytical integration description within mixed
methods literature. To the authors’ knowledge, few other techniques provide a
step-by-step process for integrating data at this level of detail. This is something we
specifically set out to generate through operationalizing the Pillar Integration
Limitations
There are some limitations to this work. In developing PIP, it was tailored to a
specific study (example one), which could have missed important issues in its
generalizability. More complete and empirical process information therefore may
have revealed more conclusive or different findings. However, we aimed to address
this concern by verifying the use of the PIP in another study with many differences
from the first, including study design (systematic review rather than primary study),
setting (NHS rather than schools), sample (orthopedic surgeons rather than school
staff), and topic (decision-making rather than health improvement program). Further
use of PIP should help to consolidate its role and value in increasing methodological
transparency, rigor and trustworthiness of reporting.
The Pillar Integration Process requires knowledge of two approaches to data
collection and analysis and an understanding of the epistemology of subtle realism
(Hammersley, 1992). As with any mixed methods study, PIP is characterized by an
ability to work methodically to code, transform and condense two data sources into
categories, and then into pillar themes.
Implications for Research
The methodological rigor of the PIP technique means that it could be used in other
mixed methods research and practice contexts. The Pillar Integration Process is
flexible enough to be used in different study designs (Creswell & Clark, 2007). PIP is
likely to be most suitable for use in mixing purposes of comparison/triangulation,
complementarity, and expansion, though it can be used in studies with a purpose of
development or initiation (Greene et al., 1989). Further use of PIP in different
other integration techniques. The time requirement to use the PIP would be largely
determined by the volume and intricacy of the datasets and research questions
under investigation.
How the Study Adds to the Mixed Methods Literature
The existing mixed methods literature emphasizes the importance of integration;
however, relatively few well-articulated integration techniques are available for use
by mixed methods researchers that provide a technical step-by-step process for
integrating data at this level of detail. While Happ et al. (2006) and Wendler (2001)
offer descriptive examples of analytical integration and data merging, this is not a
predominate activity in mixed methods reporting. Previous literature reviews focus
more on overall methodological integration (Zhang & Creswell, 2013) or the
integration of empirical and theoretical approaches (Ostlund et al., 2011) rather than
on specific techniques to merge and synthesize data, reflecting a semantic issue
within wider mixed methods reporting rather than an omission on the part of the
reviewers. Teddlie and Tashakkori (2009) also provide comprehensive presentation
of overall analytical approaches and suggest that data are integrated to form
meta-inferences. They describe “conclusions generated through an integration of the
inferences that were obtained from both strands of the study” (p.266); however, they
do not describe in detail how these data can be integrated.
The examples above demonstrate the nuances that exist within the description
and discussion of integration techniques in the mixed methods literature. A range of
approaches and techniques are available that can be used to conduct and analyze
mixed methods studies. The Pillar Integration Process is one type of joint display
integrated and enables transparency and rigor during data integration and
interpretation, and clarity in the presentation of study results. Through the publication
of integration techniques, in addition to criteria for quality assessment in mixed
methods research, greater overall methodological transparency can be achieved.
Conclusion
The Pillar Integration Process is a four stage technique that can be used to integrate
qualitative and quantitative data using a joint display format. This paper has defined
and described the Pillar Integration Process and demonstrated its application using
two examples. Existing mixed methods literature emphasizes the importance of
integration but relatively few well articulated integration techniques are available. The
PIP aims to fill the gap in existing literature by enabling transparency and rigor during
References
Adamson, J., Ben-Shlomo, Y., Chaturvedi, N., & Donovan, J. (2009). Exploring the
impact of patient, views on 'appropriate' use of services and help seeking: a
mixed method study. British Journal of General Practice, 59(564), 496-502.
doi: 10.3399/bjgp09X453530
Bazeley, P. (2006). The contribution of computer software to integrating qualitative
and quantitative data and analyses. Research in the Schools, 13(1), 64-74.
Bazeley, P. (2009a). Analysing mixed methods data. Mixed methods research for
nursing and the health sciences. London, UK: Wiley-Blackwell.
Bazeley, P. (2009b). Integrating data analyses in mixed methods research. Journal
of Mixed Methods Research, 3(3), 203-207. doi: 10.1177/1558689809334443
Bazeley, P. (2012). Integrative analysis strategies for mixed data sources. American
Behavioral Scientist, 56(6), 814-828. doi: 10.1177/0002764211426330
Birkmeyer, J. D., Sharp, S. M., Finlayson, S. R. G., Fisher, E. S., & Wennberg, J. E.
(1998). Variation profiles of common surgical procedures. Surgery, 124(5),
917-923. doi: 10.1016/s0039-6060(98)70017-0
Caracelli, V. J., & Greene, J. C. (1993). Data-analysis strategies for mixed-methods
evaluation designs. Educational Evaluation and Policy Analysis, 15(2),
195-207. doi: 10.3102/01623737015002195
Castro, F. G., Kellison, J. G., Boyd, S. J., & Kopak, A. (2010). A methodology for
conducting integrative mixed methods research and data analyses. Journal of
Mixed Methods Research, 4(4), 342-360. doi: 10.1177/1558689810382916
Chalmers, I., & Glasziou, P. (2009). Avoidable waste in the production and reporting
of research evidence. Lancet, 374(9683), 86-89. doi:
Creswell, J. W. (2003). Research design: qualitative, quantitative, and mixed
methods approaches. London, UK: Sage.
Creswell, J. W., & Clark, V. L. P. (2007). Designing and conducting mixed methods
research. London, UK: Sage.
Creswell, J. W., Klassen, A. C., Plano Clark, V. L., & Smith, K. C. (2011). Best
practices for mixed methods research in the health sciences. Bethesda
(Maryland): National Institutes of Health, 2094-2103.
Dellinger, A. B., & Leech, N. L. (2007). Toward a unified validation framework in
mixed methods research. Journal of Mixed Methods Research, 1(4), 309-332.
doi: 10.1177/1558689807306147
Dunn, W. R., Schackman, B. R., Walsh, C., Lyman, S., Jones, E. C., Warren, R. F.,
& Marx, R. G. (2005). Variation in orthopaedic surgeons' perceptions about
the indications for rotator cuff surgery. Journal of Bone and Joint
Surgery-American Volume, 87A(9), 1978-1984. doi: 10.2106/jbjs.d.02944
Ferlie, E., Wood, M., & Fitzgerald, L. (1999). Some limits to evidence-based
medicine: a case study from elective orthopaedics. Quality in Health Care,
8(2), 99-107.
Fetters, M. D., Curry, L. A., & Creswell, J. W. (2013). Achieving integration in mixed
methods designs - principles and practices. Health Services Research, 48(6),
2134-2156. doi: 10.1111/1475-6773.12117
Fetters, M. D., & Freshwater, D. (2015). The 1+1=3 integration challenge. Journal of
Mixed Methods Research, 9(2), 115-117. doi: 10.1177/1558689815581222
Glover, J. A. (2008). The incidence of tonsillectomy in school children (Reprinted
from Proceedings of the Royal Society of Medicine, pg 1219-1236, 1938).
Graham, R. W. (2005). Illustrating triangulation in mixed-methods nursing research:
Graham R Williamson discusses the concept of triangulation in data collection
and analysis in mixed-methods research, and reflects upon how this
contributed to a deeper understanding when he used it in his work. Nurse
researcher, 12(4), 7-18.
Greene, J. C. (2007). Mixed methods in social inquiry (Vol. 9). San Francisco, CA:
John Wiley & Sons.
Greene, J. C., Caracelli, V. J., & Graham, W. F. (1989). Toward a conceptual
framework for mixed-method evaluation designs. Educational Evaluation and
Policy Analysis, 11(3), 255-274.
Griffiths, F. E., Boardman, F. K., Chondros, P., Dowrick, C. F., Densley, K., Hegarty,
K. L., & Gunn, J. (2015). The effect of strategies of personal resilience on
depression recovery in an Australian cohort: A mixed methods study. Health,
19(1), 86-106. doi: 10.1177/1363459314539774
Grove, A., Johnson, R. E., Clarke, A., & Currie, G. (2016). Evidence and the drivers
of variation in orthopaedic surgical work : a mixed method systematic review.
Health Systems and Policy Research, 3(1).
Guetterman, T. C., Fetters, M. D., & Creswell, J. W. (2015). Integrating quantitative
and qualitative results in health science mixed methods research through joint
displays. Annals of Family Medicine, 13(6), 554-561. doi: 10.1370/afm.1865
Hammersley, M. (1992). Deconstructing the qualitative-quantitative divide. In
Brannen, J (Eds.), Mixing Methods: qualitative and quantitative research
Happ, M. B., Dabbs, A. D., Tate, J., Hricik, A., & Erlen, J. (2006). Exemplars of
mixed methods data combination and analysis. Nursing Research, 55(2),
S43-S49. doi: 10.1097/00006199-200603001-00008
Harden, A., & Thomas, J. (2005). Methodological issues in combining diverse study
types in systematic reviews. International Journal of Social Research
Methodology, 8(3), 257-271. doi: 10.1080/13645570500155078
Heyvaert, M., Hannes, K., Maes, B., & Onghena, P. (2013). Critical appraisal of
mixed methods studies. Journal of Mixed Methods Research, 7(4), 302-327.
doi: 10.1177/1558689813479449
Johnson, R. B., & Onwuegbuzie, A. J. (2004). Mixed methods research: A research
paradigm whose time has come. Educational researcher, 33(7), 14-26.
Johnson, R. B., Onwuegbuzie, A. J., & Turner, L. A. (2007). Toward a definition of
mixed methods research. Journal of Mixed Methods Research, 1(2), 112-133.
doi: 10.1177/1558689806298224
Johnson, R. E. (2013). Practicalities of public health practice and evaluation : the
case of mental wellbeing in Coventry. (Unpublished doctoral dissertation), The
University of Warwick, Coventry, UK.
Johnson, R. E., Grove, A., & Clarke, A. (2016). It's hard to play ball: A qualitative
study of knowledge exchange and silo effects in public health. Manuscript
submitted for publication.
Lincoln, Y. S., & Guba, E. G. (1985). Naturalistic inquiry (Vol. 75). London, UK:
Sage.
McPherson, K. (2008). Commentary: James Alison Glover (1874-1963), OBE (1919)
research then and now. International Journal of Epidemiology, 37(1), 19-23.
doi: 10.1093/ije/dym260
Miles, M. B., & Huberman, A. M. (1994). Qualitative data analysis: An expanded
sourcebook. London, UK: Sage.
Moran-Ellis, J., Alexander, V. D., Cronin, A., Dickinson, M., Fielding, J., Sleney, J., &
Thomas, H. (2006). Triangulation and integration: processes, claims and
implications. Qualitative research, 6(1), 45-59.
doi:10.1177/1468794106058870
Moritz, S., Bates, T., Henderson, S. M., Humphreys, S., & Michell, M. J. (1997).
Variation in management of small invasive breast cancers detected on
screening in the former South East Thames region: observational study.
British Medical Journal, 315(7118), 1266-1272.
O'Cathain, A., Murphy, E., & Nicholl, J. (2007). Why, and how, mixed methods
research is undertaken in health services research in England: a mixed
methods study. BMC Health Services Research, 7. doi:
10.1186/1472-6963-7-85
O'Cathain, A., Murphy, E., & Nicholl, J. (2008). The quality of mixed methods studies
in health services research. Journal of Health Services Research & Policy,
13(2), 92-98. doi: 10.1258/jhsrp.2007.007074
O'Cathain, A., Murphy, E., & Nicholl, J. (2010). Three techniques for integrating data
in mixed methods studies. British Medical Journal, 341. doi:
10.1136/bmj.c4587
Onwuegbuzie, A. J., & Johnson, R. B. (2006). The validity issue in mixed research.
Onwuegbuzie, A. J., & Teddlie, C. (2003). A framework for analyzing data in mixed
methods research. In A. Tashakkori & C. Teddlie (Eds.), Handbook of mixed
methods in social and behavioral research (397-430). Thousand Oaks, CA:
Sage.
Ostlund, U., Kidd, L., Wengstrom, Y., & Rowa-Dewar, N. (2011). Combining
qualitative and quantitative research within mixed method research designs: A
methodological review. International Journal of Nursing Studies, 48(3),
369-383. doi: 10.1016/j.ijnurstu.2010.10.005
Papaioannou, D., Sutton, A., & Booth, A. (2012). Systematic approaches to a
successful literature review. Los Angeles, CA: Sage.
Pluye, P., Gagnon, M. P., Griffiths, F., & Johnson-Lafleur, J. (2009). A scoring
system for appraising mixed methods research, and concomitantly appraising
qualitative, quantitative and mixed methods primary studies in Mixed Studies
Reviews. International Journal of Nursing Studies, 46(4), 529-546. doi:
10.1016/j.ijnurstu.2009.01.009
Pope, C. (2002). Contingency in everyday surgical work. Sociology of Health &
Illness, 24(4), 369-384. doi: 10.1111/1467-9566.00300
Ruffin, M., Creswell, J., Jimbo, M., & Fetters, M. (2009). Factors influencing choices
for colorectal cancer screening among previously unscreened African and
caucasian Americans: findings from a triangulation mixed methods
investigation. Journal of Community Health, 34(2), 79-89. doi:
10.1007/s10900-008-9133-5
Sandelowski, M. (1995). Triangles and crystals - on the geometry of qualitative
research. Research in Nursing & Health, 18(6), 569-574. doi:
Teddlie, C., & Tashakkori, A. (2009). Foundations of mixed methods research:
Integrating quantitative and qualitative approaches in the social and
behavioral sciences. London, UK: Sage.
Wendler, M. C. (2001). Triangulation using a meta-matrix. Journal of Advanced
Nursing, 35(4), 521-525. doi: 10.1046/j.1365-2648.2001.01869.x
Wennberg, J. E. (2002). Unwarranted variations in healthcare delivery: implications
for academic medical centres. British Medical Journal, 325(7370), 961-964.
doi: 10.1136/bmj.325.7370.961
Yin, R. K. (2006). Mixed methods research: Are the methods genuinely integrated or
merely parallel. Research in the Schools, 13(1), 41-47.
Zhang, W. Q., & Creswell, J. (2013). The use of "mixing" procedure of mixed
methods in health services research. Medical Care, 51(8), e51-e57. doi:
TABLE 1. An Example of Stage 1 of PIP, Using Data From a Wellbeing Mentor Intervention
Case: Wellbeing Mentor Intervention
QUANT data QUANT
categories
Pillar building themes QUAL categories QUAL codes
Response rate (%)
School 1: 85
School 2: 35
School 3: 35
School 4: 60
Heterogeneity
between
schools in
number of
returns and
completeness
School 5: 100
School 6: 85
School 7: 60
School 8: 20
(response
rate range
from 20% -
100%)
23% of participants
were aged 11 or 12 and
were excluded from the
analysis
Evaluation
fidelity: Didn’t
follow flow
chart of
exclusion
criteria
3/8 schools (37.5%)
completed academic
Incomplete
data
achievement outcome
requests.
1/8 schools (12.5%)
completed requests for
attendance records.
Referral
systems
varied
between
schools
Moderate effect size for
the increase in
Wellbeing outcome
scores between
baseline and follow up
(0.52).
Increase in
Wellbeing
over time
among
students who
undertook
Wellbeing
TABLE 2. An Example of Stage 4 of PIP, Using Data From a Wellbeing Mentor Intervention
Case: Wellbeing Mentor Intervention
QUANT data QUANT categories Pillar building
themes
QUAL categories* QUAL codes
Response rate (%)
School 1: 85
School 2: 35
School 3: 35
Heterogeneity between
schools in number of
returns and completeness
of returns (response rate
range from 20% - 100%)
Compatibility of
setting, staff and
intervention
Compatibility of
context (school)
and program
required flexibility to
account for school
autonomy
“Schools are very autonomous, err,
and that’s often very difficult for
partners who aren’t in education to
understand. Err, you can’t tell them
what to do. So, err, there there was
School 4: 60
School 5: 100
School 6: 85
School 7: 60
School 8: 20
Compatibility of
ethos
underpinning
actions
Compatibility of
wellbeing ethos
behind intervention
and medical ethos
behind some
leadership
The beliefs of
teachers, beliefs of
school leaders can
affect how the
intervention was
implemented.
Role of school
Role of teacher
“Some people will still say ‘I don’t
care about their their health side,
their mental health side. I just want
them to achieve academically’.”
“So, it’s not particularly in the interest
of the school to invest the time trying
to help more on that universal small
group approach because going
straight to the doctor gets you straight
Role of external
support staff
23% of participants
were aged 11 or 12
and were excluded
from the analysis
Evaluation fidelity: Didn’t
follow flow chart of
exclusion criteria Hierarchy, positioning, approaches to leadership When Mentors were not adequately supported, they struggled to manage their workloads appropriately
“The mentors themselves didn’t have
the authority. They are seen as
auxiliary support staff. So in terms of
the pecking order, the hierarchical
place of them in the schools… I don’t
know if teachers were receptive to
what they were saying. Erm, they
needed the support of a line
manager. Err, a senior teacher who
would actually back it up.”
3/8 schools (37.5%)
completed
academic
Partial data collected on
academic achievement
and was different for each
Hierarchy,
positioning,
Context and
achievement
outcome requests.
school: e.g. class
attendance, key stage
scores, and SIMS
behavior points were all
used
approaches to
leadership
schools, staff and
Mentors
1/8 schools (12.5%)
completed requests
for attendance
records.
Setting variation Setting variation
Schools utilized
mentors in a way
that worked best for
them.
Moderate effect size
for the increase in
Wellbeing outcome
scores between
baseline and follow
up (0.52).
Increase in Wellbeing
over time among students
who undertook Wellbeing
Mentorship
Intervention
ethos and ethos
of school/key
staff
Referral system
may be influenced
by teacher-mentor
relationship, beliefs
of teachers, beliefs
of school
“The more senior members of staff,
erm, more experienced members of
staff, were coming saying I don’t
know how the wellbeing mentor
handles that child because we can’t
Role of school
Role of teacher
Role of external
support staff
them to learn and yet they can. And
in the end they were giving advice to
the teachers about the best way to
handle the children and the best way
TABLE 3. Excerpt of the Pillar Integration Process Stage 1: Listing Process for a Mixed Methods Evidence Synthesis
Case: Mixed method systematic review
QUANT data QUANT categories Pillar building
themes
QUAL
categories
QUAL
codes
Bhandari et al.,
2005
1) Management preference by patient age
2) Patient medical condition (i.e. activity)
3) Superiority of treatment opinion (mortality, QoL, function,
infection rates, pain)
Borkhoff et al.,
2008
1) Patient characteristics in general
2) Patient sex
Canty 2013 1) Habit
2) Learned in practice
3) Clinical/ treatment
4) Believes it is evidence based
TABLE 4. Excerpt of the Pillar Integration Process Stage 4: Pillar Building in a Mixed Methods Evidence Synthesis
Case: Mixed method systematic review
QUANT
data
QUANT categories Pillar building themes QUAL categories QUAL
codes
3
5
17
19
22,24
Believe decision is evidence
based
Practice by guideline present
There is more agreement when
more evidence exists
Independent peer reviewed
papers are preferred
Guidelines
Formal codified knowledge “You can always find a paper to
support your idea”
“Orthopedic journals hold the most
powerful position”
“There is complexity of surgeon
appraisal of patients, various explicit
things come into the judgement”
7
7
5
9
9
9,12
19
Supervisor prevented use of
evidence
What my mentor taught me
It burns fewer bridges with
colleagues
Do what others are doing
From meeting and conferences
with colleagues
Socialization and
association with colleagues
“Orthopedics is a learnt craft”
“There is a professional community
with distinct norms that are resilient,
embedded and retain control”
“Negotiating relationships with other
professionals and maintaining
professional networks”
“Clinicians play a role as experts they
are assigned and adopt the roles”
7
7
8
TABLE 5. Comparison of the Pillar Integration Process With Other Analytical Integration Techniques
Analytical
Technique
Description Similarities to PIP Differences from PIP Origins and
Exemplars
Metamatrix/
joint display
A metamatrix can be used to
combine and display textual
and numerical data together in
one visual display. Also
referred to as a joint display.
PIP falls within the
category of a matrix
and is similarly flexible
in its ability to be used
with most basic mixed
methods study designs
and mixing
approaches.
Both PIP and a matrix
use tables made up of
rows and columns to
Matrix traditionally
culminates findings at the
final column of the matrix
(reading left to right).
The matrix does not always
specify stages of conducting
or developing the analysis
within the matrix.
A matrix could be a
representation of the
combined findings only, or it
Miles & Huberman,
(1994); Happ et al.,
(2006); O’Cathain
et al., (2010);
Guetterman et al.,
(2015); Wendler,
organize and aid
understanding of data.
could be the process and
the presentation, whereas
PIP is the latter.
Following a
thread
A multistage technique. First
conduct primary analysis of all
aspects within a study in order
to identify any themes or
issues that could be explored
further. After a key issue from
one study aspect is identified, it
is followed across the other
aspects/data groups within the
study and from there the
thread is created.
Both useful where a
question can be further
investigated or
scrutinized across all
components of the
study data.
Central focus is on the
narrowing down of a
particular issue to explore
across the data; this could
be a chosen approach to
use PIP but is not the central
focus.
Following a thread does not
specify particular steps
whereas the four stages of
PIP are a distinguishing
component.
Moran-Ellis et al.,
(2006); O’Cathain
et al., (2010);
Adamson et al.,
Comparing/
validity check/
triangulation
Data are collected and
analyzed separately and data
are combined at the point of
interpretation, checking for
agreement or disagreement
between findings looking at the
same phenomena.
Comparing and PIP
can help identify
differences between
datasets and findings.
Comparing is usually used
for comparing two distinct
methods of data collection
that focus on the same
phenomena for the purposes
of validation. PIP may focus
more on exploring or
expanding on findings and
generating new insights.
Sandelowski,
(1995); Moran-Ellis
et al., (2006);
Williamson, (2005);
Ruffin, et al.,
(2009).
Transformation/
conversion
Transforming one single set of
data into another type e.g.
textual or numerical.
Quantitizing: Transforming
qualitative data into
quantitative, numerical data.
PIP will often require
data transformation in
the early stages of
developing the PIP
matrix to enable
comparison and
Transformation is a
stand-alone technique and may
move directly on to
interpretation after data are
transformed.
Transformation can be one
component of PIP and
Teddlie &
Tashakkori, (2009);
Bazeley, (2009b);
Onwuegbuzie &
Teddlie (2003);
Griffiths, et al.,
Qualitizing: Transforming
quantitative data into
qualitative, textual data e.g.
codes and categories
analysis between
datasets.
further exploration and
analysis of the data will
occur in addition to
FIGURE 1. The Individual Components of the City Health Improvement Program Evaluation
QUAN collection
• Quant analysis
QUAL collection
• QUAL analysis
Interpretation
FIGURE 2. A Generic Diagrammatic Representation of the Pillar Integration Process to Demonstrate Column Headings and