Reliability of two-dimensional measures associated with bilateral drop-landing 1
performance 2
3
Abstract 4
The aim of this study was to establish the within-session reliability for two-dimensional (2D)
5
video analysis of sagittal- and frontal-plane measures during bilateral drop-landing tasks.
6
Thirty-nine recreational athletes (22 men, 17 women, age = 22 ± 4 years, height = 1.74 ± 0.15
7
m, body mass 70.2 ± 15.1 kg) performed five bilateral drop-landings from 50%, 100% and
8
150% of maximum countermovement jump height, twice on the same day. Measures of
9
reliability for initial contact angle, peak flexion angle and joint displacement for the hip,
10
knee, and ankle joints, frontal-plane projection angles (FPPA), as well as inter-limb
11
asymmetries in joint displacement were assessed. No systematic bias was present between
12
trials (p > 0.05). All kinematic measurements showed relative reliability ranging from large
13
to near perfect (ICC = 0.52–0.96). Absolute reliability ranged between measures, with CV%
14
between 1.0–1.6% for initial contact angles, 1.9–7.9% for peak flexion angles, 5.3–22.4% for
15
joint displacement, and 1.6–2.3% for FPPA. Absolute reliability for inter-limb asymmetries
16
in joint displacement were highly variable, with minimal detectable change values ranging
17
from 6.0–13.2°. Therefore, 2D video analysis is a reliable tool for numerous measures related
18
to the performance of bilateral drop-landings.
19
Key words: within-session reliability, kinematics, landings
20
21
22
23
24
Fiabilité des mesures bidimensionnelles associées aux performances d'atterrissage en 26
chute bilatérale 27
28
Résumé 29
Le but de cette étude était d'établir la fiabilité intra-session pour l'analyse vidéo
30
bidimensionnelle (2D) de mesures sur le plan sagittal et frontal lors de tâches d'atterrissage en
31
chute libre bilatérales. Trente-neuf sportifs sportifs (22 hommes et 17 femmes, âge = 22 ± 4
32
ans, taille = 1,74 ± 0,15 m, masse corporelle 70,2 ± 15,1 kg) ont effectué cinq atterrissages
33
bilatéraux à partir de 50%, 100% et 150% du maximum hauteur du saut en
contre-34
mouvement, deux fois le même jour. Mesures de fiabilité pour l'angle de contact initial,
35
l'angle de flexion maximal et le déplacement articulaire pour les articulations de la hanche, du
36
genou et de la cheville, les angles de projection dans le plan frontal (FPPA), ainsi que les
37
asymétries inter-membres dans le déplacement articulaire. Aucun biais systématique n'était
38
présent entre les essais (p> 0,05). Toutes les mesures cinématiques ont montré une fiabilité
39
relative allant de grande à quasi parfaite (ICC = 0,52–0,96). La fiabilité absolue variait d'une
40
mesure à l'autre, avec des CV% compris entre 1,0 et 1,6% pour les angles de contact initiaux,
41
entre 1,9 et 7,9% pour les angles de flexion maximaux, entre 5,3 et 22,4% pour les
42
déplacements articulaires et entre 1,6 et 2,3% pour les FPPA. La fiabilité absolue pour les
43
asymétries inter-membres dans le déplacement articulaire était très variable, avec des valeurs
44
de changement détectables minimales allant de 6.0 à 13.2°. Par conséquent, l’analyse vidéo
45
2D est un outil fiable pour de nombreuses mesures liées à la performance des atterrissages
46
bilatéraux.
47
Mots clés: Fiabilité intra-session, cinématique, atterrissages
48
Introduction
50
Jump landings expose athletes to large peak vertical forces that require attenuation during
51
sporting activities (Chappell et al., 2005). Landings have been identified as a mechanism for
52
lower-extremity injuries in athletes during sport participation (Hewett, Myer, & Ford, 2006).
53
Athletes at greater risk of injury during landing tasks tend to use less effective movement
54
strategies to dissipate forces in multiple planes (Boling et al., 2009; Hewett et al., 2005;
55
Padua et al., 2009). For example, in the sagittal-plane, decreased knee flexion (Chappell et
56
al., 2005) and ankle plantarflexion angle at initial contact (Rowley & Richards, 2015),
57
reduced hip (Blackburn & Padua, 2009) and knee flexion angle at the lowest point of the
58
landing (Yu, Lin, & Garrett, 2006), and less ankle joint displacement following ground
59
contact (Begalle et al., 2015) have all been shown to increase mechanical loading throughout
60
the lower extremity. In the frontal- and transverse-plane, greater peak knee valgus angle
61
during landing tasks has also been shown to increase lower-extremity injury risk, secondary
62
to higher knee abduction moments increasing the loading placed on passive structures at the
63
tibiofemoral joint (Hewett et al., 2005). Given their established relationship with risk of
64
injury, it is common practice to pre-screen the movement strategies selected by athletes (Tran
65
et al., 2015).
66
Although three-dimensional (3D) motion analysis is regarded as the gold standard in
67
exploring lower limb kinematics, in practice two-dimensional (2D) video analysis is more
68
accessible to practitioners (Munro, Herrington, & Carolan, 2012). However, before kinematic
69
measurements of bilateral landing tasks can be used for the purpose of screening, their
70
reliability must first be established. It is therefore important to quantify the noise (error) of
71
the proposed field-based measurements. For various landing tasks, 2D video analysis has
72
been shown to be a valid tool for measuring frontal-plane projection angle (FPPA),
73
significantly relating to measurements of knee abduction angle (r = -0.38) and external knee
abduction moment (r = -0.59) using 3D motion analysis. Furthermore, FPPA provides a
75
reliable representation of knee valgus/varus angle in the deepest landing position (Dingenen,
76
Malfait, Vanrenterghem, Verschueren, & Staes, 2014; McLean et al., 2005; Mizner,
77
Chmielewski, Toepke, & Tofte, 2012; Munro et al., 2012) and is a valid measure of
frontal-78
plane knee mechanics during landings when compared to 3D analysis. However, for joint
79
angle measurements in the sagittal-plane, only Dingenen et al. (2015) and King and Belyea
80
(2015) have investigated the reliability of 2D analysis for measurements of bilateral landing
81
activities. In all of these investigations, only peak angles for the hip, knee and ankle joints
82
were measured. At present, studies investigating the reliability of 2D analysis have not
83
considered other variables that may impact load dissipation during landings, such as initial
84
contact angles and joint displacement for the hip, knee, and ankle joints (Begalle et al., 2015;
85
Chappell et al., 2005; Rowley & Richards, 2015). Furthermore, there has been no
86
investigation of the reliability of 2D kinematic measures during a bilateral drop-landing, a
87
screening tool commonly used in practice (Bird & Markwick, 2016; Tran et al., 2015).
88
An additional consideration when analysing kinematic measures associated with bilateral
89
drop-landings is asymmetries in coordination. Asymmetry in landing strategies commonly
90
occur during bilateral landing tasks in uninjured (Schot et al., 1994) and injured populations
91
(Meyer, Gette, Mouton, Seil, & Theisen, 2018). Practitioners may attempt to determine
92
asymmetries in kinematic variables associated with landing performance, as individuals who
93
exhibit large asymmetries during bilateral landings may expose one leg to excessive loading
94
relative to the contralateral limb (Schot et al., 1994). However, the test re-test reliability for
95
2D video analysis to detect inter-limb asymmetries has not been established for kinematic
96
parameters of drop-landings.
97
The aim of this investigation, therefore, was to assess the reliability of kinematic measures
98
using 2D video analysis during bilateral drop-landings across a range of heights.
100
Methods
101
Participants
102
Thirty-nine recreational athletes volunteered for this study, consisting of 22 men (age = 23 ±
103
5 years; height = 1.80 ± 0.6 m; mass = 77.9 ± 14.0 kg) and 17 women (age = 20 ± 4 years;
104
height = 1.6 ± 0.9 m; mass = 60.3 ± 9.8 kg) withmean values for maximum
105
countermovement jump (CMJ) height of 0.34 ± 0.7 m and 0.24 ± 0.5 m, respectively.
106
Participants were excluded if they had a previous history of lower-extremity or spinal surgery
107
or had incurred a lower-extremity injury 6 months prior to testing. Participants were informed
108
of the risks associated with testing, completed a pre-exercise questionnaire and signed an
109
informed consent form before testing. Ethical approval was obtained by the Institutional
110
Research Ethics Panel of the lead author.
111
112
Test procedures
113
A within-session repeated measures design was used, with participants reporting to the
114
university laboratory for a single testing session. All test sessions were conducted between
115
10:00 am and 1:00 pm to control for circadian variation. All participants wore tight-fitting
116
shorts and vest so that key landmarks were recognisable by all cameras. Anthropometric data
117
was collected prior to completing a standardised warm-up routineconsisting of a 5 min jog
118
and dynamic stretches including sumo squats, forward lunges, mountain climbers and leg
119
swings for 10 repetitions. Participants were then familiarised with performing a CMJ. For the
120
CMJ, participants stood bare feet with a hip-width stance with each foot placed on a separate
121
portable force platform recording at 1000 Hz (Pasco, Roseville, CA, USA). Each force
122
platform was positioned side-by-side, 0.05 m apart and embedded in custom-built wooden
mountsthat were level with the force platforms and did not allow any extraneous movement
124
by the force platforms during the landing. Participants’ hands were placed on their hips and
125
remained in this position throughout the jump to isolate the contribution from the
lower-126
extremity. Participants were then asked to rapidly descend prior to explosively jumping as
127
high as possible, with no control being placed on the depth or duration of the
128
countermovement (Benjanuvatra, Lay, Alderson, & Blanksby, 2013). For data collection,
129
three maximal effort CMJs were performed, with 60 s recovery between attempts. Following
130
the final CMJ, force-time data were analysed using the following equation (Moir, 2008) to
131
calculate jump height to the nearest cm:
132
Equation: Time in the air jump height (cm) = ½ g(t/2)2
133
where g represents the acceleration of gravity (9.81 m/s2) and t represents the time in the air
134
(s). Time in the air was determined as the period where force was less than 10 N. Using a
135
custom-made Microsoft Excel spreadsheet, the maximum value of the three attempts was
136
then used to calculate box height for the bilateral drop-landings.
137
Following the performance of the CMJ, reflective markers were placed directly onto the
138
participants’ skin by the same investigator using the anatomical locations for sagittal-plane
139
lower-extremity joint movements and frontal-plane projection angle (FPPA) outlined by
140
Dingenen et al. (2015) and Munro et al. (2012), respectively. For sagittal-plane views,
141
reflective markers were placed on both left and right acromioclavicular joints, greater
142
trochanters, lateral femoral condyles, lateral malleolus and 5th metatarsal heads (Dingenen et
143
al., 2015). Frontal-plane projection angle was calculated for the right knee joint only, with
144
reflective markers placed at the centre of the right knee joint (midpoint between the femoral
145
condyles), centre of the right ankle joint (midpoint between the malleoli) joint and on the
146
proximal right thigh (midpoint between the anterior superior iliac spine and the knee marker).
Midpoints for the knee and ankle were measured with a standard tape measure (Seca 201,
148
Seca, United Kingdom), as outlined by Munro et al. (2012).
149
Participants then repeated the standardised warm-up before being familiarised with the
150
bilateral drop-landings from drop heights of 50%, 100%, and 150% of maximum CMJ height.
151
For familiarisation, participants performed bilateral drop-landings from each drop height.
152
Familiarisation ceased once participants indicated they were comfortable with the technique
153
and procedure. Bilateral drop-landings were performed with participants standing bare foot
154
with their arms folded across their chest on a height-adjustable platform (to the nearest 0.01
155
m). Participants were then instructed to step off the platform, leading with the right leg,
156
before immediately bringing the left leg off and alongside the right leg prior to impact with
157
the ground. During this manoeuvre, participants were instructed to ensure that they did not
158
modify the height of the centre of mass prior to dropping from the platform (James, Bates, &
159
Dufek, 2003). To provide participants with a reference point for landing and to ensure
160
landings were in full view of the video cameras, two force platforms were positioned 0.15 m
161
away from the elevated platform (Munro et al., 2012). Participants were instructed to “land
162
as softly as possible with both feet contacting the force platforms simultaneously and with
163
equal weight distribution before returning to a standing position”. This instruction was
164
provided to allow for focus of attention to be controlled between trials (Milner, Fairbrother,
165
Srivatsan, & Zhang, 2012). No feedback on landing performance was provided at any point
166
during testing. For each drop height, participants performed five landings for data collection,
167
with 60 s recovery provided between landings. Following the performance of the initial five
168
landings from each drop height (test 1), participants rested for 10 min prior to repeating the
169
standardised warm-up and the bilateral drop-landing protocol (test 2). Drop height order was
170
randomised using a counterbalanced design for both test 1 and 2. Mean values for all
171
variables using all five trials were calculated for test 1 and test 2. Five trials were used to
calculate the mean based on previous investigations demonstrating a plateau in measures of
173
reliability for landing kinematics when >4 trails were used for data analysis (Ortiz et al.,
174
2007).
175
For 2D video analysis, sagittal- and frontal-plane joint movements were recorded using three
176
standard digital video cameras sampling at 60 Hz (Panasonic HX-WA30). All cameras were
177
set up using the procedures outlined by Payton (2007). For left and right sagittal-plane joint
178
movements, cameras were positioned 3.5 m from the centre of either force platform
179
(Dingenen et al., 2015). To record frontal-plane kinematics, a camera was placed 3.5 m in
180
front of the centre of the force platforms (Dingenen et al., 2014). All cameras were placed on
181
a tripod at a height of 0.60 m from the ground (Dingenen et al., 2014; Dingenen et al., 2015).
182
183
Data analysis
184
All video recordings were analysed with free downloadable software (Kinovea for Windows,
185
Version 0.8.15). For sagittal-plane joint movements, hip flexion, knee flexion and ankle
186
dorsiflexion angles were calculated at initial contact and the maximum flexion point deepest
187
landing position for both limbs. These angles were then used to calculate joint displacement
188
for each joint by subtracting the initial contact angle from the maximum flexion point. Initial
189
contact was defined as the frame prior to visual impact between the foot and the ground that
190
led to deformation of the foot complex. The maximum flexion point was identified visually
191
and defined as the frame where no more downward motion occurred at the hip, knee, or ankle
192
joints (Dingenen et al., 2015). Intra-rater reliability for identifying the moment of maximum
193
flexion as a reference point for peak joint angles during landing was performed using the first
194
trial from a drop height of 100% of CMJ height for 20 randomly selected participants (13
195
males and 7 females).Videos were examined twice by the same investigator, seven days
apart. Intra-class correlation coefficients (ICC) for time at the maximum flexion point were
197
0.99 and the standard error of measurement (SEM) were 0.01 s. Hip flexion angle was
198
calculated as the angle between a line formed between the acromioclavular joint and the
199
greater trochanter and a line between the greater trochanter and the femoral condyle. Knee
200
flexion angle was calculated as the angle between a line formed between the greater
201
trochanter and the femoral condyle and a line between the femoral condyle and the lateral
202
malleolus. Ankle dorsiflexion angle was calculated as the angle between a line formed
203
between the femoral condyle and the lateral malleolus and a line between the lateral
204
malleolus and the 5th metatarsal head. Frontal-plane projection angle was calculated for the 205
right limb at the deepest landing position, defined as the frame corresponding to maximum
206
knee flexion (Munro et al., 2012). This angle was calculated as the angle between the line
207
formed between the proximal thigh marker and the knee joint marker and a line between the
208
knee joint marker and the ankle joint marker (Munro et al., 2012). For initial contact and the
209
maximum flexion point, smaller values represented greater hip flexion, knee flexion and
210
ankle dorsiflexion for the hip, knee and ankle joints, respectively. For FPPA, values < 180° 211
represented knee valgus and values > 180° represented knee varus.
212
Between-limb differences for sagittal-plane joint displacement was calculated by subtracting
213
the left value from the right value for the ankle, knee and hip joints. A positive value
214
indicated the right limb had greater joint displacement for the corresponding segment and
215
vice versa for a negative value.
216
217
Statistical analysis
218
Descriptive statistics (means ± standard deviation) were calculated for initial contact angles,
219
peak flexion angle at the maximum flexion point and joint displacement for the right limb,
along with between-limb differences for joint displacement. The assumption of normality was
221
checked using the Shapiro-Wilk test. To account for heteroscedastic errors, the relationship
222
between the mean values between tests and the difference between repeat tests was evaluated
223
using Pearson’s correlation coefficient. To establish systematic bias between test 1 and 2,
224
mean values for initial contact angle, peak flexion angles, joint displacement, FPPA, and
225
between-limb differences in sagittal-plane joint displacement was initially assessed using a
226
paired samples t-test (Atkinson & Nevill, 1998). The α-priori level of significance was set at
227
p < 0.05, with a Bonferroni correction applied post-hoc. Relative reliability was determined
228
using ICC as described by Hopkins (2018a) and reported with 95% confidence intervals, with
229
ICCs interpreted as follows: 0.01-0.3 poor, 0.3-0.5 moderate, 0.5-0.7 large, 0.7-0.9 very
230
large, and > 0.9 nearly perfect (Hopkins, 2018a). Absolute reliability was calculated using the
231
coefficient of variation, the 95% limits of agreement, SEM (SD√1-ICC) (Atkinson & Nevill,
232
1998) and minimal detectable change (MDC; SEM*1.96*√2) (Riemann & Lininger, 2018).
233
Due to the asymmetry in joint displacement being interval data, CV% was not determined.
234
ICC and CV% were calculated using a customised spreadsheet (Hopkins, 2018b). The CV%
235
was used as the primary measure of absolute reliability but we have reported a variety of
236
statistical interpretations to facilitate interpretation of the results by researchers and
237
practitioners. All statistical tests were performed using SPSS® statistical software package
238
(v.24; SPSS Inc., Chicago, IL, USA).
239
240
Results 241
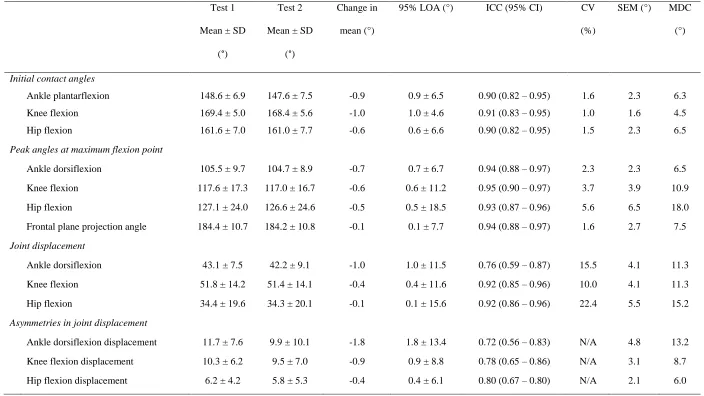
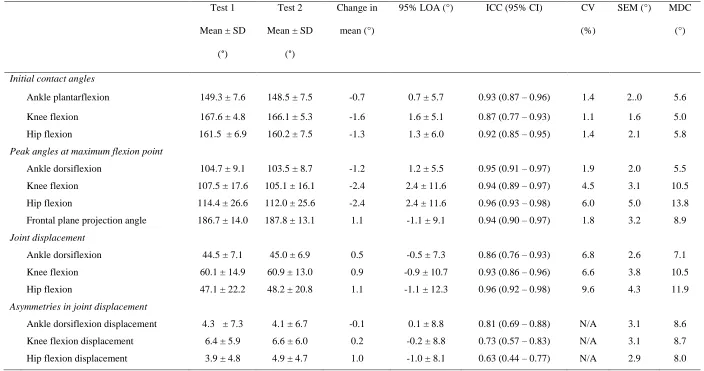
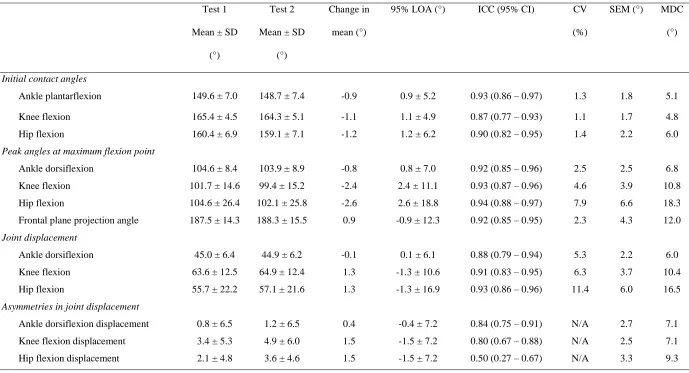
There was no systematic bias found between test 1 and 2 for any variable for any drop height.
242
Relative reliability ranged from very large to near perfect (ICC = 0.87–0.93) and CV% for
243
initial contact variables ranged from 1.0–1.6% across all drop heights. For peak angles at the
maximum flexion point, relative reliability was near perfect (ICC = 0.92–0.95) and absolute
245
reliability ranged between 1.9–7.9% for CV% for the hip, knee and ankle joints, along with
246
FPPA for all drop heights. Relative reliability for joint displacement ranged from very large
247
to near perfect (ICC = 0.76–0.96). At drop heights of 50% CMJ height, greater absolute
248
variability was identified for joint displacement values (CV% =10.0–22.4%), but at a drop
249
height of 100% CMJ height, joint displacements values all possessed CV% < 10%. However,
250
at drop heights of 150% of CMJ height, joint displacement for the hip exceeded CV% > 10%.
251
Relative reliability for between-limb difference sin sagittal-plane joint displacement ranged
252
from large to very large (ICC = 0.50–0.84) with MDC values ranging between 6.0–13.2°.
253
254
255
256
257
258
259
260
261
262
263
264
Table 1. Within-session reliability for all dependant variables for bilateral drop-landing from a drop height equalling 50% CMJ height (n = 39).
266
Test 1
Mean ± SD
(°)
Test 2
Mean ± SD
(°)
Change in
mean (°)
95% LOA (°) ICC (95% CI) CV
(%)
SEM (°) MDC
(°)
Initial contact angles
Ankle plantarflexion 148.6 ± 6.9 147.6 ± 7.5 -0.9 0.9 ± 6.5 0.90 (0.82 – 0.95) 1.6 2.3 6.3
Knee flexion 169.4 ± 5.0 168.4 ± 5.6 -1.0 1.0 ± 4.6 0.91 (0.83 – 0.95) 1.0 1.6 4.5
Hip flexion 161.6 ± 7.0 161.0 ± 7.7 -0.6 0.6 ± 6.6 0.90 (0.82 – 0.95) 1.5 2.3 6.5
Peak angles at maximum flexion point
Ankle dorsiflexion 105.5 ± 9.7 104.7 ± 8.9 -0.7 0.7 ± 6.7 0.94 (0.88 – 0.97) 2.3 2.3 6.5
Knee flexion 117.6 ± 17.3 117.0 ± 16.7 -0.6 0.6 ± 11.2 0.95 (0.90 – 0.97) 3.7 3.9 10.9
Hip flexion 127.1 ± 24.0 126.6 ± 24.6 -0.5 0.5 ± 18.5 0.93 (0.87 – 0.96) 5.6 6.5 18.0
Frontal plane projection angle 184.4 ± 10.7 184.2 ± 10.8 -0.1 0.1 ± 7.7 0.94 (0.88 – 0.97) 1.6 2.7 7.5
Joint displacement
Ankle dorsiflexion 43.1 ± 7.5 42.2 ± 9.1 -1.0 1.0 ± 11.5 0.76 (0.59 – 0.87) 15.5 4.1 11.3
Knee flexion 51.8 ± 14.2 51.4 ± 14.1 -0.4 0.4 ± 11.6 0.92 (0.85 – 0.96) 10.0 4.1 11.3
Hip flexion 34.4 ± 19.6 34.3 ± 20.1 -0.1 0.1 ± 15.6 0.92 (0.86 – 0.96) 22.4 5.5 15.2
Asymmetries in joint displacement
Ankle dorsiflexion displacement 11.7 ± 7.6 9.9 ± 10.1 -1.8 1.8 ± 13.4 0.72 (0.56 – 0.83) N/A 4.8 13.2
Knee flexion displacement 10.3 ± 6.2 9.5 ± 7.0 -0.9 0.9 ± 8.8 0.78 (0.65 – 0.86) N/A 3.1 8.7
Hip flexion displacement 6.2 ± 4.2 5.8 ± 5.3 -0.4 0.4 ± 6.1 0.80 (0.67 – 0.80) N/A 2.1 6.0
Table 2. Within-session reliability for all dependant variables for bilateral drop-landing from a drop height equalling 100% CMJ height (n = 39).
268
Test 1
Mean ± SD
(°)
Test 2
Mean ± SD
(°)
Change in
mean (°)
95% LOA (°) ICC (95% CI) CV
(%)
SEM (°) MDC
(°)
Initial contact angles
Ankle plantarflexion 149.3 ± 7.6 148.5 ± 7.5 -0.7 0.7 ± 5.7 0.93 (0.87 – 0.96) 1.4 2..0 5.6
Knee flexion 167.6 ± 4.8 166.1 ± 5.3 -1.6 1.6 ± 5.1 0.87 (0.77 – 0.93) 1.1 1.6 5.0
Hip flexion 161.5 ± 6.9 160.2 ± 7.5 -1.3 1.3 ± 6.0 0.92 (0.85 – 0.95) 1.4 2.1 5.8
Peak angles at maximum flexion point
Ankle dorsiflexion 104.7 ± 9.1 103.5 ± 8.7 -1.2 1.2 ± 5.5 0.95 (0.91 – 0.97) 1.9 2.0 5.5
Knee flexion 107.5 ± 17.6 105.1 ± 16.1 -2.4 2.4 ± 11.6 0.94 (0.89 – 0.97) 4.5 3.1 10.5
Hip flexion 114.4 ± 26.6 112.0 ± 25.6 -2.4 2.4 ± 11.6 0.96 (0.93 – 0.98) 6.0 5.0 13.8
Frontal plane projection angle 186.7 ± 14.0 187.8 ± 13.1 1.1 -1.1 ± 9.1 0.94 (0.90 – 0.97) 1.8 3.2 8.9
Joint displacement
Ankle dorsiflexion 44.5 ± 7.1 45.0 ± 6.9 0.5 -0.5 ± 7.3 0.86 (0.76 – 0.93) 6.8 2.6 7.1
Knee flexion 60.1 ± 14.9 60.9 ± 13.0 0.9 -0.9 ± 10.7 0.93 (0.86 – 0.96) 6.6 3.8 10.5
Hip flexion 47.1 ± 22.2 48.2 ± 20.8 1.1 -1.1 ± 12.3 0.96 (0.92 – 0.98) 9.6 4.3 11.9
Asymmetries in joint displacement
Ankle dorsiflexion displacement 4.3 ± 7.3 4.1 ± 6.7 -0.1 0.1 ± 8.8 0.81 (0.69 – 0.88) N/A 3.1 8.6
Knee flexion displacement 6.4 ± 5.9 6.6 ± 6.0 0.2 -0.2 ± 8.8 0.73 (0.57 – 0.83) N/A 3.1 8.7
Hip flexion displacement 3.9 ± 4.8 4.9 ± 4.7 1.0 -1.0 ± 8.1 0.63 (0.44 – 0.77) N/A 2.9 8.0
Table 3. Within-session reliability for all dependant variables for bilateral drop-landing from a drop height equalling 150% of CMJ height (n =
270
39).
271
Test 1
Mean ± SD
(°)
Test 2
Mean ± SD
(°)
Change in
mean (°)
95% LOA (°) ICC (95% CI) CV
(%)
SEM (°) MDC
(°)
Initial contact angles
Ankle plantarflexion 149.6 ± 7.0 148.7 ± 7.4 -0.9 0.9 ± 5.2 0.93 (0.86 – 0.97) 1.3 1.8 5.1
Knee flexion 165.4 ± 4.5 164.3 ± 5.1 -1.1 1.1 ± 4.9 0.87 (0.77 – 0.93) 1.1 1.7 4.8
Hip flexion 160.4 ± 6.9 159.1 ± 7.1 -1.2 1.2 ± 6.2 0.90 (0.82 – 0.95) 1.4 2.2 6.0
Peak angles at maximum flexion point
Ankle dorsiflexion 104.6 ± 8.4 103.9 ± 8.9 -0.8 0.8 ± 7.0 0.92 (0.85 – 0.96) 2.5 2.5 6.8
Knee flexion 101.7 ± 14.6 99.4 ± 15.2 -2.4 2.4 ± 11.1 0.93 (0.87 – 0.96) 4.6 3.9 10.8
Hip flexion 104.6 ± 26.4 102.1 ± 25.8 -2.6 2.6 ± 18.8 0.94 (0.88 – 0.97) 7.9 6.6 18.3
Frontal plane projection angle 187.5 ± 14.3 188.3 ± 15.5 0.9 -0.9 ± 12.3 0.92 (0.85 – 0.95) 2.3 4.3 12.0
Joint displacement
Ankle dorsiflexion 45.0 ± 6.4 44.9 ± 6.2 -0.1 0.1 ± 6.1 0.88 (0.79 – 0.94) 5.3 2.2 6.0
Knee flexion 63.6 ± 12.5 64.9 ± 12.4 1.3 -1.3 ± 10.6 0.91 (0.83 – 0.95) 6.3 3.7 10.4
Hip flexion 55.7 ± 22.2 57.1 ± 21.6 1.3 -1.3 ± 16.9 0.93 (0.86 – 0.96) 11.4 6.0 16.5
Asymmetries in joint displacement
Ankle dorsiflexion displacement 0.8 ± 6.5 1.2 ± 6.5 0.4 -0.4 ± 7.2 0.84 (0.75 – 0.91) N/A 2.7 7.1
Knee flexion displacement 3.4 ± 5.3 4.9 ± 6.0 1.5 -1.5 ± 7.2 0.80 (0.67 – 0.88) N/A 2.5 7.1
Hip flexion displacement 2.1 ± 4.8 3.6 ± 4.6 1.5 -1.5 ± 7.2 0.50 (0.27 – 0.67) N/A 3.3 9.3
Discussion
273
The primary aim of this investigation was to determine the within-session reliability of
274
kinematic variables using 2D video analysis during bilateral drop-landings from drop heights
275
equating to 50%, 100%, and 150% of an individual’s maximum CMJ height. As part of our
276
investigation, we identified no systematic bias, indicating no evidence of a learning effect,
277
participant bias, or acute adaptations in movement strategies between tests using a
within-278
session design (Atkinson & Nevill, 1998). With large to near perfect ICC values and CV%
279
ranging between 1.0–22.4%, our findings suggest that 2D video analysis is sufficiently
280
reliable to determine typical changes in landing kinematics following training or therapeutic
281
interventions during bilateral drop-landings for most variables, although variability in error
282
will be influenced by the kinematic measurement analysed and the drop height. Previously,
283
2D video analysis has been validated against 3D motion analysis for both sagittal- and
284
frontal-plane lower extremity peak joint angles during landing tasks (Dingenen et al., 2014;
285
Dingenen et al., 2015; McClean et al., 2005; Mizner et al., 2012). In conjunction with the
286
findings of our investigation, 2D video analysis is therefore a viable tool for practitioners
287
when assessing bilateral drop-landing mechanics. However, the reliability values presented in
288
this study may not be directly applicable to all populations (i.e. elite athletes). As such,
289
practitioners should attempt to determine the reliability for these variables relative to the
290
population being assessed.
291
Our findings show that initial contact angles for both limbs can be reliably measured using
292
2D video analysis, with ICCs ranging from 0.87–0.93 and CV% between 1.0–1.6% across all
293
drop heights (Table 1–3). Previously, SEM values for establishing sagittal-plane knee and hip
294
angles at initial contact using 2D analysis during drop jumps have shown to range between
295
1.4–4.1˚ and 1.2–1.3˚, respectively (King & Belyea, 2015). These values are similar to our
296
own findings (Table 1–3). To identify a preferred landing strategy, the initial contact angles
may provide valuable information regarding the athlete’s efficiency for attenuating ground
298
reaction forces. Rowley and Richards (2015) showed that when participants consciously
299
increased their ankle plantarflexion angle from 10˚ to 30˚ at initial contact, vertical peak
300
ground reaction forces and loading rates significantly reduced during a bilateral drop-landing
301
from 100% of maximum CMJ height. Alongside landing with greater degrees of ankle
302
plantarflexion angle at initial contact, investigators also observed that participants landed
303
with increased hip and knee extension that was not actively encouraged as part of the study
304
design (Rowley & Richards, 2015). At 30˚ of ankle plantarflexion at initial contact, an even
305
contribution for shock absorption between the hip, knee and ankle joints occurred (Rowley &
306
Richards, 2015), which likely resulted from changes in joint angles at initial contact
307
increasing joint displacement following ground contact (Rowley & Richards, 2015). As
308
greater joint displacement reduces vertical leg stiffness during landings, peak vertical ground
309
reaction forces decrease as the centre of mass’s vertical displacement increases (Ward et al.,
310
2018). These findings are supported by that of Kovács et al. (1999), who demonstrated that
311
bilateral landings with reduced ankle plantar flexion at initial contact led to greater force
312
dissipation via the knee and hip joint during the landing phase of a drop jump. Furthermore,
313
following ankle injury, Delahunt, Cusack, Wilson and Doherty (2013) showed that
314
individuals with chronic ankle instability landed with 3.0° less plantarflexion following ankle
315
mobilisation. Based on the absolute reliability values presented in Table 1–3, our
316
investigation indicates that regardless of box height, such subtle changes in hip, knee, and
317
ankle joint alignment at initial contact can be detected using 2D video analysis due to the
318
negligible error of this kinematic measure. Therefore, this test can be used to assess discrete
319
kinematic characteristics that may influence landing mechanics.
320
Peak joint angles for hip flexion, knee flexion, and ankle dorsiflexion demonstrated nearly
321
perfect relative reliability across all drop heights, with CV% ranging between 1.9-7.9%
(Table 1–3). Similar to our findings, Beardt et al. (2018) reported ICC values for measuring
323
peak hip and knee flexion angles using 2D analysis during bilateral drop jumps as 0.98 and
324
0.92, respectively. Likewise, King and Belyea (2015) reported comparable SEM values for
325
peak flexion angles for the hip (SEM = 2.4˚) and knee joint (SEM = 3.1˚) to that of our
326
investigation. During single-leg drop vertical jumps, peak hip angle is related to hip and knee
327
flexion moment, indicating that greater peak hip flexion as measured by 2D video analysis
328
results in greater hip flexion moments but reduced knee flexion moment (Dingenen et al.,
329
2015). Landing strategies that incorporate greater peak hip flexion have been shown to
330
produce less vertical ground reaction forces and reduced quadriceps muscle activity
331
(Blackburn & Padua, 2009). Furthermore, the increase hip flexion moment may potentially
332
increase the hip extensor muscle contribution to dissipate forces (Sigward, Pollard, &
333
Powers, 2012). As reduced hip extensor activation and elevated quadriceps activation during
334
landing tasks may be a risk factor for knee ligament injury (Withrow, Huston, Wojtys, &
335
Ashton-Mille, 2006), identifying landing strategies with reduced levels of peak hip flexion
336
has the potential to allow clinicians to identify athletes at greater risk of injury. Athletes with
337
limited sagittal-plane flexion strategies throughout the lower extremity have also been
338
suggested to lack the necessary shock absorption to attenuate forces during landing tasks
339
(Blackburn & Padua, 2009; Sigward et al., 2012; Zhang, Bates, & Dufek, 2000). Zhang et al.
340
(2000) showed that a 25.4°, 22.1°, and 5.9° reduction in peak hip flexion, knee flexion and
341
ankle dorsiflexion angles, respectively, between normal and ‘stiff’ landings, resulted in
342
significantly greater peak vertical ground reaction forces during bilateral drop-landings from
343
drop heights of 0.62 m. With greater peak forces during landing being associated with
344
increased lower-extremity injury risk (Hewett et al., 2005; Zadpoor & Nikooyan, 2011),
345
practitioners may wish to identify athletes using a stiff landing strategy and provide an
346
intervention to attenuate injury risk (Lopes et al., 2018). Based on CV% presented in Table
1–3, our findings indicate that changes in landing strategies for peak angles of hip flexion,
348
knee flexion, and ankle dorsiflexion, such as that shown by Zhang et al. (2000), may be
349
reliably identified using 2D video analysis. Our findings provide clinicians with
practically-350
relevant information that may guide the interpretation of bilateral landing tasks, with margins
351
for error in the test measures presented (Riemann & Lininger, 2018).
352
As a result of athletes displaying limited sagittal-plane contribution to attenuating load,
353
compensation may occur through excessive frontal- and/or transverse-plane lower-extremity
354
motion to lower their centre of mass for force dissipation (Sigward et al., 2012). The
355
development of compensation strategies most likely results in greater external knee valgus or
356
varus moments occurring (Kernozek, Torry, Van Hoof, Cowley, & Tanner, 2005). External
357
knee valgus moments and peak angles have previously been shown to recognise athletes at
358
greater risk for anterior cruciate ligament injury (Hewett et al., 2005). With peak FPPA
359
measured using 2D video analysis during landing tasks being shown to correlate with 3D
360
measures of knee valgus (r = -0.38) and knee abduction moment (r = -0.59) (Mizner et al.,
361
2012), our findings indicate that FPPA may be reliably measured during bilateral
drop-362
landings across various drop heights. SEM for FPPA across all drop heights ranged from 2.7–
363
4.3˚ for our investigation. These results are similar to the SEM values reported by Munro et
364
al. (2012) for FPPA during single-leg drop-landings (SEM = 2.7–2.9˚) and bilateral drop
365
jumps (SEM = 3.0˚) performed from a 0.28 m drop height. Therefore, using 2D video
366
analysis for identifying peak FPPA is a reliable means for assessing frontal-plane lower
367
extremity kinematics during bilateral drop-landings from heights ranging between 50–150%
368
of maximum CMJ height.
369
Joint displacement provides a general overview of the contribution from each joint towards
370
force attenuation during landing tasks (Decker, Torry, Wyland, Sterett, & Steadman, 2003,
371
2003). Our results indicate that measurements of joint displacement are reliable to detect
differences between- and within-participants in joint contribution from drop heights of 100%
373
and 150% of maximum CMJ height, with CV% ranging from 5.5–11.4%. Although a
374
threshold of 10% for CV% has been suggested to determine a measure as reliable (Stokes,
375
1985), the use of this arbitrary cut-off point has been contested on the basis that that it is not
376
based on a well-defined analytical goal (Atkinson & Nevill, 1998). As sagittal-plane joint
377
displacement has been shown to be >10% between populations and following an acute
378
intervention, we chose not to apply an arbitrary threshold for interpreting CV%. For example,
379
when investigating gender differences in joint displacement angles during bilateral
drop-380
landings from a 0.60 m drop height, mean differences between male and female participants
381
for the hip, knee, and ankle joints were 13.0%, 16.4% and 28.3%, respectively (Decker,
382
Torry, Wyland, Sterett, & Steadman, 2003). Similarly, with the application of a prophylactic
383
ankle brace to provide external support, Cordova, Takahashi, Kress, Brucker and Finch
384
(2010) found ankle joint displacement reduced by 19.5% during a drop-landing task. Based
385
on the absolute reliability established in our investigation (Table 1–3), such differences can
386
be detected using 2D video analysis from drop heights equating to 100% and 150% of an
387
individual’s maximum CMJ height. However, absolute reliability for joint displacement
388
angles at the hip, knee and ankle were much greater in our investigation from drop heights of
389
50% of maximum CMJ height, with CV% ranging between 10.0-22.4%. It is possible that at
390
lower drop heights, the lower mechanical demand and thus relative ease of the task increases
391
degrees of movement freedom for participants, facilitating greater variability in joint
392
displacement angles for all segments (Nordin & Dufek, 2017). Our findings suggest that
393
greater change is required for joint displacement angles at the hip, knee, and ankle following
394
an intervention when lower relative drop heights are used for screening differences in
395
coordination strategies during bilateral drop-landings.
Between-limb differences in coordination strategies during bilateral drop-landing have been
397
identified in healthy (Pappas & Carpes, 2012) and previously injured populations (Meyer et
398
al., 2018). We determined the relative reliability for between-limb asymmetries in
sagittal-399
plane joint displacements to be large to very large as part of this investigation. However, the
400
absolute reliability values observed in this investigation indicated this measurement to be
401
highly variable. For example, the MDC values for between-limb asymmetries in ankle, knee
402
and hip joint displacement across each drop height ranged from 7.1–13.2°, 7.1–8.7° and 6.0–
403
9.3°, respectively (Table 1–3). Pappas and Carpes (2012) investigated gender differences for
404
between-limb joint kinematics during bilateral drop-landings from a 0.40 m drop height in
405
healthy recreational athletes. Between-limb differences for sagittal-plane joint displacement
406
at the ankle (male = 3.4°, females = 3.8°), knee (male = 3.6°, females = 3.8°) and hip joint
407
(male = 5.6°, females = 5.6°) would not exceed the MDC values presented in this
408
investigation. This is similar for between-limb differences observed in injured populations.
409
Using 3D analysis, Meyer et al. (2018) examined side-to-side differences in knee joint
410
alignment during a bilateral drop vertical jump from a 0.40 m drop height in 17 patients who
411
had undergone unilateral anterior cruciate ligament reconstructive surgery. For sagittal-plane
412
knee joint displacement, a 2.5° difference were found between the involved and uninvolved
413
limb (Meyer et al., 2018). Based on the findings of our investigation, it is likely that this
414
difference would not be detectable using 2D video analysis, irrespective of drop height.
415
Therefore, it is suggested that measurements of between-limb differences in sagittal-plane
416
joint displacement during bilateral drop-landings cannot be used to detect smaller, yet
417
clinically meaningful, changes.
418
419
We have demonstrated that the use of 2D video analysis is a reliable tool for measuring
421
kinematic variables associated with lower-extremity angles at initial contact and maximum
422
flexion point during the bilateral drop-landings from a range of drop heights. With the
423
absolute reliability values presented in this investigation, clinicians possess the tools to
424
interpret an individual’s coordination strategy, relative to inherent measurement error, during
425
a bilateral drop-landing using 2D video analysis. However, the variability in asymmetry
426
values found in this investigation indicates that inter-limb asymmetries in joint displacement
427
during bilateral drop-landings may contain excessive amounts of error that impair the ability
428
to interpret whether real change has occurred following intervention.
429
430
431
432
433
434
435
436
437
438
439
440
441
References 443
Atkinson, G., & Nevill, A. M. (1998). Statistical methods for assessing measurement error
444
(reliability) in variables relevant to sports medicine. Sports Medicine, 26(4), 217-238.
445
Beardt, B. S., McCollum, M. R., Hinshaw, T. J., Layer, J. S., Wilson, M. A., Zhu, Q., & Dai,
446
B. (2018). Lower-extremity kinematics differed between a controlled drop-jump and
447
volleyball-takeoffs. Journal of Applied Biomechanics, 34(4), 327-335.
448
Begalle, R. L., Walsh, M. C., McGrath, M. L., Boling, M. C., Blackburn, J. T., & Padua,
449
D.A. (2015). Ankle dorsiflexion displacement during landing is associated with initial contact
450
kinematics but not joint displacement. Journal of Applied Biomechanics, 31(4), 205-210.
451
Benjanuvatra, N., Lay, B. S., Alderson, J. A., & Blanksby, B.A. (2013). Comparison of
452
ground reaction force asymmetry in one-and two-legged countermovement jumps. The
453
Journal of Strength and Conditioning Research, 27(10), 2700-2707.
454
Blackburn, J. T., & Padua, D. A. (2009). Sagittal-plane trunk position, landing forces, and
455
quadriceps electromyographic activity. Journal of Athletic Training, 44(2), 174-179.
456
Boling, M. C., Padua, D. A., Marshall, S. W., Guskiewicz, K., Pyne, S., & Beutler, A. (2009).
457
A prospective investigation of biomechanical risk factors for patellofemoral pain syndrome:
458
the Joint Undertaking to Monitor and Prevent ACL Injury (JUMP-ACL) cohort. The
459
American Journal of Sports Medicine, 37(11), 2108-2116.
460
Chappell, J. D., Herman, D. C., Knight, B. S., Kirkendall, D. T., Garrett, W. E., & Yu, B.
461
(2005). Effect of fatigue on knee kinetics and kinematics in stop-jump tasks. The American
462
Journal of Sports Medicine, 33(7), 1022-1029.
Cordova, M. L., Takahashi, Y., Kress, G. M., Brucker, J.B., & Finch, A.E. (2010). Influence
464
of external ankle support on lower extremity joint mechanics during drop landings. Journal of
465
Sport Rehabilitation, 19(2), 136-148.
466
Decker, M. J., Torry, M. R., Wyland, D. J., Sterett, W. I., & Steadman, J. R. (2003). Gender
467
differences in lower extremity kinematics, kinetics and energy absorption during landing.
468
Clinical Biomechanics, 18(7), 662-669.
469
Delahunt, E., Cusack, K., Wilson, L., & Doherty, C. (2013). Joint mobilization acutely
470
improves landing kinematics in chronic ankle instability. Medicine and Science in Sports and
471
Exercise, 45(3), 514-519.
472
Dingenen, B., Malfait, B., Vanrenterghem, J., Robinson, M. A., Verschueren, S.M., & Staes,
473
F.F. (2015). Can two-dimensional measured peak sagittal plane excursions during drop
474
vertical jumps help identify three-dimensional measured joint moments? The Knee, 22(2),
73-475
79.
476
Dingenen, B., Malfait, B., Vanrenterghem, J., Verschueren, S. M., & Staes, F.F. (2014). The
477
reliability and validity of the measurement of lateral trunk motion in two-dimensional video
478
analysis during unipodal functional screening tests in elite female athletes. Physical Therapy
479
in Sport, 15(2), 117-123.
480
Hewett, T. E., Myer, G. D., & Ford, K. R. (2006). Anterior cruciate ligament injuries in
481
female athletes: Part 1, mechanisms and risk factors. The American Journal of Sports
482
Medicine, 34(2), 299-311.
483
Hewett, T. E., Myer, G. D., Ford, K. R., Heidt Jr, R. S., Colosimo, A. J., McLean, S. G., Van
484
den Bogert, A. J., Paterno, M. V., & Succop, P. (2005). Biomechanical measures of
485
neuromuscular control and valgus loading of the knee predict anterior cruciate ligament
injury risk in female athletes: a prospective study. The American Journal of Sports Medicine,
487
33(4), 492-501.
488
Hopkins, W. (2018a, May 1). Precision of measurement [Internet]. A new view of statistics
489
internet society for sport science. Retrieved from:
490
https://sportsci.org/resource/stats/relycalc.html.
491
Hopkins, W. (2018b, May 1). Spreadsheets for analysis of validity and reliability [Internet].
492
A new view of statistics internet society for sport science. Retrieved from:
493
http://www.sportsci.org/resource/stats/index.html.
494
James, C. R., Bates, B. T., & Dufek, J. S. (2003). Classification and comparison of
495
biomechanical response strategies for accommodating landing impact. Journal of Applied
496
Biomechanics, 19(2), 106-118.
497
Kernozek, T. W., Torry, M. R., Van Hoof, H., Cowley, H., & Tanner, S. (2005). Gender
498
differences in frontal and sagittal plane biomechanics during drop landings. Medicine and
499
Science in Sports and Exercise, 37(6), 1003-1012.
500
King, D. L., & Belyea, B. C. (2015). Reliability of using a handheld tablet and application to
501
measure lower-extremity alignment angles. Journal of Sport Rehabilitation, 2014-0195.
502
Kovács, I., Tihanyi, J., Devita, P., RÁcz, L., Barrier, J., & HortobÁgyi, T. (1999). Foot
503
placement modifies kinematics and kinetics during drop jumping. Medicine and Science in
504
Sports and Exercise, 31(5), 708-716.
505
Lopes, T. J. A., Simic, M., Myer, G. D., Ford, K. R., Hewett, T. E., & Pappas, E. (2018). The
506
effects of injury prevention programs on the biomechanics of landing tasks: a systematic
507
review with meta-analysis. The American Journal of Sports Medicine, 46(6), 1492-1499.
McLean, S. G., Walker, K., Ford, K. R., Myer, G. D., Hewett, T. E., & van den Bogert, A. J.
509
(2005). Evaluation of a two dimensional analysis method as a screening and evaluation tool
510
for anterior cruciate ligament injury. British Journal of Sports Medicine, 39(6), 355-362.
511
Meyer, C. A., Gette, P., Mouton, C., Seil, R., & Theisen, D. (2018). Side-to-side asymmetries
512
in landing mechanics from a drop vertical jump test are not related to asymmetries in knee
513
joint laxity following anterior cruciate ligament reconstruction. Knee Surgery, Sports
514
Traumatology, Arthroscopy, 26(2), 381-390.
515
Milner, C. E., Fairbrother, J. T., Srivatsan, A., & Zhang, S. (2012). Simple verbal instruction
516
improves knee biomechanics during landing in female athletes. The Knee, 19(4), 399-403.
517
Mizner, R. L., Chmielewski, T. L., Toepke, J. J., & Tofte, K.B. (2012). Comparison of
two-518
dimensional measurement techniques for predicting knee angle and moment during a drop
519
vertical jump. Clinical Journal of Sport Medicine, 22(3), 221-227.
520
Moir, G.L. (2008). Three different methods of calculating vertical jump height from force
521
platform data in men and women. Measurement in Physical Education and Exercise Science,
522
12(4), 207-218.
523
Munro, A., Herrington, L., & Carolan, M. (2012). Reliability of 2-dimensional video
524
assessment of frontal-plane dynamic knee valgus during common athletic screening tasks.
525
Journal of Sport Rehabilitation, 21(1), 7-11.
526
Nordin, A. D., & Dufek, J. S. (2017). Lower extremity variability changes with drop-landing
527
height manipulations. Research in Sports Medicine, 25(2), 144-155.
528
Ortiz, A., Olson, S., Libby, C. L., Kwon, Y. H., & Trudelle-Jackson, E. (2007). Kinematic
529
and kinetic reliability of two jumping and landing physical performance tasks in young adult
530
women. North American Journal of Sports Physical Therapy, 2(2), 104-112.
Padua, D. A., Marshall, S. W., Boling, M. C., Thigpen, C. A., Garrett Jr, W. E., & Beutler,
532
A.I. (2009). The Landing Error Scoring System (LESS) is a valid and reliable clinical
533
assessment tool of jump-landing biomechanics: the JUMP-ACL study. The American Journal
534
of Sports Medicine, 37(10), 1996-2002.
535
Pappas, E., & Carpes, F. P. (2012). Lower extremity kinematic asymmetry in male and
536
female athletes performing jump-landing tasks. Journal of Science and Medicine in Sport,
537
15(1), 87-92.
538
Payton, C. J. (2007). Motion analysis using video. In C. J. Payton, & R. M. Bartlett (Eds.).
539
Biomechanical evaluation of movement in sport and exercise (pp. 8–32). New York:
540
Routledge.
541
Riemann, B. L., & Lininger, M. R. (2018). Statistical primer for athletic trainers: the
542
essentials of understanding measures of reliability and minimal important change. Journal of
543
Athletic Training, 53(1), 98-103.
544
Rowley, K. M., & Richards, J.G. (2015). Increasing plantarflexion angle during landing
545
reduces vertical ground reaction forces, loading rates and the hip’s contribution to support
546
moment within participants. Journal of Sports Sciences, 33(18), 1922-1931.
547
Schot, P. K., Bates, B. T., & Dufek, J. S. (1994). Bilateral performance symmetry during
548
drop landing: a kinetic analysis. Medicine and Science in Sports and Exercise, 26(9),
1153-549
1159.
550
Sigward, S. M., Pollard, C. D., & Powers, C. M. (2012). The influence of sex and maturation
551
on landing biomechanics: implications for anterior cruciate ligament injury. Scandinavian
552
Journal of Medicine and Science in Sports, 22(4), 502-509.
Stokes, M. (1985). Reliability and repeatability of methods for measuring muscle in
554
physiotherapy. Physiotherapy Practice, 1(2), 71-76.
555
Tran, T. T., Lundgren, L., Secomb, J., Farley, O. R., Haff, G. G., Newton, R. U., Nimphius,
556
S., & Sheppard, J. M. (2015). Development and evaluation of a drop-and-stick method to
557
assess landing skills in various levels of competitive surfers. International Journal of Sports
558
Physiology and Performance, 10(3), 396-400.
559
Ward, R. E., Fong Yan, A., Orishimo, K. F., Kremenic, I. J., Hagins, M., Liederbach, M.,
560
Hiller, C. E., & Pappas, E. (2019). Comparison of lower limb stiffness between male and
561
female dancers and athletes during drop jump landings. Scandinavian Journal of Medicine &
562
Science in Sports, 29(1), 71-81.
563
Withrow, T. J., Huston, L. J., Wojtys, E. M., & Ashton-Miller, J. A. (2006). The relationship
564
between quadriceps muscle force, knee flexion, and anterior cruciate ligament strain in an in
565
vitro simulated jump landing. The American Journal of Sports Medicine, 34(2), 269–274.
566
Yu, B., Lin, C. F., & Garrett, W. E. (2006). Lower extremity biomechanics during the landing
567
of a stop-jump task. Clinical Biomechanics, 21(3), 297-305.
568
Zadpoor, A. A., & Nikooyan, A. A. (2011). The relationship between lower-extremity stress
569
fractures and the ground reaction force: a systematic review. Clinical Biomechanics, 26(1),
570
23-28.
571
Zhang, S. N., Bates, B. T., & Dufek, J. S. (2000). Contributions of lower extremity joints to
572
energy dissipation during landings. Medicine and Science in Sports and Exercise, 32(4),
812-573
819.
574
575
Acknowledgments 577
None.
578
579
Author contribution statement 580
All authors contributed equally to the study design and writing of the manuscript. LH
581
collected and analysed all data.