APPLICATIONS OF ARTIFICIAL
1,*
Soni
1
PhD Research Scholar Mewar University NH
2Senior Environment Professional, En Carp
ARTICLE INFO ABSTRACT
This is attributable to pollution due to human activities such as plunging of idols of deity and divinity in the festival season
everywhere in lakes. Water environment is a compl
the demands of water environment preservation. To demonstrate the usefulness of Propagation Neural Network
physical
Gandhisagar, Ambazari and Futala lake revealed significant water pollution as compared to Gorewada lake. The WQI is continuously upgrading and the situation is becoming more alarming which demands some appropriate actions with an immediate effect to get it under control study, an attempt was made to assess WQI using Multi
feed forward back propagation algorithm has been chosen for trainin
data. The feed forward back propagation algorithm has been chosen for training and testing the experimental data. All the calculated WQI parameters in aforesaid lakes are observed to be at a medium level in rainy season, fair
summer season.
Copyright ©2015 Soni Chaubey and Mohan Kumar Patil.
permits unrestricted use, distribution, and reproduction in any medium, provided the original work is properly cited.
INTRODUCTION
Pollution is generally regarded as the result of the industrial revolution. Environmental quality of the area deteriorates mainly as a result of the increasing industrial activities. In order to find out the current status of the pollution in the area, due to the increasing trend in the industrial activities, it is essential to identify the various sources of pollution.All segments of the environment are being polluted by various ways. However water pollution has been taken under inspection since water forms an integral part of life on earth. On an average a human being consumes about two litre of water every day during his whole life period
population, increasing industrialization and urbanization is the most prominent factor to cause water pollution. Nagpur city being an industrial city has also enormous numbers of aquatic bodies. Nag river originating from Ambazari river forms a tributary of Kanhan flowing in the east through the Nagpur city. Draining of sewage forms the prime factor contrib pollution in Nag river. Gorewada lake and one tank are the two significant resources which serve the drinking water purpose in Nagpur city. Water from Ambazari lake and Futula lake is used for industrial purposes and irrigation respectively.
*Corresponding author: Soni Chaubey,
PhD Research Scholar Mewar University NH-76 Gangrar, Chhittorghara Rajasthan, India.
ISSN: 0975-833X
Article History:
Received 08th October, 2014
Received in revised form
14th November, 2014
Accepted 10th December, 2014
Published online 23rd January,2015
Key words:
Artificial Neural Network, Water Quality Index,
Lake .
RESEARCH ARTICLE
ARTIFICIAL NEURAL NETWORK IN ASSESSING WATERQUALITY:
A CASE STUDY
Soni Chaubey and
2Mohan Kumar Patil
Mewar University NH-76 Gangrar, Chhittorghara Rajasthan
Senior Environment Professional, En Carp Solution, Nagpur, Maharashtra
ABSTRACT
This is attributable to pollution due to human activities such as plunging of idols of deity and divinity in the festival season, surface runoff due to heavy rainfall, washing exercises and
everywhere in lakes. Water environment is a complex system where theological methods cannot meet the demands of water environment preservation. To demonstrate the usefulness of
Propagation Neural Network (BPNN), the Water Quality Index (WQI)
physical-chemical parameters of different sources of water. Water from different sources like Gandhisagar, Ambazari and Futala lake revealed significant water pollution as compared to Gorewada lake. The WQI is continuously upgrading and the situation is becoming more alarming
ch demands some appropriate actions with an immediate effect to get it under control study, an attempt was made to assess WQI using Multi-Layer Perceptrons (MLP) architecture. The feed forward back propagation algorithm has been chosen for trainin
The feed forward back propagation algorithm has been chosen for training and testing the experimental data. All the calculated WQI parameters in aforesaid lakes are observed to be at a medium level in rainy season, fairer in the autumn season and comparatively higher during the summer season.
Soni Chaubey and Mohan Kumar Patil. This is an open access article distributed under the Creative Commons Att use, distribution, and reproduction in any medium, provided the original work is properly cited.
Pollution is generally regarded as the result of the industrial revolution. Environmental quality of the area deteriorates mainly as a result of the increasing industrial activities. In order to find out the current status of the pollution in the area, to the increasing trend in the industrial activities, it is essential to identify the various sources of pollution.All segments of the environment are being polluted by various ways. However water pollution has been taken under s an integral part of life on earth. On an average a human being consumes about two litre of y during his whole life period .The exploding population, increasing industrialization and urbanization is the ollution. Nagpur city being an industrial city has also enormous numbers of aquatic bodies. Nag river originating from Ambazari river forms a tributary of Kanhan flowing in the east through the Nagpur city. Draining of sewage forms the prime factor contributing to pollution in Nag river. Gorewada lake and one tank are the two significant resources which serve the drinking water purpose in Nagpur city. Water from Ambazari lake and Futula lake is used for industrial purposes and irrigation respectively.
76 Gangrar, Chhittorghara
The other aquatic bodies forming the site of water pollution in Nagpur city area, namely, Lendi lake, Sakkardara lake, Gandhisagar lake, Naik lake and Khadan lake. The dumping of sewage and other impurities in Naik and Lendilake from adjacent localities is increasing drastically
The encroachment of the weeds also contributes a major portion in the overall degradation of
major lakes in Nagpur city which once use to be eco
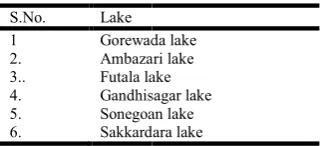
and useful purposes, have lost their grandeur and have rather become a source of nuisance. The water samples have been drawn from water sources of few lakes within the Na
[image:1.595.354.515.665.738.2]which is affected by water pollution is shown in Table 1.
Table 1. Samples of location of water from lake sources
International Journal of Current Research
Vol. 7, Issue, 01, pp.11403-11407, January, 2015
S.No. Lake
1 Gorewada
2. Ambazari lake
3.. Futala lake
4. Gandhisagar lake
5. Sonegoan lake
6. Sakkardara lake
NEURAL NETWORK IN ASSESSING WATERQUALITY:
76 Gangrar, Chhittorghara Rajasthan, India
Solution, Nagpur, Maharashtra, India
This is attributable to pollution due to human activities such as plunging of idols of deity and divinity washing exercises and sewage disposal ex system where theological methods cannot meet the demands of water environment preservation. To demonstrate the usefulness of the Back the Water Quality Index (WQI) has been used on the basis of ters of different sources of water. Water from different sources like Gandhisagar, Ambazari and Futala lake revealed significant water pollution as compared to Gorewada lake. The WQI is continuously upgrading and the situation is becoming more alarming ch demands some appropriate actions with an immediate effect to get it under control. In this Layer Perceptrons (MLP) architecture. The feed forward back propagation algorithm has been chosen for training and testing the experimental The feed forward back propagation algorithm has been chosen for training and testing the experimental data. All the calculated WQI parameters in aforesaid lakes are observed to be at a er in the autumn season and comparatively higher during the
is an open access article distributed under the Creative Commons Attribution License, which
The other aquatic bodies forming the site of water pollution in Nagpur city area, namely, Lendi lake, Sakkardara lake, e, Naik lake and Khadan lake. The dumping of sewage and other impurities in Naik and Lendilake from adjacent localities is increasing drastically (Calum2014).
The encroachment of the weeds also contributes a major portion in the overall degradation of the aforesaid lakes. The major lakes in Nagpur city which once use to be eco-friendly and useful purposes, have lost their grandeur and have rather become a source of nuisance. The water samples have been drawn from water sources of few lakes within the Nagpur city which is affected by water pollution is shown in Table 1.
Samples of location of water from lake sources
OF CURRENT RESEARCH
Lakes play an important role in the, ecological and environmental aspects of the region. Climatic factors are modified by lakes by influencing relative humidity and vegetation of the region (Sharma et al., 2014). It also acts as a re-charger for aquifers. The macroclimate of the lake supports a complex web of fauna and flora whose composition is not limited to aquatic and terrestrial flora and fauna but also includes the birds. These lakes and wetland ecosystem thus formed does not only support many bird sanctuaries but also provides a niche in the food web of organism in the ecosystem (Elshafie et al., 2011).
The main objectives of the present study is to obtain the experimental data of the status of water quality based on the physico-chemical parameters of Lakes over an annual cycle, during a period from January to December 2013 and to have an overall picture of the drastic impacts of pollutants and human actives on Gandhisagar, Ambazari, Futala and Gorewada Lake. It also aims at predicting the status of water quality in the future by using Artificial Neural Network (ANN) and concluding recommendation for improving water quality and determining the suitable usage of lakes.
MATERIALS AND METHODS
The water samples from four lakes (namely Gandhisagar, Ambazari Futala and Gorewada) were collected. The testing was done in the Hydrology project division Nagpur, in a water quality lab, Nagpur. ANN was used to predict WQI of water in the future.
For the purpose of present investigation, twelve water quality parameters have been selected. These twelve parameters are pH, Dissolved Oxygen, Turbidity, Electrical Conductivity, Total Dissolved Solids, Hardness, Calcium, Magnesium, Chloride, Biochemical Oxygen Demand, Iron and Sulphate. In the formulation of WQI, the importance of various parameters depends on the intended use of water; here water quality parameters were studied from the point of view of suitability for human consumption. The weighted arithmetic index method (Yogendra et al., 2008) has been calculated. The rating scale (qi) for ith water quality parameters (i = 1,2,3---12) was
obtained from the relation
qi= 100 ( Vi – V/ Si-V) ---(1)
(Where Vi= value of the ith parameter at a given sampling
station Si= Standard permissible value of ith parameter V=Ideal
value of ith parameter in pure water (i.e.,0 for all other parameter except the parameter pH and dissolved oxygen that is 7.0 and 14. 6 mg/L respectively)
The ‘weights’ for various water quality parameters are assumed to be inversely proportional to the recommended standards for the corresponding parameters was obtained from the relation
i i
S
K
W
...(2)
(Where Wi= unit weight for the nth parameter (i.e. i= 1, 2, 3
---12), k = constant of proportionality which is determined
from the condition and k =1 for sake of simplicity).To calculate WQI, first the sub index (SI)I corresponding the ith parameter
was calculated. These are given by the product of the quality rating qiand the unit weight Wi of the i
th
parameter (Purushottam J. Puri et al., 2010)
(SI)i = qiWi ---(3)
The following formulae are used to calculate the WQI:
WQI = ∑(SI)i /∑Wi ...(4)
Collection, preparation of water samples and analysis
One liter water samples contain were taken in transparent plastic bottles during summer, winter and rainy seasons for quality index analysis. Each sample was characterized water quality throughout the main basin of Lake, four permanent stations for monthly sampling were established and marked within the inflow (S1), outflow (S2), mid-lake region (S3) and
corner (S4). Laboratory samples were stored on ice at 4oC until
transport for analysis.
Water quality analysis
The water samples were analyzed for physico-chemical (i.e. pH, free from carbon dioxide, dissolved oxygen, biochemical oxygen demand, total alkalinity, hardness, calcium, magnesium, phosphate and ammonia). pH was evaluated by EUTECH instrument pH-510. In the laboratory electrical conductivity was calculated with microprocessor based on the conductivity TDS meter. The temperature was recorded with laboratory thermometer. These instruments were used in the limit of precise accuracy and chemicals used were of analytical grade.
Neural Network Training and Validation
ANN is a tool for data processing and consist of a large number of interrelated processing elements i.e. artificial neurons in an architecture inspired by the structure of the cerebral cortex of the brain (Tsoukalas and Uhrig, 1997). The Neural Network is based on the concept of ‘Learn from Pattern’. In this paper, Back Propagation Neural Networks (BPNN), when trained with sufficient data, proper inputs and with proper architecture has predicted the water quality very well.
The aim of the proposed method is to forecast the WQI of the water samples of various lakes around Nagpur. The artificial neural network is used as a tool for forecasting WQI using the available data. For this purpose, 12 month data were extracted from each sample (i.e. for sample location of different sites) and are used as the input of each BPNN model. The WQI in studying lakes is higher throughout the year despite the reduction effect experienced in the rainy season. The study area experiences a seasonal climate and can be broadly divided into three seasons i.e. winter (November to February), summer (March to June) and rainy (July to October).These four Samples are: S1, S2, S3 and S4 for each location and samples
target) as shown in Table 3. The WQI were determined with the assistance of physico- chemical data as shown in Table 4 and Table 5.
Data Normalization
The data are to be normalized before sending for network training. During the training of the neural network, a higher valued input variable tends to suppress the influence of the smaller value input. To eliminate this problem and in order to make neural networks perform better, the data must be well managed and scaled before giving as input to the ANN. The features data are normalized in the range 0.1 to 0.9 to minimize the effect of the input variable. The range 0.1 and 0.9 is selected in place of zero and one because zero and one cannot be realized by the activation function (sigmoid function and tansig function). All the WQI value of selected sample is normalized using the following equation.
old i value i
value value
X min
X 0.8 0.1
max min
, …………(5)
Where Xi old = actual data, max value and min value are the
maximum and minimum value of the data respectively and Xi
is the normalized data.
BPNN Model Development and Classification Accuracy
Selecting the amount of hidden neurons is important to develop the architecture of different neural network models. It consists of the input layer, hidden layer and output layer. For training
and testing purpose, the number of input layer used are one hundred ninety two (12x4x4) of Gandhisagar, Ambazari, Futala and Gorewada lake, choice of hidden layer and three
output layers. Since the input layer has one hundred ninety two neurons (i.e., 12 different months and each lake having four WQI four source location i.e,S1 S2 S3 and S4 (12X4)) and
similar way to calculate other location (12x4x4)), therefore, the models with four input layer size also differ in hidden layer size. The numbers of output neurons are constant. The difference between each model depends on the number of input neurons and hidden neurons. The size of input layer which is supposed to avoid under fitting and the number of neurons in a neural network model should not be large so that it is away from over fitting. The next step is to generate target vector data set. The target vector is chosen to be same as the number of source i.e. four. The target vector will have a value of 0.9 for its first element and all other elements will have a value of 0.1. Typical training vectors created after extracting the features from source of lakes is shown in Table 6.
Table 6. Target vector used for Back propagation
S.No. Source of water Target
Summer raining winter
1 S1 0.9 0.1 0.1
2 S2 0.1 0.9 0.1
3 S3 0.1 0.1 0.9
4 S4 0.1 0.1 0.1
RESULTS AND DISCUSSION
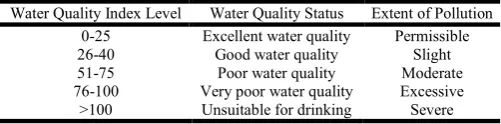
[image:3.595.174.425.116.178.2]The data in neural networks can be characterized into two sets: training sets and test sets.
Table 2. Rating scale for water quality parameter in mg/L
Water Quality Index Level Water Quality Status Extent of Pollution
0-25 Excellent water quality Permissible
26-40 Good water quality Slight
51-75 Poor water quality Moderate
76-100 Very poor water quality Excessive
[image:3.595.175.424.206.257.2]>100 Unsuitable for drinking Severe
Table 3. Average Water Quality Index in summer, winter and rainy season for sample location from Gorewada lake
Location of source Summer Rainy Winter
S1 58 48 47
S2 61 46 47
S3 58 47 43
[image:3.595.44.554.377.431.2]S4 56 45 47
Table 4.Water Quality Index forsample location from Gorewada lake
Source\ Month NOV DEC JAN FEB MAR APR MAY JUN JUL AUG SEP OCT
S1 56 55 77 87 88 47 48 58 58 47 48 19
S2 48 46 81 71 59 49 51 49 48 89 49 59
S3 44 42 48 58 47 47 48 47 46 78 57 48
S4 49 45 54 53 35 45 46 55 45 83 44 54
Table 5. Water Quality Index forsample location fromAmbazari lake
Source \ Month NOV DEC JAN FEB MAR APR MAY JUN JUL AUG SEP OCT
S1 71 47 54 64 61 51 52 51 43 36 54 75
S2 80 45 57 57 59 50 50 50 57 48 29 78
S3 50 40 53 54 55 45 56 54 54 54 54 54
Fig. 1. WQI of normalized value form (a) Futala, (b) Ambazari, (c) Gorewada and (d)Gandhisagar lake during year of session 2014 in Nagpur
The training set is used to determine the biases of a network and adjusted weights. The test data set is used for calibration, which prevents networks from essence over trained. The general approach for selecting a good training set from available data series involves including all of the extreme events (i.e. all possible minimum and maximum values in the training set).
Fig. 2.Comparison between Actual data and predicted by ANN for (a) summer, (b) rainy and (c) winter season for Gorewada Lake Table 7. Forecasting of water quality index of inflow in month of May
July and Dec in year 2013
Lake Desire(In 2013 on basis
of WQI)
Prediction by ANN (In 2013 on basis of WQI)
May Dec Jul May Dec Jul
Gandhisagar 52 51 53 51 51 54
Ambazari 58 56 50 58 56 50
Futala 50 55 52 51 54 52
[image:4.595.320.548.261.721.2]In this study, the data were divided into two sets. The second contained 70% of the data set used as the training. The first set contained 30% of the data set used as the testing set. Furthermore, one of the most important attributes of ANN is the number of neurons in the hidden layer. If an insufficient number of neurons are used, the resulting fit will be poor and the network will be unable to model the complex data. On the contrary, physico-chemical parameters in studying lakes presented distinct, temporal and spatial variants throughout the study period. Lake WQI parameters undergo seasonal changes and values are generally higher during summer season data collected from inflow, outflow, mid-lake region and corner. The current study has shown that Futala, Ambazari, Gandhisagar and Gorewada lakes are much more polluted in terms of WQI. The WQI of different lake is calculated which shows in Table 4 and 5.The features of quality of water of four samples have WQI values lying between 45 to 85. The water of lake source is unfit for human consumption. The comparison of actual data obtained from different season as well as source and predicted by ANN almost same as shown in Figure 2. ANN structure has been outlined and prepared utilizing the MATLAB neural network toolbox. The ANN method is excellent in prediction of future data basing on the previous data provided the number of data are more. So it is suitable methods can be developed to predict any physico-chemical parameter for any future years. The forecasting of WQI of inflow is shown in Table 7.
Conclusion
As compared to existing methods, proposed scheme is simple, accurate, reliable and economical. In fact, the ANN provides better results in predictions. Neural network model and regression model could develop and validate the results with those of the experimental outcomes. These approaches are also used to compare with other techniques such as multilayer regression method, fuzzy logic technique and genetic algorithm.
REFERENCES
Ajay Chaubey, H. Chelladurai 2014. “Condition monitoring of rotating shaft using virtual instrumentation”, International Conference on All India Manufacturing Technology, Design and Research Conference)”, conducted by the deptt. of Mechanical Engineering, at IIT Guwahati India. Anita Bhatnagar and Pooja Devi, 2012. “Applications of
correlation and regression analysis in assessing lentic water quality: a case study at BrahmsarovarKurukshetra, India”, International Journal of Environmental Sciences, Volume 3, No 2, Department of Zoology, Kurukshetra University, Kurukshetra, India.
Calum Mac Neil, 2014. “The pump don’t work, ‘Cause the vandals took the handles”; why invasive amphipods threaten accurate freshwater biological water quality monitoring”, Proceedings of the 18th International Conference on Aquatic Invasive Species (April 21–25, 2013), Niagara Falls, Canada
El-shafie A., M. Mukhlisin, Ali.A, Najah and M. R. Taha, 2011. “Performance of artificial neural network and regression techniques for rainfall-runoff prediction”,
International Journal of the Physical Sciences, Vol. 6(8),
pp. ISSN 1992 - 1950 1Department of Civil and Structural Engineering, University Kebangsaan Malaysia, Malaysia. Julius D. Elias, Jasper N. Ijumba, Florence A. Mamboya, 2014.
“Effectiveness and Compatibility of Non-Tropical Bio-Monitoring Indices for Assessing Pollution in Tropical Rivers - A Review”, International Journal of Ecosystem, 4(3): 128-134 DOI: 10.5923/j.ije.20140403.05, School of Materials, Energy, Water and Environmental Sciences (MEWES), Department of Water and Environmental Science and Engineering (WESE), P. O. Box 447, Arusha, Tanzania
Kavita Gupta, S. C. Verma, Meena Thakur and AakritiChauhan, 2014. “Impact of Land Uses on Surface Water Quality and Associated Aquatic Insects at Parwanoo Area of Solan District of Himachal Pradesh, India”, International Journal of Bio-resource and Stress
Management, 5(3):427-431 Dept. of Environmental
Science, Dr Y S Parmar University of Horticulture and Forestry, Nauni, Solan, HP ,India
Purushottam J. Puri, M.K.N. Yenkie, D. G. Battalwar, Nilesh V. Gandhare and Dewanand B. Dhanorkar, 2010. “Study and Interpretation of Physico-Chemical Characteristic of Lake Water Quality in Nagpur City (India)”, Department of Chemistry, L.I.T., RTM, Nagpur University, Nagpur, India.
Sharma, M. K., C. K. Jain and Omkar Singh, 2014. “Characterization of Point Sources and Water QualityAssessment of River Hindon using Water Quality Index”, Journal of Indian Water Resources Society, Vol 34, No.1, National Institute of Hydrology, Roorkee, India Thomas Clasen, Tamer Rabie, Ian Roberts and San Cairncross
2007. “Interventions to improve water quality for preventing diarrhoea: systematic review and meta-analysis”, BMJ doi:10.1136/bmj.39118.489931.BE World Bank, Washington, DC, USA
Yogendra K. and E.T. Puttaiah, 2008. “Determination of Water Quality Index and Suitabilty of an Urban Waterbody in Shimoga Town, Karnataka”,12thworld Lake conference: 3 42-346, Department of P.G. Studies and Research in Environment Science, Shimoga Karnataka, India