Review on HRV based Prediction and Detection of Heart
Disease
Santosh K. Maher
Research Student Department of Computer Science & IT, Dr.
Babasaheb Ambedkar Marathwada University,
Aurangabad
Sumegh Tharewal
Research Student Department of Computer Science & IT, Dr. Babasaheb Ambedkar Marathwada University,
Aurangabad
Abdul Hannan
Assistant Professor Albaha University
Albaha
Suvarnsing G. Bhable
Research Student
Department of Computer Science & IT, Dr. Babasaheb Ambedkar Marathwada University,
Aurangabad
K. V. Kale
Professor
Department of Computer Science & IT, Dr. Babasaheb Ambedkar Marathwada University,
Aurangabad
ABSTRACT
Heart disease is the major cause of death today. Cholesterol, blood pressure and CVD cardiovascular disease. Pulse rate are the main reason for the heart disease. Measurement of heart rate variability (HRV) its shows information on the functional state of the autonomic nervous system (sympathetic and parasympathetic). HR analysis based on measure of heart rate signal per unit of time of the number of heartbeats (identified as RR interval, as it is the time interval between successive R points of the QRS complex of the electrocardiogram and measured by the variation in the beat-to-beat interval).Heart rate variability (HRV) is a relatively new method for assessing the effects of stress on your body. It is measured as the time gap between your heart beats that varies as you breathe in and out. The heart is a key factor of the human body, acting as a pump that transfers oxygenated and deoxygenated blood around the body. Like all other organs, it is susceptible to diseases and age. Heart rate variability is a reliable indication of the many physiological factors modulating the normal rhythm of the heart. In fact, they provide a powerful means of observing the relationship between the sympathetic and parasympathetic nervous systems. It is also significantly associated with average heart rate (HR), therefore, HRV actually provides information on two quantities, that is, on HR and its variability.
Keywords
ECG (Electrocardiogram), HR, RR interval, Heart Rate Variability, KNN,GA.
1.
INTRODUCTION
The Electrocardiogram (ECG) is the most normally recorded physiological signal. It is a vital component of all diagnostic tests involving cardiac health. [1] The heart signals are taken from ECG, which is known as Electrocardiography. [2] The ECG signal contains information about electrical activity of the heart.HRV analysis is based on measuring the variability of heart rate signals, and more specifically, variations per unit of time of the number of heartbeats (also referred to as the RR interval, since it is the time interval between consecutive R points of the QRS complex of the electrocardiogram).[2] Heart rate is normally measured by doctors by feeling and counting the pulse of the pulsating arterial blood in suitable parts of the body such as
wrist and neck. HRV analysis is the ability to assess overall cardiac health and the state of the autonomic nervous system (ANS) investigate in particular in diabetic and post infarction patients dependable for regulating cardiac activity[1].because its measurements are non-invasive and easy to perform, have relatively good reproducibility and provide prognostic information on patients with heart disease. Power spectral analysis of the beat-to-beat variations of heart rate or the heart period (R–R interval) has become widely used to quantify cardiac autonomic regulation [2].The degree of variability in the HR provides information about the functioning of the nervous control on the HR and the heart’s ability to respond. Past 20 years have witnessed the recognition of the significant relationship between ANS and cardiovascular mortality including sudden death due to cardiac arrest.
2.
HRV BACKGROUND
Several numbers of papers appeared in connection with HRV related cardio coherent issues. [3] HRV is defined as fluctuation in the length of adjacent R-to-R (RR) waves-intervals. The importance in the analysis of HRV (i.e., the fluctuations of the heart beating in time,) The system operates on R-R interval data (intervals between successive R-waves of an ECG) Tulen and Man in t’veld [4] have found that, HR, diastolic blood pressure (BP), mid-frequency band power of HR and systolic BP, and plasma adrenaline concentrations showed significant increase when changed from supine to sitting to standing posture. Viktor et al. [5] have studied the variation of HR spectrogram and breathing rates in lateral and supine body positions. Recently, new dynamic methods of HRV quantification have been used to uncover nonlinear fluctuations in HR that are not otherwise apparent. Hear Rate Variability (HRV) is one such parameter that has been found to be associated with a wide variety of disorders as it is one of vital component of the physiology. Heart rate variability (HRV), the variation over time of the period between consecutive heartbeats, is predominantly dependent on the extrinsic regulation of the heart rate (HR).HRV refers to the variations in the beat intervals or correspondingly in the instantaneous HR. [9].
3.
LITERATURE SURVEY
health monitoring systems. Large number of papers appeared linking to HRV and cardiovascular diseases [2], show the importance of HRV in monitoring the health of the cardiac system. The concept of HRV (i.e., difference in variation of time intervals between subsequent heart beat) is not new. It is of much notice in recent years in this field because of low cost microcontrollers with exceptional computational power, which have given rise to the development in the research field of HRV.D. Cysarz et al [20] have intensively studied on symbolizing RR intervals with binary symbols. It was found out that it can be the key for better information on heart beat sequenciality. Dieter Verlinde et al [21] studied on the HRV of aerobic athletes and compared the former obtained parameters with that of the normal individual HRV parameters in all range of available frequencies and found that there was significant increase in the power spectrum values of aerobic subjects when compared with that of normal subjects. In addition to the traditional methods, frequency resolutions can also be obtained. In repercussion time-dependent analysis of the spectrum of HRV, using wavelets was helpful in obtaining the patterns of heart rate control. By applying wavelet transform to HRV signals, it was possible to obtain time domain representation for various frequencies of HRV i.e., Very Low Frequency, low Frequency and High Frequency by using algorithm like multi-resolution orthogonal algorithm. Results show that analysis using wavelet gives significant data for the procurement of dynamic variations and patterns in HRV in myocardial ischemia. Both time domain and frequency domain parameters obtained using wavelet transform which was extracted during night period which in turn yields the nocturnal heart analysis, provides an efficient tool for diagnosing obstructive sleep apnea [22]. It provides significant information on risked population of middle aged people suffering from sleep related disorder in breathing. Bracic et al [23] studied the human blood flow in relation to HRV in the time frequency scale, utilized morlet wavelet as the mother wavelet for this purpose and the results proved that there was a better time resolution with high frequency variables and superiority in frequency resolution for low frequency contents. HRV analysis was studied widely to measure the changes in the ANS tones when influenced by anesthetic drugs. Power spectrum measurements are widely used to access the HRV related to sympathetic and parasympathetic system. The HRV is found to be affected by change in the tone of peripheral and central nervous system. In malfunctions, it is found that there was a change in the Heart rate which was created by the modified vagal tone and fluctuated sympathetic system. Andr´e E. Aubertet et. Al [24] explained the dependability of HRV in sports especially athletes. They carried out the longitudinal and cross-sectional studies relating to athletes and their routine and explored the influence on HRV. The athlete‘s sex, age and training methods, were considered and analyzed for influence of sports on HRV of the individual. Athletes with the desire of winning practice a lot and sometimes it was found to be harmful as extra effort which results in over-training. Athletes with over training can be easily predicted by simple HRV analysis, hence the athletes can see to that they aren’t over trained and their level of training is optimal to their potential. The study of predictability in HRV among athletes and different methods for HRV in athletes are studied. Barutcu I et.al.[25] studied the variation in the time interval of diastolic and systolic of cardiac function with HRV and concluded that there are two different types of variations, variability in diastolic time and variability in the systolic time. The differences among diastolic time, systolic time variability are obtained by using sample entropy and AR model methods.
communication technology. N. Akhter et al.[35]Heart-Based Biometrics and Possible Use of Heart Rate Variability in Biometric Recognition Systems database consists of sequence of R–R intervals of 81 subjects (47 males and 34 Females) whose 512 R–R intervals were measured continuously for 10– 12 min approximately in session one, while 64 R–R intervals were measured continuously for 1–1.5 min approximately in sessions two and three with time interval of 3 months between each session. The age of the individuals varied from 18 to 69 years, with mean and standard deviation of 31 and 11, respectively. They are attempted feature generation using different techniques like statistical, spectral, time-frequency, and nonlinear like Poincare and sample entropy used in HRV analysis. In all 101 features have been obtained and to identify the features that are capable in terms of biometric identification we used SD, MI, RSFS, SFS, and SFFS feature selection techniques. The recognition rate with the ten features found in more than two groups using KNN classifier gave 82.22 % for the testing set.
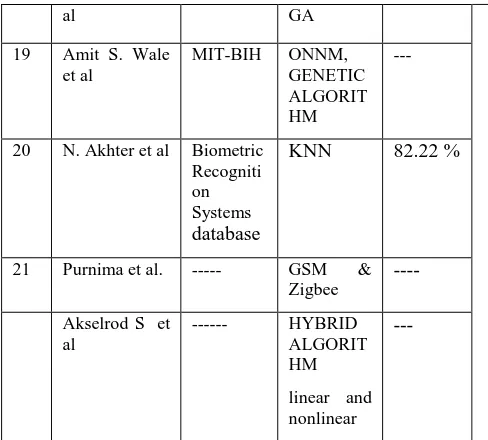
TABLE IA HRV BASED SYSTEMS DISCUSSED IN LITERATURE
Sr no
Author & Year
Database Technique s
Result
1 K. Polat et al. --- SVM 98%
2 N. Acr et al. --- SVM 96.4%
3 W. K. LEI et al
--- fuzzy sets 98.1%
4 Acharyaa et al.
--- fuzzy sets 95 to 100%
5 E. Derya et al --- ANN 98.03%
6 --- MPLNN 90.03%
7 Gler et al --- MPLNN 96.94%
8 Yu et al --- MPLNN 99.65%
9 Matthew C. Wiggins et al
--- RST 87%
10 L. Clavier et al
--- HMM 65%
11 Y. zbay et al. ---
MLP, FCNN
98.9 to 99.9%
12 Acharya et al
--- ANN AND FUZZY
80to 85%
13 Ravish et al --- ANN 97 to 99%
14 J. P. Kelwade et a
--- ANN 97%
15 Dimitra Azariadi et al
--- SVM 98.9%
16 Medina Hadjem et al
--- BNN,
UWT
96.1%
17 Bhuvaneswari Amma et al
--- ANN,
GA
94.17%
18 Nilakshi P. Waghulde et
--- ANN, 94.17%
al GA
19 Amit S. Wale et al
MIT-BIH ONNM, GENETIC ALGORIT HM
---
20 N. Akhter et al Biometric Recogniti on Systems database
KNN 82.22 %
21 Purnima et al. --- GSM & Zigbee
----
Akselrod S et al
--- HYBRID ALGORIT HM
linear and nonlinear
---
According to above study we can say a good number of the author used ANN method for prediction or detection and they have get top results.
4.
PROPOSED SYSTEM
ARCHITECTURE
[image:3.595.304.548.70.290.2]The projected system is based on a only Microcontroller chip that utilizes change in amount of reflection of light sensed by a photo transistor. The basic block diagram of the proposed system is given in Fig. 1.
Fig. 1 Proposed System Architecture
4.1
Raw Data
Heart beat detection using finger sensor model 1157 and store into CSV format in 1 min riding(60000)sec and 512 sample raw signal data store into dataset for male and female taken At
Sensor Data processing
Data Selection
Raw Data
Feature extraction
Finger Sensors
Classification
[image:3.595.332.498.413.705.2]present, our in house-generated database data take it for further process.
4.2
Data Selection
Select data which is the highest R-R (R wave to R wave interval) pick value selecting of either normal or abnormal signal data for further process.
4.3
Data Pre-processing
Typical pre-processing operations include data cleaning to filter out noisy pick data elements, pick value or data interpolation to manage with missing values, data normalization to handle with heterogeneous sources, temporal alignment, and data formatting.
4.4
Feature Extraction
This includes operations for instead of the data correctly and selecting exact features from this representation. This stage is often called feature extraction and selection.
4.5
Classification
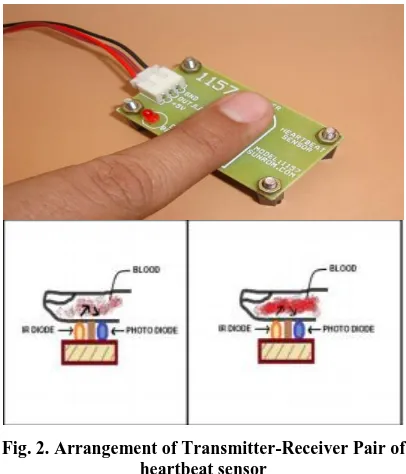
[image:4.595.317.541.72.165.2]Feature extraction based Classification use for data using KNN, SVM, ANN and Fuzzy, Hybrid Algorithm this stages is often called classification.KNN classifier gave 82.22 % for the testing set result.
Fig. 2. Arrangement of Transmitter-Receiver Pair of heartbeat sensor
[image:4.595.65.268.337.574.2]In Microcontroller heartbeat sensor, it is required to eliminate undesired noise and original signal. in addition, the signal level is to be raised to a satisfactory level so that the spikes coming from the photo transistor during each time the heart beats can be distinguished properly by the Microcontroller and every beat coming form in raw binary format 0 and 1.there is 1 symbolize beat or pick value and 0 is null value or noise.Heartbeat is sensed by using a high intensity type LED and LDR. The change in volume caused by the pressure pulse is detected by illuminating the fingertip’s skin with the light from an LED using a photodiode sensor. With each heart beat, a surge of blood is forced through the vascular system, expanding the capillaries in the finger, and changing the amount of light returning to the photo detector [37].
Fig. 3. Digitization AC to DC
5.
CONCLUSION
The HRV is mainly used for predict as well as identification of heart disease. Although HRV has been the subject of numerous clinical studies investigating a wide spectrum of cardio logical and non-cardio logical diseases and clinical circumstances, a general agreement of the useful use of HRV in adult medicine has been reached only in two clinical scenarios. Heart rate variability has significant potential to review the role of autonomic nervous system fluctuations in average healthy persons and in patients with various cardiovascular and non-cardiovascular disorders. HRV studies should enhance our understanding of physiologi-cal phenomena, the actions of medications, and disease mechanisms. Large prospective longitudinal studies are needed to determine the sensitivity, specificity, and pre-dictive value of HRV in the identification of individuals at risk for subsequent morbid and mortal events.
6.
REFERENCES
[1] Mohammad Nasim (2013) A low cost optical sensor based heart rate monitoring system Informatics, Electronics & Vision (ICIEV), 2013 International Conference on 10.1109/ICIEV.2013.6572660
[2] Saul JP (1990) Beat-to-beat variations of heart rate reflect modulation of cardiac autonomic outflow. News Physiol Sci 5:32–37
[3] Schwartz PJ, Priori SG (1990) Sympathetic nervous system and cardiac arrythmias. In: Zipes DP, Jalife J (eds) Cardiac electrophysiology. From cell to bedside. W.B. Saunders, Philadelphia, pp 330–343
[4] Akselrod S, Gordon D, Ubel FA, Shannon DC, Barger MA, Cohen RJ (1981) Power spectrum analysis of heart rate fluctuation. Science 213:220–222
[5] Tulen JH, Boomsma F, Man in t’veld AJ (1999) Cardiovascular control and plasma catecholamines during restand mental stress: effects of posture. Clin Sc 96:567–576
[6] Viktor A, Jurij-MAtija K, Roman T et al (2003) Breathing rates and heart rate spectrograms regarding body position in normal subjects. Compute Biol Med 33:259–266
[7] Cysarz D, Bettermann H, van Leeuwen P (2000) Entropies of short binary sequences in heart period dynamics. Am J Physiol Heart Circ Physiol 278:H2163– H2172
[8] Gamero LG, Vila J, Palacios F (2002) Wavelet transform analysis of heart rate variability during myocardial ischaemia. Med Biol Eng Comput 40:72–78
Theoretical and Applied Information Technology , 2005 – 2010
[10]Nazneen Akhter, Jinan Fadhil Mahdi, Ganesh R.Manza “Microcontroller based data acquisition system for Heart Rate Variability (HRV) measurement” Int. Journal of Applied Sciences and Engineering Research, Vol. 1, Issue 4, 2012.
[11]George E. Billman 1*, Heikki V. Huikuri 2, Jerzy Sacha 3 and Karin Trimmel 4 “An introduction to heart rate variability: methodological considerations and clinical applications” Department of Physiology and Cell Biology, The Ohio State University, Columbus, OH, USA published: 25 February 2015.
[12]Billman, G. E. (2011). Heart rate variability – a historical perspective. Front. Physiol.2:86. doi: 10.3389/fphys.2011.00086.
[13]Billman, G. E. (2013a). The LF/HF ratio does not accurately measure cardiac sympatho-vagal balance. Front. Physiol. 4:26. doi: 10.3389/fphys.2013.00026.
[14]Heathers, J. A. (2014). Everything Hertz: methodological issues in short-term frequency-domain HRV. Front. Physiol. 5:177. doi: 10.3389/fphys.201400177
[15]Peltola, M. A. (2012). Role of editing of R-R intervals in the analysis of heart rate variability. Front. Physiol. 3:148. doi: 10.3389/fphys.2012.00148
[16]Heart rate variability Standards of measurement, physiological interpretation, and clinical use Task Force of The European Society of Cardiology and The North American Society of Pacing and Electrophysiology European Heart Journal (1996) 17, 354–381
[17]Nasim Karim , Jahan Ara Hasan and Syed Sanowar Ali “Heart Rate Variability – A Review” Journal of Basic and Applied Sciences Vol. 7, No. 1, 71-77, 2011. ISSN: 1814-8085
[18]Advances in heart rate variability signal analysis: joint position statement by the e-Cardiology ESC Working Group and the European Heart Rhythm Association co-endorsed by the Asia Pacific Heart Rhythm Society. Euro pace (2015) 17, 1341–1353 doi:10.1093/euro pace/euv015, online publish-ahead-of-print 15 July 2015
[19]F. Buccelletti, E. Gilardi, E. Scaini, L. Galiuto, R. Persiani, A. Biondi, F. Basile, N. Gentiloni Silveri,Heart rate variability and myocardial infarction: systematic literature review and met analysis, European Review for Medical and Pharmacological Sciences, 2009; 13: 299-307
[20]A. Günther, O.W. Witte and D. Hoyer “Autonomic Dysfunction and Risk Stratification Assessed from Heart Rate Pattern” The Open Neurology Journal, 2010, 4, 39-49
[21]Cysarz D, Bettermann H, van Leeuwen P (2000) Entropies of short binary sequences in heart period dynamics. Am J Physiol Heart Circ Physiol 278:H2163– H2172
[22]Verlinde D, Beckers F, Ramaekers D, Aubert AE (2001) Wavelet decomposition analysis of heart rate variability in aerobic athletes. Auton Neurosci 90(1–2):138– 141
[23] Elsenbrunch S, Harnish MJ, Orr WC (1999) Heart rate variability during waking and sleep in healthy males and females. Sleep 22(8):1067–1071
[24] Bracic M, Stefanovska A (1998) Wavelet-based analysis of human blood-flow dynamics. Bull Math Biol 60:919– 935
[25] Andr´e E. Aubert, Bert Seps and Frank Beckers, “Heart Rate Variability in Athletes”, Laboratory of Experimental Cardiology, School of Medicine, K.U. Leuven, Leuven, Belgium, Sports Med 2003; 33 (12): 889-919.
[26] Barutcu I, Esen AM, Kaya D, Turkmen M, Karakaya O, Melek M, Esen OB, Basaran Y (2005) Cigarette smoking and heart rate variability: dynamic influence of parasympathetic and sympathetic maneuvers. Ann Noninvas Electrocardiol 10(3):324–329
[27] Pfeifer MA, Cook D, Brodsky J, Tice D, Reenan A, Swedine et al (1982) Quantitative evaluation of cardiac parasympathetic activity in normal and diabetic man. Diabetes 3:339–45
[28] Ho KK, Moody GB, Peng CK, Meitus JE, Larson MG, Levy D, Goldberger AL (1997) Predicting survival in heart failure case and control subjects by use of full automated methods for deriving nonlinear and conventional indices of heart rate dynamics. Circulation 96:842– 848
[29] Akselrod S, Gordon D, Ubel FA, Shannon DC, Barger MA, Cohen RJ (1981) Power spectrum analysis of heart rate fluctuation. Science 213:220–222
[30] Nazneen Akhter, Sumegh Tharewal, Vijay Kale, Ashish Bhalerao and K.V. Kale,” Heart-Based Biometrics and Possible Use of Heart Rate Variability in Biometric Recognition Systems”
[31] Hoang ChuDuc* , Kien NguyenPhan, Dung NguyenVietA ,”Review of Heart Rate Variability and its Applications” ICBET 2013: May 19-20, 2013, Copenhagen, Denmark,
[32] Warsuzarina Mat Jubadi, Siti Faridatul Aisyah Mohd Sahak, “Heartbeat Monitoring Alert via SMS” 2009 IEEE Symposium on Industrial Electronics and Applications (ISIEA 2009), October 4-6, 2009, Kuala Lumpur, Malaysia.
[33] Purnima, Puneet Singh, “Zigbee and GSM Based Patient Health Monitoring System”, Interntional Conference on Electronics and Communication System (IECS -2014)
[34] D.J.R.Kiran Kumar, Nalini Kotnana, “Design and Implementation of Portable health monitoring system using
PSOC mixed signal Array chip”, International Journal of Recent Technology and Engineering (IJRTE), ISSN: 2277-3878, Volume-1, Issue-3, august 2012.
[36]Amit S. Wale “ Signal Analysis And Prediction Of Heart Attack With The Help Of Optimized Neural Network Using Genetic Algorithm” international conference on emerging trade in engineering technology, science and management IIMT college of Engineering, greater noida, India 12 April 2017 ISBN 978-93-8617-38-2