http://wrap.warwick.ac.uk
Original citation:
Hooper, James Michael and Marco, James. (2015) Experimental modal analysis of
lithium-ion pouch cells. Journal of Power Sources, Volume 286 . pp. 247-259. ISSN
0378-7753
Permanent WRAP url:
http://wrap.warwick.ac.uk/66951
Copyright and reuse:
The Warwick Research Archive Portal (WRAP) makes this work of researchers of the
University of Warwick available open access under the following conditions.
This article is made available under the Creative Commons Attribution 4.0 International
license (CC BY 4.0) and may be reused according to the conditions of the license. For
more details see:
http://creativecommons.org/licenses/by/4.0/
A note on versions:
The version presented in WRAP is the published version, or, version of record, and may
be cited as it appears here.
Experimental modal analysis of lithium-ion pouch cells
James Michael Hooper, James Marco
*WMG, University of Warwick, Coventry CV4 7AL, UK
h i g h l i g h t s
Experimental assessment of the frequency response of a Li-ion pouch cell.
Assessment of the mode shapes for a Li-ion pouch cell using impulse excitation.
Quantifying cell stiffness as a function of state of charge.
Quantifying cell damping as a function of state of charge.
Correlation of the cell's frequency response with road-induced vibration profiles.
a r t i c l e i n f o
Article history:
Received 11 December 2014 Received in revised form 12 February 2015 Accepted 15 March 2015 Available online 17 March 2015
Keywords: Modal analysis Vehicle vibration Electric vehicle (EV) Hybrid electric vehicle (HEV) Battery testing
Noise vibration and harshness (NVH)
a b s t r a c t
If future electric and hybrid electric vehicle batteries are to be designed such that the impact of vibration induced resonance is minimized, engineers tasked with the design of the vehicle's energy storage system must have a rigorous understanding of key system attributes such as the natural frequencies of the cell, the level of damping present and the mode shapes induced within the battery under mechanical load. This paper describes the underpinning theory and experimental method employed when using the impulse excitation technique to quantify the natural frequencies and mode shapes of a commercially available 25 Ah Nickel Manganese Cobalt Oxide (NMC) Laminate Pouch Cell. Experimental results are presented forfifteen cells atfive different values of state of charge (SOC). The results indicate that irrespective of the energy content within the cell, the same four modes of vibration (torsion and bending) exist within a frequency range of 191 Hze360 Hz. This is above the frequency range (0e150 Hz) typically associated with road-induced vibration. The results also indicate that the cell's natural frequencies of vibration and damping do not vary with changing values of SOC.
©2015 The Authors. Published by Elsevier B.V. This is an open access article under the CC BY license (http://creativecommons.org/licenses/by/4.0/).
1. Introduction
Within the automotive and road transport sector, one of the main drivers for technological development and innovation is the need to reduce the vehicle's fuel consumption and the emissions of carbon dioxide (CO2). Legislative requirements are motivating vehicle manufacturers and subsystem suppliers to develop new and innovative electric vehicle (EV) and hybrid electric vehicle (HEV) concepts. Within thisfield, a key enabling technology is the design and integration of the high voltage (HV) battery system.
The impact of mechanical vibration on the vehicle's electrical and electronic components and subsystems is known to be a major cause of in-market durability failure [1]. If excessive warranty
claims are to be avoided, it is important that engineers tasked with the design of the HV battery system, properly understand the magnitude and frequency of the vibration inputs that the energy storage system will be exposed too during the vehicle's predicted life. If future vehicle battery systems are to be designed such that the impact of vibration induced resonance is minimized, engineers must have a rigorous understanding of key system attributes such as the natural frequencies of the cell, the level of damping for each natural frequency and the mode shapes induced within the cell when it is under mechanical load (e.g. the presence of bending, torsional or panting modes).
Experimental modal analysis measures the natural vibration response of a system. To ensure vehicle durability it is necessary to determine, at the design stage, the natural vibration characteristics of components, both in isolation and when they are aggregated into larger vehicle sub-systems. Recent studies[2]have highlighted that if a system was allowed to vibrate at one of its modal frequencies
*Corresponding author.
E-mail addresses: [email protected] (J.M. Hooper), james.marco@ warwick.ac.uk(J. Marco).
Contents lists available atScienceDirect
Journal of Power Sources
j o u r n a l h o m e p a g e : w w w . e l s e v i e r . c o m/ l o ca t e / j p o w s o u r
http://dx.doi.org/10.1016/j.jpowsour.2015.03.098
with excessive, sustained, oscillatory motion permanent deforma-tion or structural damage may occur. One example of an automo-tive component that failed through sustained excitation at one of its natural frequencies is presented within[1]. The research discusses the complete mechanical failure of the component after only 7000 km of driving [1]. The failure mode was identified using modal analysis techniques. The study found that thefirst natural frequency of the component occurred at 52.2 Hz and the road-load profile induced an accelerated fatigue condition within the device. Modal analysis is not limited to small components or systems. The methodology is also widely employed within the civil engineering domain, for example when assessing the structural integrity of bridges[3]. A recent study from the UK[3]highlights the applica-tion of modal analysis for understanding the undesirable swaying motion experienced when the Millennium Bridge was opened in London during the year 2000. It was identified that the 1st and 2nd natural modes of vibration for the bridge occurred between 0.5 and 1 Hz respectively and pedestrians excited these modes when they traversed the bridge[3]. Due to excessive motion of the structure and the subsequent fears for public safety, the bridge was closed until 2002, while engineer's integrated additional dampers within the bridge to reduce the amplification associated with the natural frequencies.
This paper describes the underpinning theory and experimental method employed when using the impulse excitation technique to quantify the natural frequencies and mode shapes of a commer-cially available 25 Ah Nickel Manganese Cobalt Oxide (NMC) Laminate Pouch Cell. From the experimental results obtained, values for cell damping and stiffness are estimated. Through the evaluation of different cells at the same SOC and at different values of state of charge (SOC), this research has been able to quantify the variability in the mechanical frequency response of the cells due to cell-to-cell manufacturing variations and stored energy.
This paper is structured as follows; Section 2 discusses the concept of mechanical testing for Li-ion cells and Section 3 in-troduces the experimental theory that underpins modal analysis. Section4describes the experimental set-up and method employed when undertaking modal analysis with a Li-ion pouch cell. Key results and discussions are presented in Section5, with conclusions and further work presented inSections 6 and 7respectively.
2. Related research
Research undertaken into the mechanical testing and charac-terization of Li-ion cells, particularly within the context of designing and testing the vehicle's HV battery system can broadly be classified as being based on either static or dynamic test methods[2]. Irrespective of the exact methodology employed, the primary motivation for performing such experiments is often the generation of data to either parameterize or validate highfidelity finite element models of the battery system to better understand the impact of mechanical loading[2]. Research that aims to quan-tify pertinent material properties under a combination of different environmental conditions with varying mechanical and electrical loads includes, but is not constrained too: assessments of me-chanical stress and strain within the numerous different compo-nents that comprise the cell (outer casing, electrodes, separators and current collector) [2,4e6], quantifying the creep within a representative sample of conductive material at different temper-atures[6]and measuring the volume expansion of a pouch-cell during chargeedischarge conditions[8].
In addition to the performance evaluation of different cell chemistries and formats, there is also a significant body of research that attempts to quantify the mechanical robustness (crashwor-thiness) of the cell or complete battery system. Examples of recent publications include the mechanical crushing of the cell[4,7,9], the effect of cell penetration[2,10], assessing the durability of the cell against impact[4,9]and mechanical shock[4]and understanding the fatigue conditions and possible failure modes of the battery system due to extreme variations in temperature and pressure
[11,12]. The need to conduct such tests is often driven by the requirement to satisfy whole vehicle crash homologation Standards
[13,14]and legislation, such as UN38.3, that governs the trans-portation of dangerous goods[15e17].
In recent years, there has been comparatively less research addressing the mechanical durability and vibration response of individual cells or the complete battery system. Research has been published[18]that correlates mechanical fatigue within the cell to the use of repetitive deep-discharge cycles. However, as discussed within Section1, another of source of mechanical fatigue within the battery may well be the vibration-induced resonance resulting
Nomenclature
Terms and abbreviations
BMS battery management system dB decibels
EMS electromagnetic shaker EV electric vehicle
FRF frequency response function HEV hybrid electric vehicle HV high voltage
Li-ion lithium ion
NMC nickel manganese cobalt NVH noise vibration and harshness PSD power spectral density SISO single input single output SOC state of charge
Mathematical notationesymbols and units fmax maximum frequency Hz
kp tip stiffness Nm1 kc cell stiffness Nm1 mH hammer mass kg mc cell mass kg Q qualityfactor
-T time s
u
frequency rads1u
n natural frequency rads12
damping ratio -Gxy(f) cross-spectral density Gxx(f) auto-spectral density (x) Gyy(f) auto-spectral density (y) x(t) system input (time domain) y(t) system output (time domain) X(s) system input (laplace domain) Y(s) system output (laplace domain)from the road-profile when the battery is mounted to the sprung mass of the EV or HEV[19e21].
Only a single study has been identified that attempts to quantify the natural frequencies of a Li-ion pouch cell[2]. A program of experimental modal analysis is described within[2]in which im-pulse excitation tests are performed on aused but serviceable10 Ah Li-ion pouch cell. This study observed three modes within the 0e1000 Hz range, with thefirst mode occurring at approximately 267 Hz. While this study validates the fundamental concept of frequency analysis of a Li-ion cell using the impulse excitation method, there are a number of shortcomings associated with the scope of the research that limit its applicability and the conclusions that can be drawn. Firstly, the study failed to quantify either the damping or the stiffness present within the cell. Secondly, only a very limited sample size of four cells was employed, with each cell maintained at the same environmental conditions and the same SOC. The aim of this research is to extend that presented within[2].
3. Experimental theory
The aim of this section is to describe the theory associated with modal analysis using impulse excitation. Particular consideration is given to the method employed to secure and mount the pouch cell during testing, the excitation technique and the interpretation of the results obtained.
3.1. Cell mounting and support
When conducting experimental modal analysis, it is necessary to ensure that the correct method of support is selected. There are typically two options available, either unrestrained (freeefree) or clamped (grounded). This discussion will primarily address the unrestrained support, since this was the method employed within the experimental activity. The use of an unrestrained support me-dium is preferred since the results obtained reflect only the me-chanical properties of the component. Rigidly clamping the component to the testfixture is only used to emulate the in-service mounting conditions of the device and therefore includes the dy-namics of the component and its support structure. A further detailed discussion of each support method is provided in Ref.[22]. The definition of an unrestrained support is a where the component is freely suspended in space[22,23]. Within this ideal, the component exhibits six rigid body modes; three displacements (in the x, y, z co-ordinate axis) and three rotations around each of the three axes[22,23]. Because this ideal condition assumes that no boundary condition exists, reactions between the support and the component have a natural frequency equal to zero. In practice, components are suspended on soft springs or foam pads. As a result, a truefreeefreesupport condition can never be realized. The use of low-density foam pads results in the six ridged body modes occurring at very low natural frequencies. In practice a support method and component is regarded as being within thefreeefree conditionif the highest natural frequency of the support medium is less than 10% of the value of the lowest natural frequency of the component under test or if there is at least a 100 Hz separation between them. The experimental results presented in Section5, highlight a frequency separation of approximately 150 Hz between the foam pads employed to support the Li-ion pouch cells and the first natural frequency of the cell itself (irrespective of the cell's SOC).
3.2. Cell excitation and response measurement
There are three methods of excitation commonly employed when measuring the modal response of a component or system;
impulse excitation (often referred to as either hammer surveying, impact testing or impact excitation), dynamic excitation and operational excitation.
Operational excitation requires the system to be subject to the actual loading profile that it will experience within the real world. This method is typically only employed when the system will be subject to a predefined loading or in conjunction with the impulse or dynamic excitation as afinal verification test. Given the diverse nature of the different terrain profiles experienced by vehicles within either urban or highway environments in different parts of the world, the use operational excitation would not be appropriate to assess the natural frequency of an EV or HEV battery system. Dynamic excitation is often employed for components that may be damaged through impulse excitation [22]. Dynamic excitation typically employs a small electro-magnetic shaker (EMS) or hy-draulic shaker to apply a known input (force and frequency) to the device or structure. The advantages of dynamic excitation are often cited to include a more repeatable test profile[22e24], with the ability to apply a broader range of test signals (force and frequency range). However, the resources required to implement a test pro-gram are equally more demanding. Thefinancial cost of the EM or hydraulic shaker may well be prohibitive for a number of end-users
[22,24]. Similarly, the effort required to emulate the desired freeefreetest condition will require the design of a bespoke test assembly in which the cell is suspended onto the shaker. For these reasons, impulse excitation was defined as the desirable test method. For completeness, further information on both operational and dynamic excitations methods can be found in Refs.[22,25].
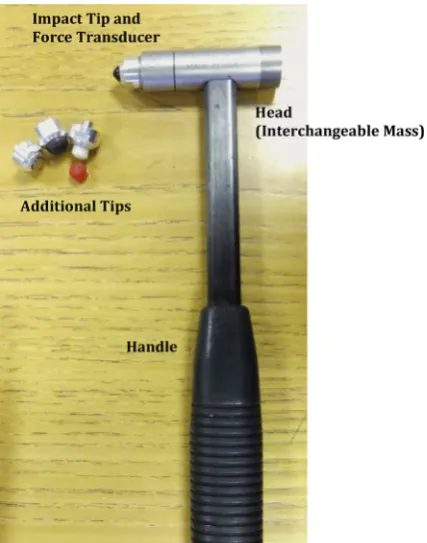
[image:4.595.331.545.451.723.2]In addition to those reasons highlighted above, the reasons often cited for the use of impulse excitation include; reduced test prep-aration time, no specific requirements for test infrastructure (particularly when employed to undertake unrestrained testing) and the cost of the test equipment is not prohibitive[22e25]. Im-pulse excitation is performed using an impact device such as an instrumented hammer of calibrated mass. A typical instrument is
shown inFig. 1. The device consists of a head which can allow for the inclusion of additional masses, a calibrated force transducer, an interchangeable impact tip and handle[22,24]. A collection of tips are often supplied, each of different stiffness to allow the user to vary the characteristics of the impulse applied. The force transducer detects the magnitude of the impact force that is assumed to be equal and opposite to that experienced by the structure. As dis-cussed within [22,25], through careful selection of the hammer mass (Hm) tip stiffness (kp), the upper frequency (fmax) that the input excitation will excite can be approximated using(1).
fmax¼21 p ffiffiffiffiffiffiffiffiffiffiffiffiffiffi kp Hm s (1)
The frequency (fmax) defines the cut-off frequency above which the energy supplied by the hammer reduces at a rate of 40 dB per decade. Section 4 discusses further the actual instrumentation employed within the experimental work, including the selection of hammer mass and tip stiffness to evaluate the frequency response of the NMC Li-ion pouch cell.
Publications[22,24,25]state that the disadvantages associated with the use of impulse excitation include: the limited control of the experimental frequency range and a relatively high potential for operator error and measurement inaccuracy. Section4discusses further the steps employed to post-process the experimental re-sults to reduce potential inaccuracy throughspectrum averaging.
3.3. Mounting of accelerometers
A key requirement for any modal analysis is the accurate mea-surement of the applied force and the response of the component. For impulse excitation, the input force is measured via a load cell installed within the impact hammer. Conversely, the vibration response of the component is measured using either single or multiple accelerometers mounted to the surface of the component. When mounting the accelerometers, the combined weight of the sensor including any mounting interface or adhesive must be less than 1% of the mass of the component[22]. As discussed within
[22], above this threshold there is the potential to significantly change the natural frequency of the component and its frequency response. When selecting an accelerometer, there is typically a comprise between component weight and sensitivity; reducing the mass of the sensor will reduce its sensitivity, but will increase the frequency range of measurement[22].
There are multiple methods of bonding the accelerometers to the component. These include stud mounting, magnetic mounting or pad mounting. For the experimentation discussed inSections 4 and 5, an adhesive was employed to bond the accelerometer to the surface of the cell. Compliant materials, such as mounting waxes or interface mounts, can create a mechanicalfiltering effect by isolating and damping high-frequency transmissibility[26]. As discussed within[27], Petro-wax is often employed as it requires minimal surface preparation and does not significantly reduce the effective frequency range of the transducer [27]. Petro-wax is known to be a durable adhesive at lower temperatures, has a quick application time and no cure time. However, its transmissibility properties at high levels of force are limited and as such, it is only suitable for frequencies below 10 kHz[26]. It is also significantly affected by temperature elevation above a threshold of 30C.
3.4. Signal analysis and interpretation
3.4.1. System dynamics
Impulse excitation is based on the assumption that the component under evaluation is a Linear Time Invariant (LTI)
system.Linearity means that the relationship between the input and the output of the system follows the law of superposition. Namely, if x1(t) produces a response y1(t) and x2(t) produces a responsey2(t), then a scaled and summed input ofax1(t)þbx2(t) will produce an output:ay1(t)þby2(t).Time invariancemeans that for the inputx1(t) the output isy1(t), the inputx1(tT) will produce the same output delayed in time by a value of T:y1(tT).
The Impulse function,
d
(t), is defined as a signal in which the amplitude (A):A/∞, while the time duration of the signal (t): t/0. The value (area) ofd
(t) is unity. For an LTI system:YðsÞ ¼HðsÞXðsÞ (2)
whereY(s) is the output,X(s) is the input andH(s) is the transfer function that defines the dynamics of the system andsis the Lap-lace operator. WhenX(s) equals unity, the outputY(s)¼H(s). Given that:
HðjuÞ ¼HðsÞs¼ju (3)
means that the resulting frequency response function (FRF) char-acterises completely the dynamics of the system in terms of both gain and phase:
Gain¼ jHðjuÞj (4)
Phase¼:HðjuÞ (5)
When quantifying the damping ratio and stiffness of the cell, the assumption is made that the system is dominated by second-order dynamics. As a result, the system transfer function can be approximated by:
HðjuÞ ¼ u2n
u2 nu2
j22unu
(6)
where
u
ndefines the natural frequency and2
the damping ratio. Assuming the cell can be represented by a 2nd order mechanical (mass-spring-damper) system and with reference to(6), the bulk stiffness within the cell can be approximated from:kc¼u2nmc (7)
wherekc and mc define the cell stiffness and mass respectively. From the FRF measured, the level of damping for each natural frequency observed can be approximated from:
2¼ 1
2Q (8)
where Q is defined as the Quality-Factor and equal to:
Q¼un
Du (9)
where
D
u
defines the width of the range of frequencies for which the energy within the system output is at least half of its peak value.3.4.2. Coherence
The coherence function, Gxy(f), given by (10), indicates the portion of the output energy correlated to the input energy[22].
GxyðfÞ ¼
GxyðfÞ2
GxxðfÞGyyðfÞ (10)
and the output y, and Gxx(f) and Gyy(f) define the auto-spectral density of the signals x and y respectively.Gxy(f) is used in exper-imental modal analysis to identify excess noise or uncertainty be-tween the input and the output[22,28,29]. Equation(10)yields a value between zero and unity. A value of one at a given frequency indicates that all of the response energy is due to the stimulus or input signal. Conversely, a value of zero indicates that there is no correlation between the input and output signals [22]. When reviewing results, a value ofGxy(f) greater than 0.9 is deemed to represent a valid measurement point.
3.4.3. Mode shape definition
[image:6.595.311.563.85.155.2]To identify the mode shapes generated within a given structure multiple FRFs must be recorded from multiple locations and a response matrix generated in which each FRF is mapped to a location and excitation. Mode shapes cannot be determined from a single FRF and/or from a single test position.Fig. 2 presents an illustrative example that explains the source of the mode shapes
[25,30].
Within this example there are six locations on a rectangular structure where the input excitation is applied.Fig. 2(a) shows that thefirst mode shape for the structure, correlating to thefirst nat-ural frequency, is a bending moment. The bending moment is produced since the FRF at positions 1, 2, 5 and 6 are in anti-resonance, while the response in positions in 3 and 4 are in reso-nance. Correlating the FRFs to a simple mesh model of the structure facilitates the definition of the mode shape. Similarly, Fig. 2(b) shows the mode shape for the second natural frequency, in which the FRF at positions 1 and 6 are positive whereas at positions 2 and 5 they are in anti-resonance. As a consequence, the mode shape corresponding to the second natural frequency is torsion. The experimental method and results presented inSections 4 and 5
describe the use of MATLAB and IDEAS to generate the respective FRFs and mode shapes for the Li-ion cells.
4. Experimental setup
4.1. Cell conditioning
The frequency response offifteen commercially available 25 Ah pouch cells was evaluated. In order to study the impact of cell-to-cell variations and the differences in the cell-to-cell's FRF that may arise due to changes in SOC, three cells were charged to the SOC values: 10%, 25%, 50%, 75% and 90%.Table 1defines the SOC value for each of thefifteen cells under test. The SOC range was primary selected, since as reported within[1,2]to militate against the effects of cell degradation the battery management system (BMS) will often seek
to constrain the SOC and limit excursions to values greater than 90% or less than 10%. Furthermore, while the theory of modal analysis could be applied to a damaged cell, all of the cells employed within this study were deemed to be within the manufacturer's specifi -cation. Overcoming the health and safety implications of testing a damaged cell was deemed to be outside of the scope of this study. In addition, even when performing such experimental research it would be desirable to have the FRF for an undamaged cell to facilitate a comparison between the two datasets (for example to identify any changes in the natural frequency, phase-shift, stiffness or damping within the battery).
The constant current (CC) constant voltage (CV) charging/dis-charging procedure employed to pre-condition the cells is sum-marized below:
Cell discharged at 1C (CC-CV) to manufacturer's defined lower voltage threshold at which point the cell voltage was allowed to stabilize for 3 h.
Cell charged at 1 C (CC-CV) to manufacturer's defined upper voltage threshold at which point the cell voltage was allowed to stabilize for 3 h.
Cell discharged at 1 C (CC-CV) to a voltage threshold commen-surate with the target SOC value and allowed to stabilize for 3 h.
During the pre-conditioning phase, the storage and cycling of each cell was undertaken within a temperature-regulated envi-ronment (T¼25C).
4.2. Modal analysis
As discussed in Section3, the method of experimental modal analysis chosen was to conduct ahammer surveyvia a Single Input Single Output (SISO) method.Fig. 3displays the grid layout marked onto each cell. Each intersection (locations 1e25) defines a unique impact point. Each cell location was impactedfive times and the results of each measurement averaged to generate a SISO response for that test location.
[image:6.595.145.467.585.727.2]Fig. 2.Definition of mode shapes from multiple frequency response functions[30]. Table 1
Preconditioned cell SOC values for the experimental modal analysis.
SOC (%) Cell quantity Cell serial numbers prepared to this SOC
10 3 259, 267 and 268 25 3 260, 261 and 266 50 3 262, 264 and 265 75 3 263, 269 and 270 90 3 273, 275 and 276
The testing of each cell was conducted within an air-conditioned laboratory, with a regulated temperature of 21 C. Testing was conducted using an impulse hammer (type: PCB 086C08). The mass of the hammer was 0.32 kg and the tip stiffness was approximately equal to 3158 k Nm1. From Equation (1), this provided a
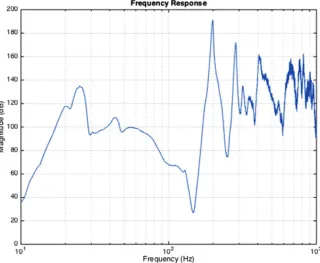
measurement frequency range of approximately 0e500 Hz and encompasses the region of typical road induced vibration[19]. A single axis accelerometer (type: PCB 352C65) was employed to measure the output vibration from each cell. Fig. 3 shows the location on the cell where the accelerometer was bonded. The weight of the accelerometer was 2 g (less than 0.4% of total cell mass); minimizing the possibility of experimental error through increasing the mass of the cell. Due to the irregular surface of the cell and the desire not to change the structure or to damage the cell (that may result through the use of permanent adhesives), the accelerometer was bonded to the cell surface using petro-wax. The data logger and frequency analyzer employed was a Brüel and Kjær 7539A Controller and a Brüel and Kjær 3038 type Input Module. During the modal analysis, each cell was placed on four blocks of polyurethane foam that were approximately 40 mm40 mm by 20 mm deep. The blocks were positioned under the four corners of the cell.Fig. 4shows an example frequency response (magnitude plot) for one pouch cell mounted on the foam pads. It can be seen that lowest natural frequency of the cell is approximately 200 Hz, whereas the highest resonance of the foam pad occurs at approx-imately 36.5 Hz. As discussed in Section3.1, this level of frequency separation between the mounting medium and the cell, confirms the requiredfreeefreetest condition.
4.3. Data analysis and post-processing
[image:7.595.34.281.59.366.2]For each cell defined in Table 1, the following method was employed to post-process the measured data and to quantify the cell's frequency response function (FRF). FromEquations (4) and (5), it is possible to calculate the FRF for each of the cell's 25 impact locations. Given the geometry of each cell and the di-mensions of the measurement grid shown inFig. 3, the Brüel and Kjær software (that include elements of IDEAS functionality) is able to quantify the mode shapes for each natural frequency within the cell. The mathematical software MATLAB was also employed to average each of the 25 frequency responses for each cell into a single FRF for the cell. As discussed in Section 3, based on the Fig. 3.Grid layout employed for SISO impulse excitation tests.
[image:7.595.133.454.463.726.2]average frequency response and throughEquations (7)e(8), it is possible to estimate the damping for each natural frequency and the bulk stiffness of the cell.
5. Results
5.1. Cell natural frequencies and modal shapes
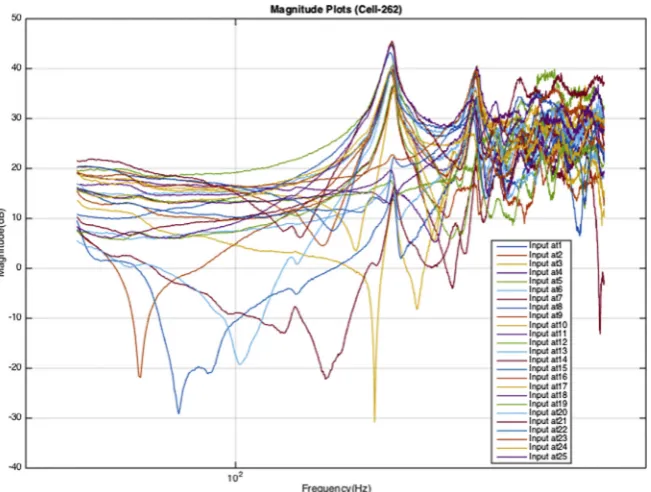
Fig. 5presents the twenty-five frequency response (magnitude)
plots for Cell 262 that correspond to each impact location defined in
Fig. 3. Using MATLAB, an averaged FRF was calculated for the cell.
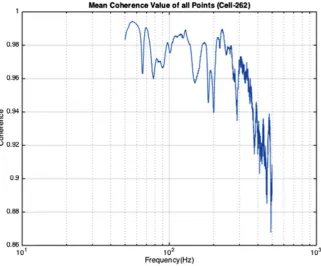
[image:8.595.142.468.65.311.2] [image:8.595.141.465.460.730.2]Figs. 6 and 7present the gain and phase components of the aver-aged FRF respectively. As it can be seen, the cell exhibits seven natural frequencies (represented by the peaks in the magnitude plot and a corresponding transition in the phase plot). The coher-ence plot presented inFig. 8demonstrates a high degree of corre-lation between the input and output energy levels (greater than 92%) for frequencies up to 400 Hz. Above this threshold the Fig. 5.Cell 262efrequency response (magnitude plots) for each impact location.
coherence value reduce as external disturbances and non-linearities dominate the cell's response. As discussed in Section
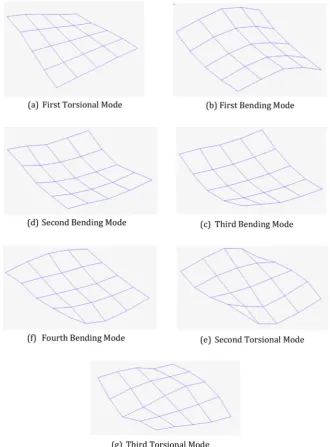
4.3, taking the geometry of the cell into consideration it is possible to identify the mode shapes for the cell.Fig. 9presents the seven mode shapes calculated through the IDEAS software. Video 1, available within the electronic version of this paper, presents the animated version of Fig. 9 and clearly shows the interaction
between the different torsional and bending modes excited within the cell.
Supplementary video related to this article can be found at
http://dx.doi.org/10.1016/j.jpowsour.2015.03.098
[image:9.595.132.455.66.334.2] [image:9.595.133.455.462.728.2]Table 2presents the complete results from the modal analysis. The table defines the natural frequencies measured for each cell. As it can be seen, irrespective of the SOC value, the same initial four Fig. 7.Cell 262eaveraged frequency response (phase plot).
Fig. 9.Cell 262eseven modal shapes corresponding to each natural frequency.
Table 2
Estimated natural frequencies for each cell corresponding to the seven mode shapes identified. Cell ID SOC (%) First torsional
mode (Hz)
First bending mode (Hz)
Second bending mode (Hz)
Third bending mode (Hz)
Fourth bending mode (Hz)
Second torsional mode (Hz)
Third torsional mode (Hz)
259 10 191.5 271.5 293 351 408 468
267 10 203.5 291 316 337.5 380 442 489.5
268 10 202 296 307 357 403.5 474
260 25 195 278.5 293.5 347 370 414 475
261 25 186 267.5 316 336
266 25 193 289.5 334.5 360 378.5 401.5 453.5
262 50 197.5 285.5 313 346.5 377.5 407 478.5
264 50 200.5 286 313 367.5 389 446.5
265 50 197.5 262.5 288 339.5 380 410 461
263 75 201 283.5 298.5 357.5 386 412.5 471
269 75 199 282.5 297.5 340.5 378 395.5 456.5
270 75 201.5 294.5 323 342.5 389.5 423 472.5
273 90 200.5 282.5 305 353 397.5 417.5 491
275 90 205.5 287.5 306 356 396 416 478
[image:10.595.44.561.586.742.2]modes (torsion, bending, bending and bending) are present in each cell at frequencies in the order of: 191e205 Hz; 262e296 Hz; 288e334 Hz and 337e360 Hz respectively. However, above approximately 350 Hz some of the cells exhibit different dynamic behavior. For example, the fourth bending mode is only present in a
subset of the cells charged to 10% and 25% SOC. Similarly, from the frequency response data measured for Cell 264 there was no discernable resonance at: 400 Hz (corresponding to the second torsional mode) and for cell 261, it was not possible to identify any resonances above 336 Hz. One reason for this can be seen from the corresponding coherence plot for cell 261 that clearly shows a reduction in coherence to nearly 40%. The most likely reason for this is operator error during the experiment.
Acknowledging the sample size for this experiment is relatively small; the results presented inTable 2imply that the natural fre-quencies for the Li-ion cell are not dependent on the cells SOC. Differences in resonance, between cells, for a given SOC are most likely attributable to cell-to-cell variations resulting from the manufacturing processes employed. As part of the study, the mass and dimensions (width, length and thickness) of each cell were recorded and differences in the order of 1 mm were noted between the thinnest and thickest cell. It is noteworthy that 80% of cells tested were outside of the specified manufacturing tolerance for thickness, at one or more measurement location.
[image:11.595.37.553.86.241.2]5.2. Cell damping
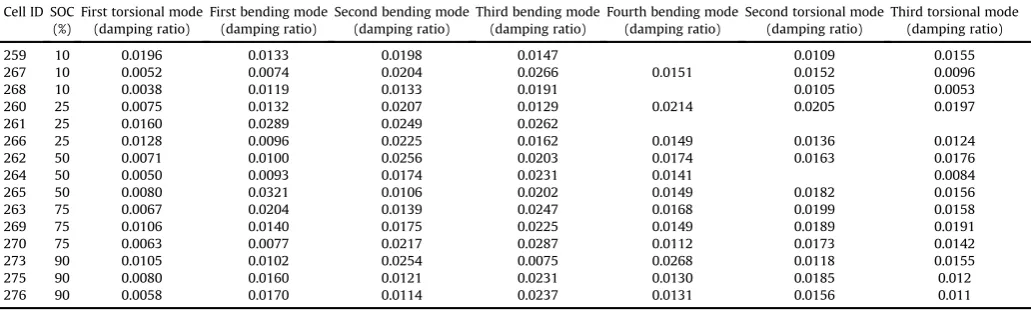
Table 3presents the damping coefficient (
2
) calculated from Equation(8)for each of the seven mode shapes and for each cell. Table 3Calculated damping coefficient for each cell and natural frequency. Cell ID SOC
(%)
First torsional mode (damping ratio)
First bending mode (damping ratio)
Second bending mode (damping ratio)
Third bending mode (damping ratio)
Fourth bending mode (damping ratio)
Second torsional mode (damping ratio)
Third torsional mode (damping ratio)
259 10 0.0196 0.0133 0.0198 0.0147 0.0109 0.0155
267 10 0.0052 0.0074 0.0204 0.0266 0.0151 0.0152 0.0096
268 10 0.0038 0.0119 0.0133 0.0191 0.0105 0.0053
260 25 0.0075 0.0132 0.0207 0.0129 0.0214 0.0205 0.0197
261 25 0.0160 0.0289 0.0249 0.0262
266 25 0.0128 0.0096 0.0225 0.0162 0.0149 0.0136 0.0124
262 50 0.0071 0.0100 0.0256 0.0203 0.0174 0.0163 0.0176
264 50 0.0050 0.0093 0.0174 0.0231 0.0141 0.0084
265 50 0.0080 0.0321 0.0106 0.0202 0.0149 0.0182 0.0156
263 75 0.0067 0.0204 0.0139 0.0247 0.0168 0.0199 0.0158
269 75 0.0106 0.0140 0.0175 0.0225 0.0149 0.0189 0.0191
270 75 0.0063 0.0077 0.0217 0.0287 0.0112 0.0173 0.0142
273 90 0.0105 0.0102 0.0254 0.0075 0.0268 0.0118 0.0155
275 90 0.0080 0.0160 0.0121 0.0231 0.0130 0.0185 0.012
[image:11.595.33.558.281.360.2]276 90 0.0058 0.0170 0.0114 0.0237 0.0131 0.0156 0.011
Table 4
Average damping coefficients for each SOC threshold. SOC (%) First torsional
mode (average damping ratio) First bending mode (average damping ratio) Second bending mode (average damping ratio) Third bending mode (average damping ratio) Fourth bending mode (average damping ratio) Second torsional mode (average damping ratio) Third torsional mode (average damping ratio)
10 0.0095 0.0109 0.0178 0.0201 0.0151 0.0122 0.0101
25 0.0121 0.0172 0.0227 0.0184 0.0182 0.0171 0.0161
50 0.0067 0.0171 0.0179 0.0212 0.0155 0.0173 0.0139
75 0.0079 0.0140 0.0177 0.0253 0.0143 0.0187 0.0164
[image:11.595.330.526.399.470.2]90 0.0081 0.0144 0.0163 0.0181 0.0176 0.0153 0.0128
Table 5
Linear regression equations for the damping coefficient (y) vs. SOC (x). Mode Linear regression equation
[image:11.595.31.284.401.480.2]First Torsional Mode (Hz) y¼-4E-05xþ0.0107 First Bending Mode (Hz) y¼1E-05xþ0.014 Second Bending Mode (Hz) y¼-4E-05xþ0.0206 Third Bending Mode (Hz) y¼2E-05xþ0.0196 Fourth Bending Mode (Hz) y¼1E-06xþ0.0161 Second Torsional Mode (Hz) y¼4E-05xþ0.0142 Third Torsional Mode (Hz) y¼3E-05xþ0.0125
Table 6
Calculated cell stiffness.
Cell ID SOC (%)
Cell weight (g)
Stiffness constant (Nm1)
259 10 577 835358.90
267 10 577 866173.26
268 10 577 789429.70
260 25 577 890065.11
261 25 578 921891.24
266 25 576 917310.42
262 50 578 886985.30
264 50 578 847026.19
265 50 576 943331.59
263 75 578 929476.23
269 75 577 902073.04
270 75 578 926483.47
273 90 573 909375.21
275 90 576 960297.66
276 90 575 944686.95
Table 7
Averaged cell stiffness for each SOC threshold.
SOC (%)
Mean stiffness at cell weight (Nm1)
10 830320.62
25 909755.59
50 892447.69
75 919344.25
[image:11.595.32.283.520.675.2]Table 4presents the averaged values of
2
for each SOC threshold. MATLAB was further employed to generate a linear best-fit function defining the relationship between cell damping and SOC. The re-sults are presented inTable 5and highlight that, given the sample-size and cell technology tested, there does not appear to be a discernable relationship between the damping for each natural frequency and cell's SOC.5.3. Cell stiffness
[image:12.595.139.467.68.329.2] [image:12.595.140.466.367.620.2]Table 6presents the calculated stiffness (kc) for each cell based on the 1st natural frequency (measured between 191 and 205 Hz). Equation(7)was employed to calculatekc. For completeness, the measured value of cell mass (mc) was used in the calculations and is provided for reference. As discussed in Section5.1, variations in cell Fig. 10.Average cell stiffness vs. cell SOC.
mass were found to be in the order of 1 mm.Table 7presents the mean stiffness value corresponding to each SOC threshold.Fig. 10
presents a graphical representation of Table 7 and clearly in-dicates a trend of increasingkcfor higher values of SOC. This result contradicts that observed in Section 5.1that shows insensitivity between the cells natural frequency and SOC. For a simple me-chanical structure, in accordance with Equation (7), one would expect to see an increase in natural frequency as the stiffness of the specimen is increased (with mass held constant). At present, only the experimental data and observations are noted. Additional ex-periments and further modeling activity is ongoing within the University. The aim of these additional tests is to reaffirm the re-sults presented here and, if appropriate, to formulate a rationale for the observed behavior.
5.4. Implications for in-vehicle performance
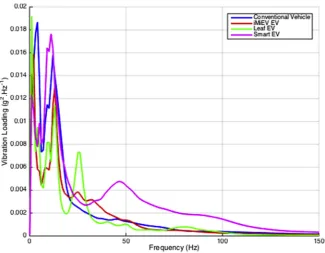
[image:13.595.302.554.488.737.2]The results presented highlight that thefirst natural frequency of the cells tested (irrespective of SOC) occurs at a frequency in excess of 180 Hz. A study presented in Ref.[19]that measured the vibration inputs to a series of commercially available EV battery installations found that the majority of road-induced vibration occurs within the frequency range of 0e150 Hz. This is illustrated in
Fig. 11that highlights the vibration energy measured in the z-axis within the Nissan Leaf, the Smart EV and the Mitsubishi i-MiEV that has been sequenced to a 100,000 miles of vehicle durability. Further information regarding the derivation ofFig. 11is available within
[19]and will therefore not be repeated here. Comparing the iso-lated cell data from Section5with the in-vehicle data published in Refs.[19,20]indicates that it is unlikely that these NMC pouch cells would be excited by road surface vibration. However, it is note-worthy thatFig. 11corresponds to the vibration energy measured on the surface of the battery pack and this may differ to that experienced within the battery enclosure. Additional higher fre-quency vibrations may be induced from the thermal management systems, the power electronics and the use of cell-level restraints
[19]. Further research to quantify the in-vehicle, cell-level vibration loading is the subject of on-going research within the University.
6. Further work
To reaffirm the results presented here it is necessary to do further tests. These tests will evaluate the same cell for different SOC values. This would highlight any possible relationship between SOC and natural frequency without the impact of cell-to-cell vari-ations introducing uncertainty to the results obtained. While this initial study focused on the SOC range of 10%e90%, a further study will characterize the cell at the extremes of operation that will be experienced within an EV, namely less than 10% SOC and greater then 90% SOC. Introducing temperature as another variable to the experimental set-up that could yield interesting results for the vehicle manufacturer or battery systems integrator. While this study has concluded that there is little evidence to suggest that SOC impacts the frequency response of an NMC 25 Ah laminate pouch cell, further investigation is required to identify if these results are transferable to other cell chemistries and form-factors currently being investigated by the automotive industry. As discussed in Section5.4, a further investigation should determine the cell-level vibration induced loading from the complete battery enclosure when excited from a road induced vibration and other ancillaries within the EV or HEV. For such a study, agrounded(rather than a freeefree) test method may be more appropriate since this will allow the evaluation of the cell within the correct orientation and restraint for the battery pack design under investigation.
7. Conclusions
The authors argue that if future EV and HEV battery systems are to be designed such that the impact of vibration induced resonance is minimized, engineers must have a rigorous understanding of key system attributes such as the natural frequencies of the cell, the level of damping present and the mode shapes induced under mechanical load. This paper has presented the underpinning theory and experimental method employed to ascertain the FRF and mode shapes for a range of commercially available 25 Ah NMC Laminate Pouch Cells. Each cell was pre-conditioned to a different value of SOC. The primary conclusions that can be drawn from the results presented arefirstly, irrespective of cell SOC, the same initial four modes (torsion, bending, bending and bending) are present in each cell and occur within a frequency range of 191 Hze360 Hz. Further, the results imply that the natural frequencies are not dependent on the cell's SOC and are most likely attributable to subtle cell-to-cell variations resulting from the manufacturing processes employed. Secondly, the approximated damping calculated for each natural frequency within each cell suggests that there is no discernable relationship between the value of damping present and cell's SOC. Finally, the lowest natural frequency recorded within the cells is above the frequency range (0e150 Hz) typically associated with road-induced vibration. As a result, it is unlikely that these NMC pouch cells will be excited by road surface vibration.
Acknowledgments
The research presented within this paper is supported by the Engineering and Physical Science Research Council (EPSRC - EP/ I01585X/1) through the Engineering Doctoral Centre in High Value, Low Environmental Impact Manufacturing. The research was un-dertaken in collaboration with the WMG Centre High Value Manufacturing Catapult (part-funded by Innovate UK) in collabo-ration with Jaguar Land Rover and TATA Motors. The authors would like to express their gratitude to Sound and Vibration Technology Ltd for their support and advice throughout the test program.
References
[1] S.-I. Moon, I.-J. Cho, D. Yoon, J. Mech. Sci. Technol. 25 (2011) 611e637. [2] H.Y. Choi, J.S. Lee, Y.M. Kim, H. Kim, in, Hongik University, Seoul, South Korea,
2013, pp. 1e10.
[3] P. Dallard, A.J. Fitzpatrick, A. Flint, S.L. Bourva, A. Low, R.M.R. Smith, M. Willford, Struct. Eng. 79 (2001) 17e33.
[4] I. Avdeev, M. Gilaki, J. Power Sources 271 (2014) 382e391. [5] X. Zhang, T. Wierzbicki, J. Power Sources 280 (2015) 47e56.
[6] L. Berla, S. Woo Lee, Y. Cui, W. Nix, J. Power Sources 273 (2015) 41e51. [7] L. Greve, C. Fehrenbach, J. Power Sources 214 (2012) 377e385.
[8] K.-Y. Oh, J. Siegel, L. Secondo, S.U. Kim, N. Samad, J. Qin, D. Anderson, K. Garikipati, A. Knobloch, B. Epureanu, C. Monroe, A. Stefanopoulou, J. Power Sources 267 (2014) 197e202.
[9] E. Sahraei, J. Meiera, T. Wierzbicki, J. Power Sources 247 (2014) 503e516. [10] X. Feng, J. Sun, M. Ouyang, F. Wang, X. He, L. Lu, H. Peng, J. Power Sources 275
(2015) 261e273.
[11] X. Liu, S. Stoliarov, M. Denlinger, A. Masias, K. Snyder, J. Power Sources 280 (2015) 516e525.
[12] N. Spinner, C. Field, M. Hammond, B. Williams, K. Myers, A. Lubrano, S. Rose-Pehrsson, S. Tuttle, J. Power Sources 279 (2015) 713e721.
[13] U. Nations, in, United Nations, 2002.
[14] ECE, Economic and Social Council ECE/TRANS/WP.29/2012/102, 2013, pp. 1e54.
[15] L. Florence, in, Underwriters Laboratory Inc., 2013, pp. 1e19. [16] U. Nations, in, United Nations, New York, 2011, pp. 62.
[17] U. Nations, in: 38.3 Lithium Metal and Lithium Ion Batteries, United Nations, 2008, pp. 43e51.
[18] K. Kleiner, D. Dixon, P. Jakes, J. Melke, M. Yavuz, C. Roth, K. Nikolowski, V. Liebau, H. Ehrenberg, J. Power Sources 273 (2015) 41e51.
[19] J. Hooper, J. Marco, J. power sources 245 (2014) 510e519.
[20] J. Hooper, J. Marco, in: HEVC 2013-4th Hybrid and Electric Vehicles Confer-ence, IET, England, London, 2013, pp. 1e6.
[22] A. Bilosova, in: Investments in Education Development, 2011, pp. 1e120. [23] B. Schwartz, M. Richardson, CSI Reliability Week, 1999, pp. 1e12.
[24] T. Harrison, in: Brüel&Kjær Sound&Vibration Measurement, 2003, pp. 1e84. Royston, Hertfordshire.
[25] P. Avitabile, Sound and Vibration, 2001, pp. 3e11.
[26] R. Bono, in: IMAC XXVI: Conference&Exposition on Structural Dynamicse
Technologies for Civil Structures, The Modal Shop,, 2011.
[27] https://www.endevco.com/download/TP312.pdf, in, Endevco, 2014, pp. 1e7. [28] http://zone.ni.com/reference/en-XX/help/372416F-01/svtconcepts/
svfreqresponse/, in, National Instruments Corporation, 2014.
[29] http://zone.ni.com/reference/en-XX/help/372416A-01/svtconcepts/use_freq_ ana_vis/, in, National Instruments Corporation, 2009.
![Fig. 2. Definition of mode shapes from multiple frequency response functions [30].](https://thumb-us.123doks.com/thumbv2/123dok_us/9505169.455934/6.595.311.563.85.155/fig-denition-mode-shapes-multiple-frequency-response-functions.webp)