Open Access
Research article
The extracellular Leucine-Rich Repeat superfamily; a comparative
survey and analysis of evolutionary relationships and expression
patterns
Jackie Dolan
†1, Karen Walshe
†1, Samantha Alsbury
2, Karsten Hokamp
1,
Sean O'Keeffe
1, Tatsuya Okafuji
1, Suzanne FC Miller
1, Guy Tear
2and
Kevin J Mitchell*
1Address: 1Smurfit Institute of Genetics, Trinity College Dublin, Dublin 2, Ireland and 2MRC Centre for Developmental Neurobiology, New Hunts House, Guys Campus, King's College London SE1 1UL, UK
Email: Jackie Dolan - [email protected]; Karen Walshe - [email protected]; Samantha Alsbury - [email protected]; Karsten Hokamp - [email protected]; Sean O'Keeffe - [email protected]; Tatsuya Okafuji - [email protected]; Suzanne FC Miller - [email protected]; Guy Tear - [email protected]; Kevin J Mitchell* - [email protected] * Corresponding author †Equal contributors
Abstract
Background: Leucine-rich repeats (LRRs) are highly versatile and evolvable protein-ligand interaction motifs found in a large number of proteins with diverse functions, including innate immunity and nervous system development. Here we catalogue all of the extracellular LRR (eLRR) proteins in worms, flies, mice and humans. We use convergent evidence from several transmembrane-prediction and motif-detection programs, including a customised algorithm, LRRscan, to identify eLRR proteins, and a hierarchical clustering method based on TribeMCL to establish their evolutionary relationships.
Results: This yields a total of 369 proteins (29 in worm, 66 in fly, 135 in mouse and 139 in human), many of them of unknown function. We group eLRR proteins into several classes: those with only LRRs, those that cluster with Toll-like receptors (Tlrs), those with immunoglobulin or fibronectin-type 3 (FN3) domains and those with some other domain. These groups show differential patterns of expansion and diversification across species. Our analyses reveal several clusters of novel genes, including two Elfn genes, encoding transmembrane proteins with eLRRs and an FN3 domain, and six genes encoding transmembrane proteins with eLRRs only (the Elron cluster). Many of these are expressed in discrete patterns in the developing mouse brain, notably in the thalamus and cortex. We have also identified a number of novel fly eLRR proteins with discrete expression in the embryonic nervous system.
Conclusion: This study provides the necessary foundation for a systematic analysis of the functions of this class of genes, which are likely to include prominently innate immunity, inflammation and neural development, especially the specification of neuronal connectivity.
Published: 14 September 2007
BMC Genomics 2007, 8:320 doi:10.1186/1471-2164-8-320
Received: 15 March 2007 Accepted: 14 September 2007
This article is available from: http://www.biomedcentral.com/1471-2164/8/320
© 2007 Dolan et al; licensee BioMed Central Ltd.
Background
Leucine-rich repeats (LRRs) are protein-ligand interaction motifs found in a large number of proteins of diverse structure, localization and function in bacteria, fungi, plants and animals [1]. Many of these have well-known functions in the innate immune system [2]. Many others, especially those with extracellular LRRs (eLRRs), are involved in various aspects of nervous system develop-ment [3]. In both cases, the nature of the LRR motifs is important for generating a diversity of interactions, with exogenous factors in the immune system and with the huge number of different cell types in the developing nervous system. The structure of LRR motifs and their arrangement in repetitive stretches of variable length gen-erate a versatile and highly evolvable framework for the binding of diverse proteins and non-protein ligands.
Seven classes of LRR have been defined [1]; (these have been referred to as LRR "subfamilies" [4]; we use the term subfamily here in the phylogenetic sense to refer to sets of closely-related genes). Within animals, four separate types are recognised, three typically intracellular and one extra-cellular. Whether all these different classes are evolution-arily related by descent or represent convergent evolution is open to debate [1] but they all share a characteristic structure. Each repeat is typically 19–29 amino acids long and has a well-conserved N-terminal stretch of 9–12 amino acids that is characterized by precisely-positioned hydrophobic residues (usually leucines) and that forms a β-strand and a C-terminal stretch of 10–19 amino acids that is more variable in length, sequence and structure. The arrangement of multiple repeats in tandem generates a horseshoe-shaped solenoidal structure, with the β -strands stacking to form the concave surface and the vari-able stretches forming the convex surface [1,5-7]. Most LRR regions typically also have both N-terminal and C-terminal cap regions, which shield the hydrophobic core of the LRR structure. In extracellular proteins these regions (LRR-NT and LRR-CT domains, of which several subtypes exist) are defined by precisely positioned cysteine residues [4].
LRR proteins, both intracellular and extracellular, have well-characterized functions in the innate immune system that are similar from plants to mammals [2]. The extracel-lular LRR (eLRR) proteins in animals include the Toll-like receptors (TLRs), a family of transmembrane proteins characterized by an LRR region, a transmembrane (TM) domain and a cytoplasmic Toll/IL-1 receptor (TIR) domain. This family has expanded in vertebrates to allow detection of a diverse set of antigens [8]. In flies, the TLR family has also expanded, where, in addition to roles in immunity for some of these proteins [9], many are required for various aspects of embryonic and nervous system development [10-13]. Tol-1 in worms is also
important in development, possibly contributing to a code of molecules defining neuronal connectivity [14,15]. Recent reports indicate that some mammalian TLR genes may also be expressed and function in neurons [16,17].
A large number of other eLRR proteins have been impli-cated in various aspects of neural development, geneti-cally in flies [18-20] and in mammals in assays of neurite outgrowth, [21-24], fasciculation [25] and/or synapse for-mation [26,27]. Some of these contain, in addition to the extracellular LRR domain, immunoglobulin (Ig) or fibronectin type-3 (FN3) domains (for review see [3]). In some cases, the functions of eLRR proteins are mediated by homophilic interactions [25,28-30]. In other cases they are mediated by the binding of other proteins in cis [31-33] and in trans [27,34-36]. Several eLRR proteins have been found to modulate the signaling of various growth factor pathways (e.g., [37-41]).
Surprisingly, apart from the TLR genes [42] and small secreted proteoglycans [43], relatively few eLRR genes have been studied genetically in mice. Among the ones that have, examples of phenotypic effects in the nervous system include increased plasticity, sprouting and nerve regeneration [44], and defects in axon guidance and cell migration [45], learning and memory [46], myelination [47,48] and neuronal survival [35].
The importance of this class of proteins for nervous sys-tem development in humans is apparent from the large number of examples implicated in neurological or psychi-atric disorders (reviewed in [49]). These include epilepsy [50], Tourette's syndrome [51], night blindness [52], con-genital insensitivity to pain (with mental retardation) [53], and possible links to Alzheimer's disease [54].
Despite the growing number of eLRR proteins implicated in nervous system development or disease this family of proteins has received far less attention as a class than other better characterized families like the immunoglobulin [55,56] and cadherin [57] superfamilies. In particular, there have been no systematic surveys of the genomic complement of these proteins or investigation of their evolutionary relationships. We therefore set out to cata-logue the entire extracellular leucine-rich repeat proteome of four organisms: Caenorhabditis elegans, Drosophila
mela-nogaster, Mus musculus and Homo sapiens. We used a
Results
Bioinformatics strategy
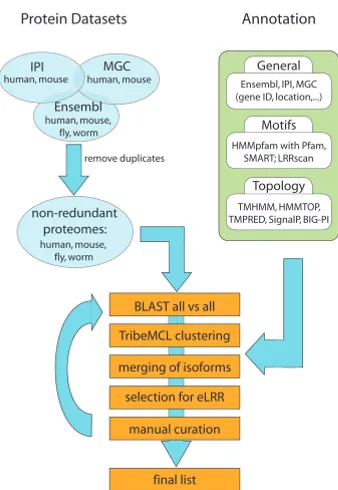
We began by obtaining whole proteome sets of known and predicted proteins from each of the four species, as described in Methods. Our initial approach was to filter the starting proteome datasets using transmembrane (TM) and signal peptide prediction programs (TMHMM [58] and SignalP [59]) to identify transmembrane or secreted proteins and then to filter that set using a motif recognition program (Pfam [60]) to identify the subset with motifs of interest. However, this approach using serial filters missed a number of known axon guidance molecules because TMHMM or SignalP misclassified them or Pfam did not detect specific motifs. We therefore included a number of other TM-prediction and motif-rec-ognition programs, including a customised program to look for LRR domains (LRRscan, see below) in the pipe-line. In addition, we first performed a clustering step using TribeMCL [61] on the entire proteome sets so as to iden-tify related proteins even where these programs failed to detect specific motifs or architectures. Rather than using any of these programs or a combination of them as strict filters we generated a database containing all the results that could be browsed or searched using various criteria to extract particular gene families of interest (Figure 1).
Clustering
TribeMCL is a program designed to cluster proteins into related families based on simultaneous examination of all pairwise BLAST similarity scores [61]. This program uses a Markov cluster algorithm that is particularly well suited to cluster highly divergent proteins with repeated domains into separate subfamilies, a task for which multiple align-ment programs are not appropriate. The Markov cluster algorithm is based on simulated 'flow' through a network or graph, where each node is a gene and each connection is weighted by the symmetric pairwise BLAST score. A ran-dom walk of a certain length from node to node through this network, which begins within a small cluster of inter-connected genes will have a higher probability of ending up within that cluster than crossing to a gene that is only related to one of them. The results of many simulated ran-dom walks thus define the clusters. Each time this process is reiterated the links within the clusters that emerge are given a higher weighting and the links that were not used are downgraded. Multiple rounds of this process eventu-ally lead to completely separate clusters. There are two parameters that can be varied that affect the clustering; the first is the e-value cutoff of the BLAST scores that are used, which determines the initial set of connections consid-ered. The second is the inflation parameter; this deter-mines how strongly the links are upgraded with each iteration. A higher inflation parameter increases the 'gran-ularity' of the output; i.e., it generates a larger number of smaller clusters. We used a number of e-value cutoffs (from e-10 to e-40) and inflation parameters (1.2, 2, 3, 4
and 5) and compared the output produced.
The output from TribeMCL, for any given e-value cutoff and inflation parameter can be viewed as a list of genes organized into clusters with a number assigned to each cluster (lower numbers have more members). We rea-soned that hierarchical sorting of genes across various inflation parameters should yield a tree-like structure, with larger clusters at low inflation parameters splitting into more discrete clusters at higher inflation parameters. At each e-value cutoff we therefore sorted the list of genes first at inflation parameter 1.2, then 2, then 3, 4 and 5. For the most part, increasing inflation parameter does lead to splitting of large clusters into smaller clusters and yields a tree-like arrangement of genes with relationships appar-ent across various levels (but see discussion on "LRR_Tollkin" group below).
Identification of LRR motifs
To identify LRR proteins, the database was searched for all genes containing at least one LRR, LRR-NT or LRR-CT pre-dicted by either SMART or Pfam. The cutoff values used were based on analysis of the results for proteins with known architecture (see Methods for details). This analy-sis yielded a total of 2,698 entries. These include both
[image:3.612.97.266.425.670.2]Bioinformatics pipeline
Figure 1
Bioinformatics pipeline. Figure shows starting datasets (blue), annotation programs (green) and clustering pipeline (orange) used to generate final eLRR dataset.
Protein Datasets Annotation
human, mouse human, mouse
human, mouse, fly, worm IPI MGC
Ensembl
General Ensembl, IPI, MGC (gene ID, location,...)
Motifs
Topology HMMpfam with Pfam,
SMART; LRRscan
TMHMM, HMMTOP, TMPRED, SignalP, BIG-PI non-redundant
proteomes: human, mouse, fly, worm
BLAST all vs all
TribeMCL clustering
merging of isoforms
selection for eLRR
manual curation
genes with intracellular LRRs and those with extracellular LRRs. It also contains isoforms for many genes. To screen out false positives we used the following criteria: if only one LRR was predicted in a gene and only by one of the programs and it was not predicted in either the mouse or human orthologue (for mammalian genes), or in other members of a closely-related cluster then it was consid-ered a false positive and discarded.
Identification of extracellular LRR proteins
Comparison of several TM-prediction programs suggests that TMHMM is the most reliable, although it is also the most selective [62]. A quick survey of some known TM receptors revealed that TMHMM failed to identify TM domains in several of them, including Robo2 in mam-mals and Kekkon2 and 3 in flies, for example. For that rea-son we also used two other programs, HMMTOP [63] and TMPred [64] to search for TM domains. At least one of these three programs successfully detected the TM domain in all the known TM receptors examined (while also increasing the number of false positives).
SignalP [59] was used to detect signal peptides. This suf-fered from poor prediction of 5' exons for many mamma-lian genes, which was solved by manual curation (see below). The GPI-prediction program BIG-PI [65] identi-fied a small number of GPI-linked proteins, including all the known GPI-linked proteins such as Connectin, NgRs and Nyx (the latter in human but not mouse, as reported [66]). A number of other genes were tentatively assigned to the GPI-class by manual inspection based on the pres-ence of a characteristic short C-terminal hydrophobic stretch (and a signal peptide).
In addition to examining the convergent evidence from these various programs to identify eLRR proteins we used three additional criteria. The first is the type of LRR pre-dicted: extracellular proteins typically contain LRR types designated LRR_1, 2 or 3 by Pfam or LRR_typical by SMART, while the intracellular proteins have LRR_RI or LRR_sd22 (see [1]). Second, the prediction of an LRR-NT and/or LRR-CT domain was taken as evidence for extracel-lular localization. Third, especially at low e-value strin-gencies (e-10), the majority of extracellular LRR proteins
cluster together with TribeMCL in one large group (and a few small ones), distinct from the intracellular proteins. Using these criteria in addition to the data from the pre-diction programs described above we collected what we believe is a comprehensive set of extracellular LRR pro-teins across worm, fly, mouse and human. We call these the eLRR proteome.
Manual curation of extracellular sequences
To reduce the complexity of the final data set a single pro-tein isoform was chosen for each gene and all others were
removed (see Methods). Many peptides that we expected to be extracellular because of orthology, clustering or domain structure did not have a predicted signal peptide. Upon manual inspection of the sequences it was discov-ered that many gene predictions in Ensembl, especially for mammalian genes, were missing the 5'-most exon encod-ing the signal peptide. For many such genes we identified the 5' exon and the full coding sequence in a sequence from another database and/or by searching with an orthologous gene from mouse or human. In other cases the 5' predicted sequence extended past the apparent true methionine start codon, which could be recognised by conservation and the presence of the signal sequence.
We identified two fly genes that have been incorrectly annotated in Ensembl as two separate genes each. CG32637 and CG4187 represent the 5' and 3' ends of a cDNA encoded by AB134171, a new member of the Lgr3 family. Similarly, CG4054 and CG13487 represent the 5' and 3' ends of the fish-lips (fili) gene, encoded by AAV36870 [67] which is related to tartan and capricious [67,68]. We detected one similar mis-annotation in the worm database (pxn-1) and presume that this type of error may also have occurred for some mammalian sequences.
All the manually curated gene sequences are provided [see Additional File 1]. These curated sequences were fed back into the starting database and the BLAST and clustering analyses were re-performed to ensure that spurious results had not been generated by incorrect sequences.
Defining consensus architectures
In order to derive a consensus architecture for each gene we compared the results of SMART and Pfam and the TM-prediction programs. Even at very low stringency some LRRs in proteins with known numbers of such repeats were missed by HMMpfam using the SMART and Pfam databases. This includes a number of somewhat degener-ate LRRs in Lrrc8 proteins [69], for example, as well as atypical LRR-CT domains in small proteoglycans and G-protein-coupled receptors [4]. For this reason, using a similar strategy to Smits and colleagues [69], we wrote a customised program, LRRscan, to search for a more inclu-sive minimal consensus that defines LRRs as well as searching for consensus sequences derived from non-canonical LRR-CT domains (see Methods for details). LRRscan was successful in identifying all the predicted LRRs in Lrrc8 proteins, including atypical or degenerate ones [69], and additional LRRs in many other proteins that were not detected by HMMpfam with SMART or Pfam.
architecture including number of LRRs and presence of LRR-NT and LRR-CT domains was derived by manual curation. The consensus matches the architecture of a number of eLRR proteins with published structures [5-7,70-72], allowing for semantic differences in how the LRRs are counted. The final LRR before the LRR-CT domain (CT1 subtype) often contains only the first sub-domain of nine residues; following the convention of Matsushima and colleagues [49] we count this as one repeat rather than part of the LRR-CT domain, which in some cases may cause an apparent discrepancy with pub-lished reports. We also do not count in the total number of repeats putative LRRs which overlap with LRR-NT or LRR-CT domains, as has been done in some published cases [73,74].
A consensus topology for each protein was also derived by comparison of the signal peptide, GPI anchor and TM-prediction programs. A full list of all the eLRR proteins is provided [see Additional File 3] and a sample is shown in Figure 2. These are sorted hierarchically across inflation parameters at an e-value cutoff of -40. Clustering results at e-10 and e-25 are also presented [see Additional Files 4 and 5]. Figures 3 and 4 provide an overview of the consen-sus protein architectures of most of the eLRR proteins, arranged in subfamilies. A large number of singleton LRR_Only proteins are not shown in this diagram (these are listed separately in Table 1).
The eLRR superfamily
We categorized the eLRR proteins into four classes, based on their architecture and clustering. These are LRR_Ig/Fn3 (containing an Ig or FN3 domain but no other extracellu-lar domains except LRRs), LRR_Tollkin (containing a cytoplasmic TIR domain or clustering with the Toll pro-teins), LRR_Other (containing some other domain, such as EGF repeats or a G-protein-coupled receptor domain) and LRR_Only (containing no other recognizable domain). These categories are broadly supported by the clustering results, although the LRR_Other group is clearly arbitrary and contains a number of unrelated subfamilies. The number of eLRR proteins in each of these classes in each of the four organisms studied is shown in Table 2. These are broken down into several categories, based on predicted localization: secreted, GPI-linked, type I trans-membrane and trans-membrane spanning (all multi-membrane spanning proteins were classified into the LRR_Other group). Almost all of the LRR_Ig/FN3 group are associated with the plasma membrane, either as type I TM or GPI-linked proteins. In contrast, the LRR_Tollkin and LRR_Only groups contain a far higher percentage of secreted proteins. It is clear from an examination of these data that the eLRR superfamily has greatly expanded in mammals (>135 genes) and to a lesser extent, flies (66), compared to worms (29).
Subfamily expansion and diversification
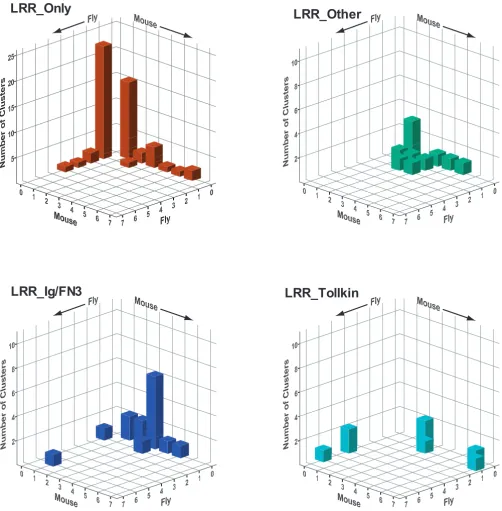
In order to assess the extent of expansion (new members of existing subfamilies) and diversification (new sub-families) across different organisms, we analysed the membership of clusters across mouse and fly. For this pur-pose, we defined clusters in such a way as to distinguish those with species-specific expansion from those with diversification [see Additional File 6]. For each cluster we counted the number of fly and mouse members and then generated histograms of the number of clusters with x fly members and y mouse members (Figure 5). For example, in the LRR_Ig/FN3 group there is one cluster with one fly gene and three mouse genes (Lrigs) and there are six clus-ters with no fly genes and three mouse genes (Ntrk, Lrrn1– 3, Lrrc4, Amigo, FLRT and Lrrc21 groups). These graphs illustrate the different rates of expansion and diversifica-tion across these groups.
For the LRR_Ig-FN3 family there is a large number of clus-ters that have multiple mouse genes and no fly genes. These represent the diversification of new architectures and gene families in the mammalian lineage. There is only one case of expansion in the mouse within a conserved subfamily (the Lrig family which has three members in mouse and one, lambik, in fly (as well as one in worm)). Conversely, the kekkon family shows a specific expansion in flies compared to mammals, where there is only a sin-gle apparent closest orthologue, Lrrc24.
In contrast, in the LRR_Tollkin group there has been inde-pendent expansion of subfamilies in both flies and mam-mals (and even comparing mouse and human). Similar expansions are observed in the subfamilies of Toll-like receptor genes themselves and in the subfamilies of gene encoding proteins that do not have TIR domains but that cluster within this group (see below).
In the LRR_Only group there has also been independent expansion, apparently followed by rapid divergence, resulting in a very large number of singletons in each spe-cies. These are genes with no recognizable orthologue in the other species (fly or mouse) and no recognizable par-alogue in their own species. The encoded proteins do not cluster at high stringency (e-value and inflation parame-ter) but many cluster into a very large group at lower strin-gency. This trend may reflect increased divergence rates of this class of proteins. There is only one case in this group of apparent orthology, between CG6959 in fly and Tpbg/ 5T4 [75] and a novel gene in mouse.
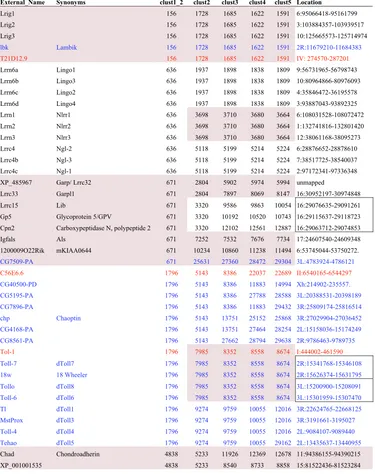
Sample from list of all eLRR genes, hierarchically clustered at e-40 cutoff Figure 2
Sample from list of all eLRR genes, hierarchically clustered at e-40 cutoff. Proteins have been sorted in this table based on the clustering output from TribeMCL. This has been done hierarchically across inflation parameters, starting at 1.2, then 2, 3, 4 and 5. For most proteins this yields a tree-like structure with cluster stringency increasing (and membership decreasing) from low inflation parameters to high. Numbers used to identify clusters are generated by TribeMCL with larger clusters having lower numbers. Proteins are colour-coded by species: black, mammalian; blue, fly; red, worm. For the mamma-lian proteins, only the mouse orthologue is listed. The table shows examples of clusters in the LRR_Ig/FN3 group with mouse, fly and worm orthologues (the Lrig subfamily) and with mouse paralogues only (the Lrrn6, Lrrn1–3 and Lrrc4 subfamilies, which cluster together at level 1.2). It also shows many of the proteins in the LRR_Tollkin group, with the hierarchical cluster-ing apparent across inflation parameters and indicated by shadcluster-ing. One subfamily containcluster-ing a known and novel member is shown at the bottom. Proteins encoded by genes located in tandem in the genome are boxed in the right-hand column. A com-plete list of all eLRR proteins is provided [see Additional File 3]. Lists clustered at the e-25 and e-10 cutoff levels are given [see
Additional Files 4 and 5].
External_Name Synonyms clust1_2 clust2 clust3 clust4 clust5 Location
Lrig1 156 1728 1685 1622 1591 6:95066418-95161799 Lrig2 156 1728 1685 1622 1591 3:103884357-103939517 Lrig3 156 1728 1685 1622 1591 10:125665573-125714974
lbk Lambik 156 1728 1685 1622 1591 2R:11679210-11684383
T21D12.9 156 1728 1685 1622 1591 IV: 274570-287201
Lrrn6a Lingo1 636 1937 1898 1838 1809 9:56731965-56798743 Lrrn6b Lingo3 636 1937 1898 1838 1809 10:80964866-80976093 Lrrn6c Lingo2 636 1937 1898 1838 1809 4:35846472-36195578 Lrrn6d Lingo4 636 1937 1898 1838 1809 3:93887043-93892325 Lrrn1 Nlrr1 636 3698 3710 3680 3664 6:108031528-108072472 Lrrn2 Nlrr2 636 3698 3710 3680 3664 1:132741816-132801420 Lrrn3 Nlrr3 636 3698 3710 3680 3664 12:38061168-38095273 Lrrc4 Ngl-2 636 5118 5199 5214 5224 6:28876652-28878610 Lrrc4b Ngl-3 636 5118 5199 5214 5224 7:38517725-38540037 Lrrc4c Ngl-1 636 5118 5199 5214 5224 2:97172341-97336348 XP_485967 Garp/ Lrrc32 671 2804 5902 5974 5994 unmapped
Lrrc33 Garpl1 671 2804 7897 8069 8147 16:30952197-30974848 Lrrc15 Lib 671 3320 9586 9863 10054 16:29076635-29091261 Gp5 Glycoprotein 5/GPV 671 3320 10192 10520 10743 16:29115637-29118723 Cpn2 Carboxypeptidase N, polypeptide 2 671 3320 12102 12561 12887 16:29063712-29074853 Igfals Als 671 7252 7532 7676 7734 17:24607540-24609348 1200009O22Rik mKIAA0644 671 10234 10860 11238 11494 6:53745044-53750272.
CG7509-PA 671 25631 27360 28472 29304 3L:4783924-4786121
C56E6.6 1796 5143 8386 22037 22689 II:6540165-6544297
CG40500-PD 1796 5143 8386 11883 14994 Xh:214902-235557. CG5195-PA 1796 5143 8386 27788 28588 3L:20388531-20398189 CG7896-PA 1796 5143 8386 11883 29432 3R:25809174-25816514 chp Chaoptin 1796 5143 13751 25152 25868 3R:27029904-27036452 CG4168-PA 1796 5143 13751 27464 28254 2L:15158036-15174249 CG8561-PA 1796 5143 27662 28794 29638 2R:9786463-9789735
Tol-1 1796 7985 8352 8558 8674 I:444002-461590
Toll-7 dToll7 1796 7985 8352 8558 8674 2R:15341768-15346108 18w 18 Wheeler 1796 7985 8352 8558 8674 2R:15626374-15631795 Tollo dToll8 1796 7985 8352 8558 8674 3L:15200900-15208091 Toll-6 dToll6 1796 7985 8352 8558 8674 3L:15301959-15307470 Tl dToll1 1796 9274 9759 10055 12016 3R:22624765-22668125 MstProx dToll3 1796 9274 9759 10055 12016 3R:3191661-3195027 Toll-4 dToll4 1796 9274 9759 10055 12016 2L:9084107-9089440 Tehao dToll5 1796 9274 9759 10055 29162 2L:13435637-13440955
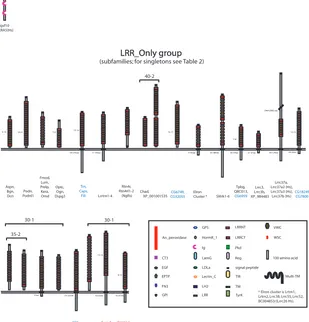
eLRR protein predicted architectures (part 1)
Figure 3
eLRR protein predicted architectures (part 1). Consensus architectures are shown for all proteins in the LRR_Ig/FN3 group and for all proteins in subfamilies in the LRR_Only group. An additional set of LRR_Only singletons is listed separately in Table 1. Protein names are shown below the corresponding structures (black, mammalian; blue, fly; red, worm). All figures are drawn to scale (see Key). Consensus architectures were derived for single proteins and across subfamilies from convergent evidence from motif and topology prediction programmes. Where there is a range in number of predicted LRRs or other domains across members of a subfamily, this is indicated next to the domain. A range in length of the cytoplasmic domain is similarly indicated, where it exceeds 20 amino acids. Tightly clustered subfamilies (e.g., Slits, Amigos) are listed under a single consensus architecture. Clusters with more structurally diverse proteins are indicated by the brackets; the numbers refer to e-value and inflation parameter at which the proteins cluster in the MCL programme. See Key for more information.
32-35aa 11-12 388-401aa 92-97aa 89-255aa 100-103aa Amigo1-3 255aa 223-558aa 87-90aa 132aa 20-290aa 16-17 92-113aa 36-42aa 66-80aa 12-13 Lrfn1-5 (Salm1-5) Lrrc21 (Pal), Lrrc22 XP_143529.5 64-76aa 5-6 Elfn1-2 B43Rik Ntrk 1-3 Lrrn 1-3
Lrrn6a-d (Lingo1-4) Lrig1-3 Lbk T21D12.9 Lrrc4, 4b,4c 349-375aa 3-4 Islr,
Islr2 Lrrc24 Kek 1-6CG16974 Flrt1-3 F20D1.7Y37E3.13
LRR_Ig/FN3 group LRR_Ig/FN3 group Igsf10 MXRA5(Hs) ZC262.3 459aa 51aa 25-1 25-1 25-1 40-1 Lrrtm1-4 Rtn4r, Rtn4rl1-2 (NgRs) 71-145aa Chad, XP_001001535 9-10 Aspn, Bgn, Dcn Podn, Podnl1 Fmod, Lum, Prelp, Kera, Omd Optc, Ogn, Dspg3 Tpbg, Q8C013, CG6959 7-8 Lrrc3, Lrrc3b, XP_984483 Lrrc37a, Lrrc37a2 (Hs), Lrrc37a3 (Hs), Lrrc37b (Hs) Elron Cluster * 17-42aa 64-276aa CG6749, CG32055 Slitrk1-6 53-306aa LRR_Only group LRR_Only group
(subfamilies; for singletons see Table 2)
(944-2965 aa) 18-21 5-6 35-54aa 16-17 Trn, Caps, Fili 21-37aa 18-124aa
CG10824 CG11910
43aa
CG4950 CG5810 35-2 73-225aa PFE, T01G9.3 15-16 Sym-1 Sym-5, K07A12.2 9-14 ZK682.5, C44H4.1 62-67aa 62-83aa 30-1 30-1 13-15 34-42aa CG18249, CG7800 signal peptide LRRNT LRR LRRCT Ig FN3 EGF LDLa TM TIR TyrK GPI LamG Pkd VWC An_peroxidase CT3 EPTP Multi-TM HormR_1 WSC Lectin_C Reg GPS LH2
100 amino acid
25-2
40-2
* Elron cluster is Lrtm1, Lrtm2, Lrrc38, Lrrc55, Lrrc52, BC004853/(Lrrc26 Hs).
2-3
eLRR protein predicted architectures (part 2)
Figure 4
eLRR protein predicted architectures (part 2). Consensus architectures are shown for all proteins in the LRR_Tollkin and LRR_Other groups. See Figure 3 legend for details.
15-19
Tlr 1,2,6, 10 (Hs)
Toll-9
Tlr 11,12 Tlr 3, 5,
7,8,9, 13
Tlr4 Cpn2 KIAA0644
LRR_Tollkin group
LRR_Tollkin group
CD180 CG7509
pan-1
18-19
Igfals Gp5
Lrrc15
10-11 21-27 23-24 20-21
3-5
17-18
Lrrc8a-e Lgr4-6
Tshr, Lhcgr,
Fshr,
Fsh,
fshr-1
Lgr 7, 8
Lgr 3, ABI34171
7-9
Pxdn,
Pxn,
pxn-1,
pxn-2 rk
10-12
Ecm2 Lgi1-4
4-5
SlitL2 (VASN)
Gpr124, Gpr125,
CG15744
263-704aa 107-150aa
Pkd1
LRR_Other Group
LRR_Other Group
(1329aa) 18-20
25-2
25-1 40-1
40-2 25-4
40-1 18W,
Toll7, Tollo Toll-6, Tol-1
TO5A1.3
4-5 24-26
200-437aa
Tehao
MstProx Tl
Toll-4 40-4
40-1
Slit 1-3,
Sli,
F40E10.4
CG40500
CG7896 CG4168
chp CG5195
CG8561
Lrrc32 Lrrc 33 C56E6.6
40-2
9-10
2-6
2-3
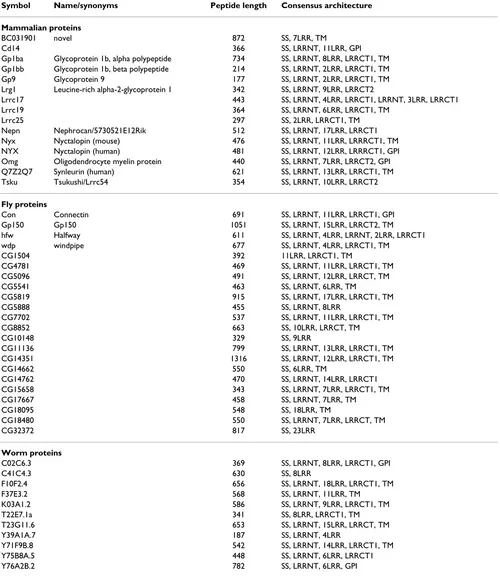
Table 1: List of LRR_Only singletons
Symbol Name/synonyms Peptide length Consensus architecture
Mammalian proteins
BC031901 novel 872 SS, 7LRR, TM
Cd14 366 SS, LRRNT, 11LRR, GPI
Gp1ba Glycoprotein 1b, alpha polypeptide 734 SS, LRRNT, 8LRR, LRRCT1, TM Gp1bb Glycoprotein 1b, beta polypeptide 214 SS, LRRNT, 2LRR, LRRCT1, TM Gp9 Glycoprotein 9 177 SS, LRRNT, 2LRR, LRRCT1, TM Lrg1 Leucine-rich alpha-2-glycoprotein 1 342 SS, LRRNT, 9LRR, LRRCT2
Lrrc17 443 SS, LRRNT, 4LRR, LRRCT1, LRRNT, 3LRR, LRRCT1 Lrrc19 364 SS, LRRNT, 6LRR, LRRCT1, TM
Lrrc25 297 SS, 2LRR, LRRCT1, TM
Nepn Nephrocan/5730521E12Rik 512 SS, LRRNT, 17LRR, LRRCT1 Nyx Nyctalopin (mouse) 476 SS, LRRNT, 11LRR, LRRRCT1, TM NYX Nyctalopin (human) 481 SS, LRRNT, 12LRR, LRRRCT1, GPI Omg Oligodendrocyte myelin protein 440 SS, LRRNT, 7LRR, LRRCT2, GPI Q7Z2Q7 Synleurin (human) 621 SS, LRRNT, 13LRR, LRRCT1, TM Tsku Tsukushi/Lrrc54 354 SS, LRRNT, 10LRR, LRRCT2
Fly proteins
Con Connectin 691 SS, LRRNT, 11LRR, LRRCT1, GPI Gp150 Gp150 1051 SS, LRRNT, 15LRR, LRRCT2, TM hfw Halfway 611 SS, LRRNT, 4LRR, LRRNT, 2LRR, LRRCT1 wdp windpipe 677 SS, LRRNT, 4LRR, LRRCT1, TM
CG1504 392 11LRR, LRRCT1, TM
CG4781 469 SS, LRRNT, 11LRR, LRRCT1, TM CG5096 491 SS, LRRNT, 12LRR, LRRCT, TM
CG5541 463 SS, LRRNT, 6LRR, TM
CG5819 915 SS, LRRNT, 17LRR, LRRCT1, TM
CG5888 455 SS, LRRNT, 8LRR
CG7702 537 SS, LRRNT, 11LRR, LRRCT1, TM
CG8852 663 SS, 10LRR, LRRCT, TM
CG10148 329 SS, 9LRR
CG11136 799 SS, LRRNT, 13LRR, LRRCT1, TM CG14351 1316 SS, LRRNT, 12LRR, LRRCT1, TM
CG14662 550 SS, 6LRR, TM
CG14762 470 SS, LRRNT, 14LRR, LRRCT1 CG15658 343 SS, LRRNT, 7LRR, LRRCT1, TM
CG17667 458 SS, LRRNT, 7LRR, TM
CG18095 548 SS, 18LRR, TM
CG18480 550 SS, LRRNT, 7LRR, LRRCT, TM
CG32372 817 SS, 23LRR
Worm proteins
C02C6.3 369 SS, LRRNT, 8LRR, LRRCT1, GPI
C41C4.3 630 SS, 8LRR
F10F2.4 656 SS, LRRNT, 18LRR, LRRCT1, TM F37E3.2 568 SS, LRRNT, 11LRR, TM K03A1.2 586 SS, LRRNT, 9LRR, LRRCT1, TM T22E7.1a 341 SS, 8LRR, LRRCT1, TM T23G11.6 653 SS, LRRNT, 15LRR, LRRCT, TM
Y39A1A.7 187 SS, LRRNT, 4LRR
Y71F9B.8 542 SS, LRRNT, 14LRR, LRRCT1, TM Y75B8A.5 448 SS, LRRNT, 6LRR, LRRCT1 Y76A2B.2 782 SS, LRRNT, 6LRR, GPI
List of singleton proteins in LRR_Only group not shown in Figure 3. For the mammalian proteins, only the mouse orthologue is listed, with the following exceptions: both human and mouse Nyctalopin (Nyx) are listed as they have different topologies (GPI-linked and TM, respectively) and
include the Slit proteins, peroxidasins, and a number of G-protein coupled hormone receptors, which are all con-served, as well as a number of mammal-specific families including the Lgi proteins.
Clustering of known proteins
These analyses provide an overview of relationships within the eLRR superfamily and highlight a number of previously unreported associations, allowing us to classify several novel proteins as paralogues of Lrrc21/Pal, Tpbg/ 5T4, Lrrc3 or Chad, for example. Conversely, it is clear that the recently named NLRR4 is not in fact a paralogue of the other NLRR proteins (-1, 2 and 3; also confusingly known as Lrrn1, 2 and 3). Also, the Lrig proteins in mam-mals are orthologous not to kekkon proteins in the fly, as has been suggested previously [76], but to the lambik pro-tein in flies (and T21D12.9 in worms). The mammalian protein Lrrc24 appears to be the closest orthologue of the kekkon proteins.
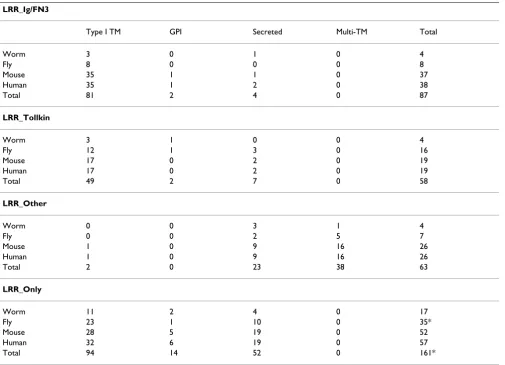
[image:10.612.56.561.99.464.2]A particularly interesting finding is of a number of LRR proteins which cluster with the Toll-like receptors in both flies and mammals but which do not have a characteristic TIR domain. One of these: CD180, also known as RP105, clusters specifically with Tlr4. This protein lacks a TIR domain and has recently been found to act as a negative regulator of Tlr4 [77]. Also in the LRR_Tollkin group in mammals is a subgroup of more distantly related pro-teins: carboxypeptidase N subunit 2 (Cpn2), glycoprotein V (Gp5) and leucine-rich repeat-containing protein 15 (Lrrc15, also known as Lib), (which form a sub-cluster), as well as insulin-growth factor acid labile subunit (Igfals) and KIAA0644 (which also has an FN3 domain). Lrrc32 (also known as GARP [78]) and the related protein Lrrc33 also fall into this cluster, along with the novel fly protein CG7509. In the fly there is also another subcluster that clusters with the Tlrs. This subcluster includes chaoptin, which is known to function as an adhesion molecule in neural development [18] and several other novel proteins, Table 2: Complement of eLRR proteins by group, localisation and species
LRR_Ig/FN3
Type I TM GPI Secreted Multi-TM Total
Worm 3 0 1 0 4
Fly 8 0 0 0 8
Mouse 35 1 1 0 37
Human 35 1 2 0 38
Total 81 2 4 0 87
LRR_Tollkin
Worm 3 1 0 0 4
Fly 12 1 3 0 16
Mouse 17 0 2 0 19
Human 17 0 2 0 19
Total 49 2 7 0 58
LRR_Other
Worm 0 0 3 1 4
Fly 0 0 2 5 7
Mouse 1 0 9 16 26
Human 1 0 9 16 26
Total 2 0 23 38 63
LRR_Only
Worm 11 2 4 0 17
Fly 23 1 10 0 35*
Mouse 28 5 19 0 52
Human 32 6 19 0 57
Total 94 14 52 0 161*
including one with an FN3 domain (CG40500-PD). The chaoptin cluster also contains the worm tol-1 protein and the novel worm protein C56E6.6. The large LRR_Tollkin group is one example where the expectation of
hierarchi-cal clustering does not hold; in many cases, individual proteins in this broad family cluster into different sub-families at different e-values and inflation parameters [see Additional File 4 and discussion].
[image:11.612.55.557.87.597.2]Group-specific patterns of expansion and diversification
Figure 5
Group-specific patterns of expansion and diversification. The graphs depict three-dimensional histograms showing the number of clusters (on the z axis) having x members in the fly and y members in the mouse. The clusters used for this analysis are listed [see Additional File 6]. Different patterns of expansion (new members in one species of a conserved subfamily) and diversification (novel subfamilies in one species) are observed across the four major groups of eLRR proteins. Graphs were generated with the SPSS program.
LRR_Only
LRR_Other
Novel protein families
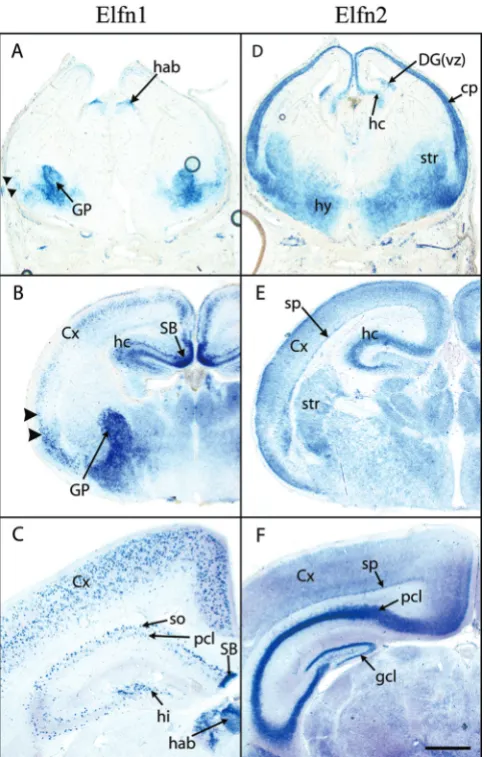
These analyses have also catalogued a large number of novel proteins and subfamilies encoding eLRR proteins in worms, flies and mammals. Two novel clusters in mam-mals are of special interest due to their expression patterns in the nervous system (see below). One includes two closely related TM proteins currently identified as A930017N06Rik and Lrrc62 in the mouse. These proteins form a distinct subfamily at high stringency and are char-acterized by a signal peptide, 6 LRR repeats, an LRR-CT and an FN3 domain extracellularly, a TM domain and a long cytoplasmic tail (Figures 3, 6). The cytoplasmic tail contains a large number of tyrosines but no other detect-able motifs. Both genes have two exons with the coding sequence entirely in the 3' exon. We propose to name these Elfn proteins, for extracellular-Leucine-rich repeat Fibronectin domain proteins. (A930017N06Rik is Elfn1 and Lrrc62 is Elfn2).
Another cluster of related proteins comprises BC004853 (called LRRC26 in humans), Lrrc38, Lrrc52 and Lrrc55, Lrtm1 and Lrtm2 (names derived from sequencing projects [79]). These are all LRR_Only proteins with a sig-nal peptide, an LRR-NT, 6 LRR repeats, an LRR-CT, a TM domain and a short cytoplasmic tail containing a short stretch of acidic residues (Figures 3, 7). Lrtm1 and 2 also contain conserved predicted PDZ-binding sequences at their C-termini, suggestive of synaptic localisation. These proteins cluster in a group of six at low stringency (e-25,
level 1), but break into several subclusters at higher strin-gency (including Lrtm1 and 2 and Lrrc38 and 55). They are defined as paralogues in the Ensembl database but whether they represent a true "subfamily" is unclear. For convenience, we refer to this cluster as the "Elron" cluster, for extracellular-Leucine-Rich repeat-Only proteins, but have not renamed individual members.
In flies there are several subfamilies of novel proteins. These include CG7800 and CG18249, both LRR_Only TM proteins, CG32055 and CG6749, both secreted LRR_Only proteins and CG10824 and CG11910, which cluster as a pair at e-35, level 2 and in a group of four with CG4950
and CG5810 at e-25, level 1. CG4950 is a predicted TM
protein while the others in this cluster are predicted secreted proteins.
In worms, a subfamily emerges comprising sym-1 (C44H4.3) and sym-5 (C44H4.2), both of which interact genetically with mec-8[80], along with C44H4.1 and two other predicted proteins K07A12.2 and ZK682.5. There are also several cases of apparent one-to-one worm-fly orthology of novel proteins, including CG16974 and ZC262.3a, CG7509 and M88.6a, CG15151 and T01G9.3 and CG5819 and K07A12.2.
Genomic clustering
To assess the possibility that some related genes might occur in clusters in the genome we examined genomic locations for all genes in our eLRR dataset [see Figure 2 and Additional File 3]. Not surprisingly, many closely related genes occur in tandem: five of the six Slitrk genes occur in two clusters in the mouse, one on the X chromo-some and one on chromochromo-some 14. Other genes occurring in tandem include Tlr7 and Tlr8, Islr1 and Islr2, Lrrc21/Pal
and Lrrc22, Lrrc8b, c and d and Fshr and Lhcgr. We also
found a number of examples where more distantly related genes occur in tandem in the genome, lending further support to the clustering results presented above,
includ-ing Cpn2, Gp5 and Lrrc15/Lib. In the fly, several
Toll-related genes occur in adjacent pairs (Tollo with Toll-6,
Toll-7 with 18w and Toll-9 with CG5195, a novel
non-TIR-containing member of the LRR_Tollkin group), as do
tar-tan and capricious. Similarly, a number of the novel
sub-families identified above occur in tandem including
CG7800 with CG18249, CG32055 with CG6749 and
CG10824 with CG5810. In the worm genome, the C44H4
genes (.1, .2 (sym-5) and .3 (sym-1)) also occur in tandem.
We observed an interesting situation in the family of small secreted proteoglycans that includes decorin, biglycan, and related genes. Proteins in this family fall into several subclusters using TribeMCL, in agreement with previous analyses [81]. Interestingly, many of them are also grouped in tandem in the genome in several different loci but each locus contains a representative of two or three subclusters. This suggests two early duplications in tan-dem and a subsequent triplication of the entire locus, with some additional gene losses and duplications [82]. The
Ecm2 gene is also located in tandem in one of these loci
(with Aspn, Omd and Ogn) but it is highly divergent from the other proteins and whether it should be considered a member of this family is debatable [74].
Expression analyses
In order to begin to assess the possible involvement of these novel genes and families in neural development we analysed the expression of a subset of them by in situ
Alignment of Elfn proteins
Figure 6
Alignment of Elfn proteins. Predicted amino acid sequences from Elfn1 (A930017N06Rik) and Elfn2 (Lrrc62) from the mouse were aligned with CLUSTALW. Amino acids are colour-coded by chemical properties: blue: acidic; green: hydroxyl/ amine/basic/Q; magenta: basic; red: small, hydrophobic (including aliphatic Y). Brackets indicate the extent of predicted motifs, including signal sequence (SS), six LRRs (the notch under the bracket indicates the end of the conserved N-terminal portion of each LRR), LRR-CT domain, fibronectin type-3 (FN3) domain and a transmembrane domain (TM). No recognizable LRR-NT domain was predicted. Note that the final LRR comprises the highly conserved N-terminal half-repeat only (consensus: Lxx-LxxLxLxxN). Identical residues are indicated by an asterisk, highly conservative substitutions by two dots and conservative sub-stitutions by a single dot.
Elfn1 MAGHGWGTAWVLVAAATLLHAGGLAQGDCWLIEGDKGFVWLAICSQNQPPYEAIPQQINN 60 Elfn2 MLRLGLCAAALLCVCQP---GAVRADCWLIEGDKGYVWLAICSQNQPPYETIPQHINS 55
* * :* :* .. .:: * .:.**********:**************:***:**.
Elfn1 TIVDLRLNENRIRSVQYASLSRFGNLTYLNLTKNEIGYIEDGAFSGQFNLQVLQLGYNRL 120 Elfn2 TVHDLRLNENKLKAVLYSSLNRFGNLTDLNLTKNEISYIEDGAFLGQTSLQVLQLGYNRL 115 *: *******::::* *:**.**************.******* ** .***********
Elfn1 RNLTEGMLRGLSKLEYLYLQANLIEVVMASAFWECPNIVNIDLSMNRIQQLGSGTFAGLT 180 Elfn2 SNLTEGMLRGMSRLQFLFVQHNLIEVVTPTAFSECPSLISIDLSSNRLSRLDGATFASLA 175 *********:*:*::*::* ****** .:** ***.::.**** **:.:*...***.*:
Elfn1 KLSVCEIYSNPFYCSCELLGFLRWLAAFTNATQTHDRVQCESPPVYAGYFLLGQGRHGHQ 240 Elfn2 SLMVCELAGNPFNCECDLFGFLAWLVVFNNVTKNYDRLQCESPREFAGYPLLVP-RPYHS 234 .* ***: .*** *.*:*:*** **..*.*.*:.:**:***** :*** ** * *.
Elfn1 RSILSKLQSVCTEGSYTAEVLGPPRPVPGRSQPGHSPPPPPPEPSDMPCADDECFSGDGT 300 Elfn2 LNAITVLQAKCRNGSMPARPVSHPTPYSTDAQR---EPD---ENSGFNPDEI 280 . :: **: * :** .*. :. * * . :* **. : ::. *. *
Elfn1 TPLVILTTLVPQTEARPSMKVKQLTQNSATIMVQLPSPFNRMYTLEQYNNSKSFTVSKLT 360 Elfn2 LSVEPPASSTTDASAGPAIKLHQVTFTSATLVVIIPHPYSKMYVLVQYNNSYFSDVMTLK 340 .: :: ..::.* *::*::*:* .***::* :* *:.:**.* ***** * .*.
Elfn1 QPQEEIRLTNLYTLTNYTYCVVSTSSGTHHNHTCLTICLPKPPSPPGPVPSPSTATHYIM 420 Elfn2 NKKEIVTLDKLRAHTEYTFCVTSLRNSRRFNHTCLTFTT-RDLVPGDLAPSTSTTTHYIM 399 : :* : * :* : *:**:**.* .. :.******: : * . .**.**:*****
Elfn1 TILGCLFGMVLVLGAVYYCLRKRRRQEEKHKKAVAAAAGSLKKTIIELKYGPEIEAPGLA 480 Elfn2 TILGCLFGMVIVLGAVYYCLRKRRMQEEKQK---SVNVKKTILEMRYGADVDAGSIV 453 **********:************* ****:* : : .:****:*::**.:::* .:.
Elfn1 PLTQG----PLLGPEAVTRIPYLPAATSDVEQYKLVESSETPKATKGNYIEVRTGEPQE- 535 Elfn2 HAAQKLGEPPVLPVARMSSIPSMVGEKLPASKGLEAGLDTPKVATKGNYIEVRTGAAGDS 513 :* *:* :: ** : . . ..: . . . ************ . :
Elfn1 --RRGCELSRPGEPQSSVAEISTIAKEVDRVNQIINNCIDALKSESTSFQGAKSGAVSAA 593 Elfn2 LARPEEELPEIENGQGSAAEISTIAKEVDKVNQIINNCIDALKLDSASFLGGGGGGGGGG 573 * **.. : *.*.***********:************* :*:** *. .*. ...
Elfn1 EPQLVLLSEPLAS---KHSFLSPVYKDAFGHGGLQRHHSVEAAPGPPRA 639 Elfn2 DSDLAFECQSLPAAPAASSAATPGALERPSFLSPPYKESS-HHPLQRQLSADAAVSRKTC 632 :.:*.: .:.*.: : ***** **:: * ***: *.:** . .
Elfn1 STSSSGSARSPRTFRAEATGTHKAP---ATETKYIEKSSPVPETILTVTPAATVLRAEAD 696 Elfn2 SVSSSGSIKSAKVFSLDVPDHPTPTGLAKSDSKYIEKGSPL-NSPLDRLPLVPTGSSGSS 691 *.***** :*.:.* :... ... :::*****.**: :: * * ... : :.
Elfn1 KSRQYGEHRHSYPGSHPAEPPAPPPPPPTHEGLG--GRKASILEPLTRPRPRDLVYSQLS 754 Elfn2 GGGGGIHHLEVKPAYHCSEHRHSFPALYYEEGADSLSQRVSFLKPLTRSK-RDSTYSQLS 750 . .* . *. * :* . *. .** . .::.*:*:****.: ** .*****
Elfn1 PQYHNLSYSSSPEYTCRASPSIWERLRLSRRRHKDDAEFMAAGHALRKKVQFAKDEDLHD 814 Elfn2 PRHYYSGYSSSPEYSSESTHKIWERFRPYKKHHR-EEVYMAAGHALRKKVQFAKDEDLHD 809 *::: .*******:..:: .****:* :::*: : :*********************
Elfn1 ILDYWKGVSAQHKS 828 Elfn2 ILDYWKGVSAQQKL 823 ***********:*
TM
LRR LRR
LRR LRR
LRR
SS
LRR-CT
Alignment of proteins in Elron cluster
Figure 7
Alignment of proteins in Elron cluster. Predicted amino acid sequences from Lrtm1, Lrtm2, Lrrc38, Lrrc55, Lrrc52 and BC004853 from the mouse were aligned with CLUSTALW. Brackets indicate the extent of predicted motifs (consensus limits are shown); the notch under the bracket indicates the end of the conserved N-terminal portion of each LRR. Arrowheads denote exon-intron boundaries. The short cytoplasmic domain is poorly conserved, but does contain similarly positioned acidic residues (E/D) in all members. Lrtm1 and 2 end in consensus PDZ-binding domains (SSSA/SSVA), underlined. Abbrevia-tions, amino acid colour-code and conservation symbols as in Figure 7.
Lrtm1 ---MLNEG---LCCGAWAMKGTLLLVSSVGLLLPGVG-SCPMKCLCHPS 42
Lrtm2 ---MLAPGGGPEQRSKLVLQWRQVSWITCWIALCAVEVIPACPFSCTCDSR 48
Lrrc38 ---MSLCVAPRHPTGAAAALGLGSLLVLLGPGRACPAGCACTDP 41
Lrrc52 MGSLQHCCCQLPKMGDTWAQLPWPGPPHSALLLVFFLLAAGVMHSDAGTSCPVLCTCRN- 59
Lrrc55 ---MSLASGPSSKLLLFSLGMGLVS---GSKCPNKCVCQDQ 35
BC004853 ---MRGSFFSRLPPQLSLLLLLSLRRVWTQEDIGTAPSKSPVAPECPEACSCSLG 52
** * *
Lrtm1 SNSVDCSGQGLSKVPRDLPPWTVTLLLQDNRIHWLPALAFQSVSLLSTLNLSNNSLSNLA 102
Lrtm2 SLEVDCSGLGLTTVPPDVPAATQSLLLLNNKLSALPSWAFANLSNLQRLDLSNNFLDQLP 108
Lrrc38 -HTVDCRDRGLPSVPDPFPLDVRKLLVAGNRIQQIPEDFFIFHGDLVYLDFRNNSLRSLE 100
Lrrc52 -QVVDCSNQRLFSVPPDLPMDTRNLSLAHNRIAAVPPGYLTCYMELRVLDLRNNSLMELP 118
Lrrc55 --EVACIDLHLTEYPADIPLNTRRLYLNNNKITSLPALQLGFLSDLVYLDCQNNRIREVM 93
BC004853 -GKANCSALALPAVPADLSWQVRSLLLDHNRVSALPPGAFANAGALLYLDLRENRLRSVH 111
. * * * .. . * : *:: :* : * *: :* : .:
Lrtm1 AEAFYGLPHLRVLNVTQNSLLSIESSFAHALPGLRELDLSSN-SLRILPTSLGKPWENLT 161
Lrtm2 RSIFEDLVNLTELQLRNNSIRTLDRDLLQHSPLLRHLDLSIN-GLAQLPPGLFDGLLALR 167
Lrrc38 EGTFSGSGKLAFLDLSYNNLTQLGAGAFRSAGRLVKLSLANN-HLAGVHEAAFESLESLQ 159
Lrrc52 PGLFLHAKRLAHLDLSYNNLSHVPADMFREAHGLVHIDLSHNPWLRRVHPQAFQGLVHLR 178
Lrrc55 DYTFIGIFRLIYLDLSSNNLTSISPFSFSVLTNLVRLNISHNPHLLYLDKYVFANTTSLR 153
BC004853 ARAFWGLGVLQWLDLSSNQLETLPPGTFAPLRALSFLSLAGN-RLALLEPSILGPLPLLR 170
* * *:: *.: : * :.:: * * *
VFAVQQNHLLHLDRELLEAMPKVRLVLLKDNPWICDCHLLGLKLWLERFTFQG-GETDGA 220
SLSLRSNRLQSLDRLTFEPLASLQLLQVGDNPWECDCNLREFKHWLEWFSYRG-GRLDQL 226
VLELNDNNLRSLNVAALDALPALRTVRLDGNPWLCDCDFAHLFSWIQENTSKLPKGLDAI 219
DLDLSYGGLAFLSLEALEGLPGLVTLQIGGNPWVCGCTMEPLLKWLRNRIQRCTADSQLA 238
YLDLRNTGLHIIDHNGFHHLVVLQTLYLSGNPWICNCSFLDFTIHLLVSHMDH-PDAQNA 212
VLSLQDNSLSAIEAGLLNNLPALDVLRLHGNPWTCNCALRPLCTWLRKHPRPA-SETETL 229
: : * :. :. : : : : .*** *.* : : : :
Lrtm1 ICRLPEPWQGKALLSIPHELYQPCSLPSQDLAPSLVQQPGS----APQDAQKSHENSSGQ 276
Lrtm2 ACTLPKELRGKDMRAVPMEMFNYCSQLEDENNSAGLDAPGPPCTKASPEPPKPKPGAEPE 286
Lrrc38 QCSLPMEDRRVALRELSEASFSECKFS--- 246
Lrrc52 ECRGPPEVEGAPLFSLTEESFKACHLT--- 265
Lrrc55 TCTEPAELKGWPITKVGNPLQYMCITH--- 239
BC004853 LCVSPRLQTLSLLTAFPDAAFKQCTQS--- 256
* * : . * Lrtm1 QDP-LECEAKPKPKPTNLRHAVATVVITGVVCGIVCLMMLAAAIYGCTYAAITAQYQ--- 332
Lrtm2 PEPSTACPQKQRYRPVSVRRAIGTVIIAGVVCGIVCIMMVVAAAYGCIYASLMAKYHREL 346 Lrrc38 ---LSLTDLFIIIFSGVAVSIAAIISSFFLATVVQCFQRCAP-- 285
Lrrc52 ---LTLDDYLFIAFVGFVVSIASVATNFLLGITANCCHRWSK-- 304
Lrrc55 ---LDQQDYIFLLLIGFCIFAAGTVAAWLTGVCAVLYQNALR-- 278
BC004853 ---LAARDLAVVYALGPVSFLASLAICLALGSVLTACGARRRRRRRTTVRHLL 306 : : : Lrtm1 --GRPLASARKSEKMGSKELMDSSSA--- 356
Lrtm2 KKRQPLMGDPEGEHEDQKQISSVA--- 370
Lrrc38 ---NKDTEDEDDDEDD--- 298
Lrrc52 ---ANEEEEI--- 311
TM LRR-CT LRR SS LRR LRR LRR LRR-NT LRR : Lrrc55 ----TSSGDDTEDETGSRFANQIFRSNTHLGPIRRFPELI 314 BC004853 RRQLDPEGPPSLEDAGSPVTAAIQA--- 331
:.
Lrtm1 Lrtm2 Lrrc38 Lrrc52 Lrrc55 BC004853
to the nervous system (Unigene reference: Mm.323188), while Elfn1 is also expressed in endocrine and reproduc-tive tissues (Unigene reference: Mm.237102).
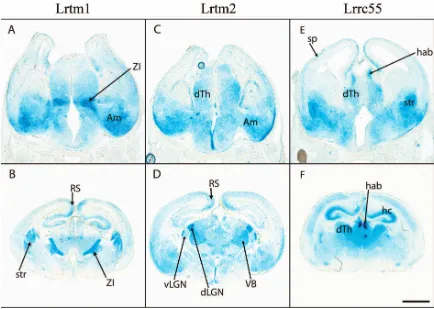
Among the genes in the Elron cluster, three (Lrtm1, Lrtm2
and Lrrc55) are expressed in discrete regions of the
devel-oping mouse brain, in particular marking different nuclei in the developing thalamus as well as a number of other areas (Figure 9). According to the Allen Brain Atlas, the expression of Lrtm1 declines after development and is practically undetectable in adults. In contrast, Lrtm2 is maintained at high levels in adults in a number of discrete regions including the granule cell layer in the olfactory bulb, the basal ganglia, dorsal thalamus, dentate gyrus, layers 2/3 and 5 in the cortex and Purkinje cells in the cer-ebellum. Lrrc55 is also maintained at high levels in mitral cells in the olfactory bulb, in the habenula and in layers 4 and 6a in the cortex. Lrrc38 is expressed at lower levels during development (data not shown) but is expressed in a specific pattern in the adult brain, including the CA3 region of the hippocampus and the zona incerta [83].
BC004853 and Lrrc52 do not appear to be expressed in the
embryonic or postnatal brain. This result is confirmed by the absence of expression in the Allen Brain Atlas and by analysis of cDNA abundance in the Unigene database, which show that Lrrc52 (Mm.159799) is specific to mus-cle and testis and that BC004853 (Mm.275228) is almost exclusively expressed by the vesicular organ in the male reproductive system. Similar cDNA abundance data for the other four genes show that LRTM2 (in this case human, Hs.585579) is almost brain-specific, while
Lrtm1(Mm.95780), Lrrc38 (Mm.94020) and Lrrc55
(Mm.291095) are also expressed in a small number of other tissues.
The expression of the Elfn genes and of several genes in the Elron cluster is thus consistent with a possible role in specifying neuronal connectivity, especially thalamic and cortical connectivity.
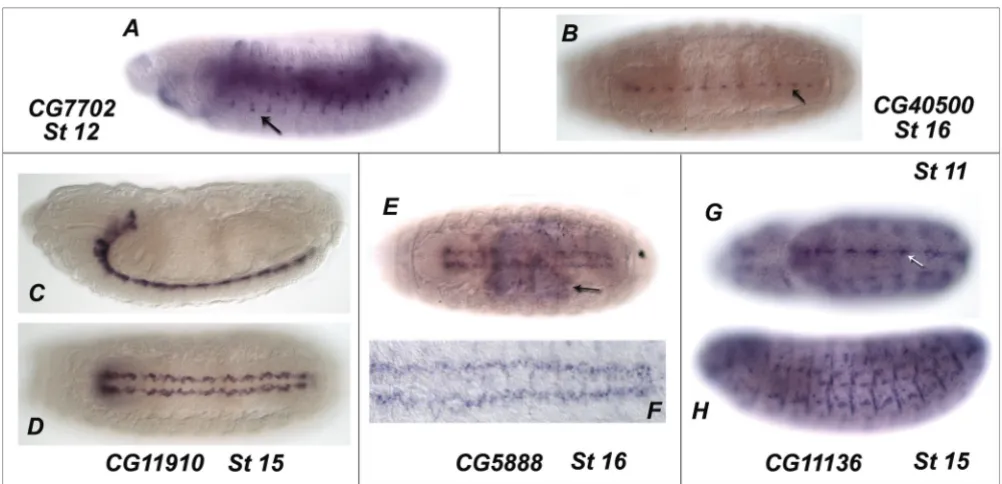
The expression patterns of many of the Drosophila eLRR genes identified in the bioinformatic screen were also examined in the embryo by in situ hybridisation. A sum-mary of the expression patterns we identified and those previously described is presented [see Additional File 7]. We describe here the expression patterns of those novel eLRR genes identified in our survey that include expres-sion in the nervous system (Figure 10). CG7702 is expressed dynamically in the peripheral nervous system (PNS), appearing at stage 11 and disappearing during stage 15. CG40500 is exclusively expressed in the CNS and is restricted to a subset of cells at the ventral midline, beginning during stage 14 and remaining into stage 17.
CG11910 expression is restricted to the most dorsal layer
of the CNS in a position consistent with the longitudinal
glia. This expression begins at stage 12 and continues throughout embryonic development. CG5888 is expressed from stage 5 throughout the embryo with exception of the anterior tip (data not shown). At stage 15 expression of CG5888 is initiated in a subset of cells in the CNS. CG11136 is expressed in an anteroposterior stripe within the neurogenic region and in the prospective brain lobes during stages 8–10 (data not shown) and in discrete cells at the midline of the CNS during stages 11 and 12. From stage 11 onwards CG11136 expression is seen pre-dominantly in the somatic musculature.
Discussion
This study aimed to catalogue the full repertoire of eLRR proteins in the proteomes of worms, flies, mice and humans, to examine their evolutionary relationships and to identify novel proteins and subfamilies that may have important roles in nervous system development.
Methodological issues
Generating this dataset required identifying all LRR pro-teins, distinguishing eLRR proteins among this set (i.e., correctly predicting cellular localisation) and analyzing evolutionary relationships across a large set of highly divergent, multi-domain, repetitive proteins in four dis-tantly related species. For all of these tasks we found the use of single programs only partly reliable. It was espe-cially difficult to derive a single set of parameters for any program that would reliably predict the presence of a par-ticular motif or correctly identify orthologues and para-logues for all proteins in the dataset. To overcome this problem we developed an approach of parallel annota-tion with many different programs, followed by manual curation to arrive at a consensus architecture for each gene, along with a hierarchical clustering method designed to reveal relationships at multiple levels. This is in contrast to the automated one-size-fits-all approaches currently used by some of the large genome databases.
A comprehensive, curated dataset
genes, for example. In most of these cases the fragments still clustered with other eLRR genes and a full-length
sequence was often identifiable from one of the starting datasets. It is difficult to estimate how common such annotation errors are but it is reasonable to expect that they may have caused us to miss a small number of addi-tional eLRR genes or to misclassify some as cytoplasmic.
The manual curation of these sequences has added sub-stantially to the value of this dataset. An appreciable per-centage of predicted protein sequences had to be amended in some way to yield what we consider to be the "correct" predicted full-length protein. These corrections were based on various factors including comparison of architectures across orthologues or paralogues, the absence of an expected signal peptide or the location of the predicted start codon with respect to the signal pep-tide.
Because degenerate or atypical LRRs have been described [4,49,69] that do not match the consensus motifs defined by SMART and Pfam we designed a customised program, LRRscan, to search for a minimal consensus that defines animal extracellular LRRs. We also searched for minimal consensus motifs that define LRR-NT and several varieties of LRR-CT domains found in different types of proteins, including small proteoglycans and G-protein-coupled receptors [4]. These predictions were compared with the results of SMART and Pfam [see Additional File 2] and a consensus architecture was predicted by manual inspec-tion, based on converging evidence. The results match those of proteins with known structures [5-7,70-73,84], significantly better than a combination of SMART and Pfam alone (allowing for semantic differences in whether the final half repeat is counted as one and whether puta-tive LRRs overlapping with NT or CT domains are counted). The predicted transmembrane topologies are also based on converging evidence from multiple pro-grams and have also been subject to expert evaluation. Nevertheless, the architectures presented should be viewed as predictions that will require experimental veri-fication. In particular, the absence of a predicted LRR-NT or LRR-CT domain does not mean there is no domain present that is performing a capping function; there may be additional varieties of such domains that have not yet been defined. In addition, we have chosen a representa-tive isoform for each gene; the database thus contains no information on alternative splice forms or other isoforms that may have differing architectures.
Hierarchical clustering
The hierarchical clustering method we used gets around the problem of defining a unique set of parameters that is suitable to all proteins and levels of inter-relationship. In most cases, it generates a tree-like structure that reveals relationships across many different levels at once. This is a difficult problem for multiple alignment programs such
[image:16.612.55.298.86.465.2]Expression of Elfn genes in developing mouse brain
Figure 8
as CLUSTALW or T-COFFEE, which work well for closely related proteins but which are not designed to compare highly divergent proteins with differing architectures. Pre-vious attempts using multiple alignment programs to derive a phylogenetic tree across many eLRR subfamilies at once contain numerous differences from our results and from known relationships [3,85].
In some cases, the results of TribeMCL depart from the expected hierarchical relationship. This is the case for the extended LRR_Tollkin group of proteins, including many proteins characterized by an eLRR domain but lacking an obvious TIR domain. While the clustering of these pro-teins with the TLR group is quite convincing, based on direct inspection of the BLAST results, it is extremely diffi-cult, indeed impossible with these data, to discern more discrete relationships within this large family. The reasons for the anomalous hierarchical clustering results with these genes may relate to the large number of LRRs present in these proteins and the very slight differences in pairwise
similarities across the group. At different levels of strin-gency small differences in BLAST scores may be amplified by the TribeMCL algorithm to result in membership of different clusters that do not share the expected hierarchi-cal relationship. Attempts to resolve the phylogeny of all the genes in this group using the T-COFFEE multiple alignment program were no more enlightening, resulting in a starburst pattern where the roots of each subfamily are too close to each other to resolve (data not shown). Despite these limitations, the TribeMCL analysis has revealed a group of eLRR proteins that are clearly more related to the TLR proteins than to other LRR_Only pro-teins.
Nomenclature
The current nomenclature of eLRR proteins is very confus-ing, with multiple synonyms for many genes [see Addi-tional File 3], many of which do not give accurate information on relationships. For example, there is a large number of proteins designated LrrcX, where X is a
[image:17.612.86.520.86.395.2]Expression of Elron cluster genes in developing mouse brain
Figure 9
number. These names were apparently derived from large-scale genome projects and do not represent a specific sub-family of related proteins. For that reason we have pro-posed the names Elfn1 and 2 for one novel subfamily. We also identify another discrete cluster of six "novel" pro-teins (which we refer to as the Elron cluster), although whether they represent a true subfamily is open to debate. In addition, some novel proteins that group into small subfamilies with Lrrc21/Pal, Chad, Lrrc3 and Tpbg/5T4 [see Additional File 3, Figures 3 and 4] could be given names to reflect that fact. Finally, while Lrrn1, 2 and 3 (also known as NLRR1, 5 and 3) form a subfamily, the recently named NLRR4 [46] is not in fact a member of this subfamily. It does not have the Ig domain present in these genes and does not cluster with those genes at any param-eters.
Comparative analyses of major groups
For the purposes of some of the analyses we split the eLRR proteins into four groups, based on architecture and clus-tering results. The LRR_Ig/FN3 group includes the largest percentage of mammal-specific subfamilies, many with
multiple members. Almost all of the proteins in this group are associated with the membrane, either type I TM or GPI-linked. The majority of these subfamilies (including Ntrks, Lrfns/Salms, Flrts, Lrigs, Netrin-G ligands, and Lingo proteins) show discrete expression in the nervous system and many of them have been shown to have func-tions in neural development [3] and/or have been impli-cated in neurological or psychiatric disease [49]. Expansion of this class of proteins is thus correlated with the evolution of the complex mammalian brain and plau-sibly contributed to it by providing the requisite specifi-city of cellular interactions to mediate a large number of selective connectivity decisions. We have identified a novel mammal-specific LRR_FN3 subfamily, the Elfn pro-teins, with discrete nervous system expression.
The LRR_Only group shows independent diversification in flies and mammals, with a large number of singletons (unclustered proteins), suggesting rapid sequence diver-gence. This group also contains a number of proteins implicated in nervous system development or function including the Nogo-receptor, Lrrtm and Slitrk families,
[image:18.612.54.555.85.327.2]Expression of novel eLRR genes in the Drosophila embryo
Figure 10
and connectin, Gp150, Tpbg/5T4 and Nyx for example. We have identified six proteins in another novel mam-mal-specific cluster, the Elron cluster, several of which show highly suggestive expression patterns in the devel-oping nervous system. We have also discovered a number of novel fly proteins in this class that are similarly dis-cretely expressed in the embryonic nervous system.
The LRR_Tollkin group shows a different pattern of evolu-tion, with parallel expansions in flies and mammals, of both the Toll-like receptor genes and of the genes that cluster with them. In mammals, the latter include Cpn2, Gp5 and Lrrc15 (Lib), which form a subcluster and which are also arrayed in tandem on chromosome 3 in humans (16 in mouse). These proteins have diverse binding part-ners and biochemical functions but are all involved in inflammation in some way: as a regulatory subunit of car-boxypeptidase [86], as a component of the platelet glyco-protein complex (which also contains the eLRR glyco-proteins GP1bα and GP1bβ[87]), and as a mediator of the glial response to β-amyloid [88], respectively. They form a slightly larger cluster with Igfals, the acid-labile subunit of insulin growth factor, which regulates IGF signaling [89] and with the novel gene KIAA0644, which has an FN3 domain in addition to the LRR domain. Lrrc32/GARP [90] and its paralogue Lrrc33 also cluster with this group at e -40, level 1, but not at some lower levels. The novel fly gene
CG7509 also clusters with this group at e-40, level 1 and
with other fly genes including chaoptin at some other lev-els. Whether it can be said to be directly orthologous to any (or all) of these mammalian proteins is hard to deter-mine. The other fly genes in this group are mostly novel and include CG40500-PD, which has an FN3 domain and which shows very discrete expression in the midline of the embryonic nervous system.
The LRR_Other group is an arbitrary default group as it contains many unrelated genes or subfamilies. Neverthe-less, it is interesting to note that this group contains the highest percentage of genes with orthologues across all species, including worms (e.g., the slits and peroxidasins and some of the seven-transmembrane hormone recep-tors). This group also includes the mammalian Lgi sub-family, recently implicated in epilepsy and myelination.
Human-mouse differences
Only a small number of proteins are specific to either human or mouse. There are two cases where there are genes in humans that are not represented in mouse that both seem to be caused by specific loss in mice, rather than representing human-specific genes. The human gene synleurin appears to have been pseudogenised in rodents, although it is present in many other species besides humans (including dog, cow and chick, for example). Also, MXRA5 (or adlican), a paralogue of the large
secreted protein Igsf10, is not detectable in the mouse genome (but is present in cow, dog and opossum, for example).
There is also a small number of examples where there has been independent expansion of subfamilies in either humans or mice. These include the Toll-like receptors TLR10 in humans and TLR11, 12 and 13 in the mouse. They also include the unusual subfamily of LRRC37 genes, which is represented by a single gene in the mouse (called Lrrc37a) but multiple, highly related genes in humans (LRRC37A, A2 and A3 and LRRC37B, as well as a number of other partial duplicates lacking LRRs). These are located in tandem on chromosome 17 and have arisen from multiple duplications of the BRCA1 region in pri-mates [91]. The extracellular domains of these TM pro-teins are characterised by six predicted LRRs but these make up only a small fraction of the overall protein, which is highly variable in length. The functions and expression patterns of these unusual proteins are unknown.
Conclusion
This survey presents a comprehensive overview of the rep-ertoire of eLRR proteins in various species and their inter-relationships. As such, it provides the necessary founda-tion for a systematic analysis of the funcfounda-tions of this class of genes, which are likely to include prominently neural development, innate immunity and inflammation. In particular, expansion of the eLRR proteome is correlated with increasing complexity of the nervous system. Given the functions and discrete expression patterns of many known members, it seems likely that this superfamily, including the novel proteins identified here, could pro-vide the requisite specificity of cellular interactions to mediate a large number of selective connectivity deci-sions.
Methods
Database pipelineadded manually. All sequences were stored for easy access in a MySQL database.
The data set was reduced through use of a small Perl script that filters out duplicate copies of sequences for each spe-cies and keeps either the Ensembl version or an entry with a flag indicating its preference after manual curation. The non-redundant data sets for mouse, human, worm, and fly contained 85991, 74866, 22698, and 16857 sequences, respectively.
These sequences were subjected to an all-against-all Blast search (NCBI BlastP, version 2.2.12) carried out on a high-performance Linux cluster. An expectation cut-off of 0.1 was specified, and the top 200 hits for each search in tab-delimited format (-m8) were reported. The Blast results were parsed with the mcxdeblast tool using expec-tation cut-offs from e-10 to e-40 and formatted for clustering
with the mcxassemble tool (options -q -r max -map -b), both part of the MCL package (version 1.005, 05–272). Each output was then subjected to Markov clustering with the MCL program using inflation parameters ranging from 1.2 to 5. The program Tribe-families was then run to produce the final clusters.
For proteins from the IPI and MGC set that did not have gene IDs assigned, we produced alignments using T-Cof-fee (version 3.93) with their best Blast hits. If sequences with matching protein names were found that are fully contained in another one or showed identity over at least 95% and sequence difference of maximal 15% we trans-ferred Ensembl gene ID annotation where available. Through this, 2490 sequences from mouse and 1458 sequences from human were assigned Ensembl gene IDs. The gene information was used to remove isoforms from the clusters: only the protein with the longest sequence was kept for each gene. In some cases, where dubious excessive amino acids seem to have been added to a sequence, manual curation was necessary to overwrite this behavior and select proteins that seemed biologically more plausible.
For prediction of architecture we used HMMpfam of the HMMER package (version 2.3.2) [93], together with the SMART (release 25 Nov. 2004) and Pfam (version 19.0) HMM libraries. Transmembrane predictions were pro-duced by the programs TMHMM (version 2.0 [58]), HMMTOP (version 2.1 [63]), and TMPred [64]. Signal Sequence analysis was carried out using SignalP (version 3.0 [59]) and GPI-link results calculated by the BIG-PI program [65] were obtained for human [94] and fly [95]. In addition, information about the genomic location and synonyms for a gene were retrieved from Ensembl, MGI, Wormbase and Flybase. Clustering and annotation
infor-mation were combined into a large spreadsheet for the final output.
LRRscan
Based on a number of published studies [1,4,49,96] and our own inspection of the sequences in our dataset we defined the minimal N-terminal part of a single extracel-lular-type LRR as: LxxLxLxxN. This is followed by a C-ter-minal part of each LRR of typically 10–21 amino acids that are quite variable. Consensus sequences for the LRR capping domains (LRR-NT at the N-terminus and LRR-CT at the C-terminus) have been defined by [4], including three different consensus sequences for the LRR-CT domain, derived from different classes of proteins. LRR-CT1 is the most common type, LRR-CT2 is found in small proteoglycans and LRR-CT3 in G-protein-coupled recep-tors:
LRR-CT1 domain: P(w/f)xCxCxoxWLxxw(9–24)oxC(9– 18)CxxP
LRR-CT2 domain: nI(s/t)xogxxdFCxoxxxxo(4–5)y(4)Lxx Npo(6)PxxfxCo
LRR-CT3 domain: LxxAxL(s/t)YPSHCCAFxN(6–19)nosx CnxsxxR...
LRR-NT domain: (7–10)CP(2–5)CxC(4–17)oxC(2–4)ox xoPxxoP
"x" represents any residue and "o" a non-polar residue [4].
We derived a minimal consensus sequence from each of the above and designed a new program, LRRscan, to search for these sequences as well as the minimal LRR defined above. The search for LRR-NTs and LRR-CTs focuses exclusively on the cysteines, which are the most conserved amino acids in these motifs. The regular expres-sions applied are as follows:
LRR: L..L.L..N.{10,21}
LRR-NT: C.{2,8}C.C.{6,19}C.{11,15}
LRR-CT1: ...C.C.{19,34}C.{9,18}C.{3}
LRR-CT1_short: ...C.C.{19,34}C.{22}
LRR-CT2: .{10}C.{30,31}C.
LRR-CT3: ..CC.{14,27}C.{6}