Abstract— Accurate software effort estimation is crucial for the software development process. Neither over estimated nor underestimated effort is welcome. Academic researchers and practitioners have long been searching for more accurate estimation models or methods. The objective of this paper is to explore the studies on software effort estimation accuracy available in the literature and analyze the findings to obtain the answer for the question: which software effort estimation model is more accurate? There were very limited reports that satisfied the research criteria. Only 8 studies with 10 reports were discovered for the analysis. It is found that Use Case Point Analysis outperforms other models with the least weighted average Mean Magnitude of Relative Error (MMRE) of 39.11%, compare to 90.38% for Function Point Analysis and 284.61% for COCOMO model. It indicates that there is still need to improve the estimation performance but the question is how.
Index Terms—software effort estimation, performance of software effort estimation models, Function Point Analysis, Use Case Point Analysis, COCOMO models.
I. INTRODUCTION
ccurate software cost estimation is crucial for the software development process. It is used for project planning and control purposes during the project execution [1]. Either over estimated or underestimated cost is not welcome.
Academic researchers and practitioners have long been searching for more accurate estimation models or methods. In 1987, Kemerer in [2] posed two research questions: a) are models that do not use source lines of code as accurate as those do? And b) are the models available in the open literature as accurate as proprietary models? Empirical data were gather to compare the performance of the four software cost estimation models: SLIM, COCOMO models, ESTIMAC and Function Points. However, the results were inconclusive.
Over the years of development, have we achieved the answer for the question: which software effort estimation model is more accurate? The objective of this paper is therefore to explore the studies on software estimation accuracy available in the literature and analyze the findings to obtain the answer for this question.
Manuscript received January 29, 2016.
T. Arnuphaptrairong is with the Department of Statistics, Chulalongkorn Business School, Chulalongkorn University, Bangkok 10250 Thailand (e-mail: [email protected]).
This article is organized as follows. Section II gives the review on how the software estimation accuracy was measured and the research method employed is given in Section III. Section IV presents the findings. Finally, section V concludes and discusses the future research.
II. ESTIMATION ACCURACY EVALUATION CRITERIA
The Magnitude of Relative Error (MRE) and the Mean Magnitude of Relative Error (MMRE) [3], [4] are used to evaluate the accuracy of the cost estimation models. They are defined as:
Where is the actual value and is the estimate
Where n is the number of estimates; and is the Magnitude of Relative Error (MRE) of the ith estimate.
III. RESEARCH METHOD EMPLOYED
The objective of this paper is to explore the studies on software estimation accuracy available in the literature and analyze the findings to obtain the answer for the research question. However, over the years, there have been a lot of researches contributed to software effort estimation models. There are many recognized software estimation models or methods. This paper thus proposed to study 3 prominent estimation models: Function Point Analysis, Use Case Point Analysis, and COCOMO Model since they are more well-known and recognized [2], [5], [6]. Because otherwise it may result in there is no report needed available in the literature had the less well-known or recognized models were selected.
In order to answer the research question, another criteria is that the studies included should report both software estimated effort and software actual effort, or Magnitude of Relative Error (MRE) so that it is possible for the analysis to answer the research question. There are altogether 8 studies with 10 reports that satisfied the information needed -- 3 of Function Point Analysis, 4 of Use Case Point analysis and 4 of COCOMO model.
IV. FINDINGS
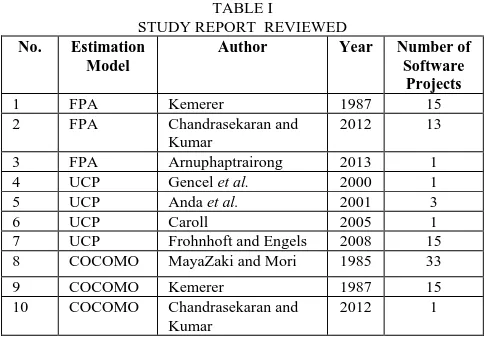
The studies of the software estimation accuracy reviewed are listed in table I, in estimation model and chronological order.
Tharwon Arnuphaptrairong
A Literature Survey on the Accuracy of
Software Effort Estimation Models
A. Function Point Analysis Results
[image:2.595.46.291.166.340.2]Table I shows that there are only 3 studies of accuracy Function Point Analysis found that contented the information needed. They are the studies of Kemerer [2] in 1987, Chandrasekaran and Kumar [7] in 2012, and Arnuphaptrairong [8] in 2013. In fact, there are many other studies in the literature but most of them are about Project Delivery Rates: PDR or Productivity rates which did not satisfy the research criteria.
TABLE I
STUDY REPORT REVIEWED
No. Estimation
Model
Author Year Number of
Software Projects
1 FPA Kemerer 1987 15 2 FPA Chandrasekaran and
Kumar
2012 13 3 FPA Arnuphaptrairong 2013 1 4 UCP Gencel et al. 2000 1 5 UCP Anda et al. 2001 3 6 UCP Caroll 2005 1 7 UCP Frohnhoft and Engels 2008 15 8 COCOMO MayaZaki and Mori 1985 33 9 COCOMO Kemerer 1987 15 10 COCOMO Chandrasekaran and
Kumar
2012 1
Kemerer [2]
In 1987 Kemerer [2], in the paper entitled “An Empirical Validation of Software Cost Estimation Models” compared the accuracy of 4 estimation models: FPA, COCOMO, SLIM, and ESTIMACS. Table II shows the effort estimate (man-month), the actual effort (man-month), and percentage MRE data of the 15 software projects using Function Point Analysis (FPA) for the effort estimation.
TABLE II
DETALIS OF THE SOFTWARE PROJECTS FROM KEMERER [2]
Project Estimated Effort
(man –month)
Actual effort (man –month)
MRE (%)
1 344.30 287.00 19.97 2 92.13 82.50 11.67 3 731.43 1,107.30 33.94 4 192.03 86.90 120.98 5 387.11 336.30 15.11 6 61.58 84.00 26.69 7 52.60 23.20 326.73 8 264.68 130.30 103.13 9 477.81 116.00 311.91 10 2.83 72.00 103.93 11 484.24 258.70 87.18 12 192.21 230.70 16.68 13 157.36 157.00 0.23 14 390.63 246.90 58.21 15 282.91 69.90 304.74
MMRE (%) 102.74
Table II shows the data set of FPA --the effort estimates and the actual effort in man month. All of the data of the 15 software projects were collected from one company. The software project sizes range from 39 KSLOC to 200 KSLOC. Most of them are COBOL business applications. The percentage of Mean Magnitude of Relative Error (MMRE) is 102.74.
Chandrasekaran and Kumar [7]
[image:2.595.300.555.220.271.2]Chandrasekaran and Kumar [7], in the article entitled “on the Estimation of the Software Effort and Schedule using Constructive Cost Model –II and Function Point Analysis” in 2012, described a case study applying COCOMO model and Function Point Analysis for the effort estimation. Table III shows data of the case study using Function Point Analysis for the effort estimation --the effort estimate (34.30 man-month), the actual effort (30.12 man-month), and percentage MRE (13.8%).
TABLE III
DETALIS OF THE SOFTWARE PROJECT FROM CHANDRASEKARAN AND KUMAR [7]
Estimated Effort (Man-Month)
Actual Effort (Man-Month)
MRE (%)
34.30 30.12 13.8
Arnuphaptrairong [8]
[image:2.595.317.546.434.600.2]
In 2013, Arnuphaptrairong [8] reported in the paper entitled “Early Stage Software Effort Estimation Using Function Point Analysis: An Empirical Validation.” The paper reported the accuracy of Function Point Analysis of 13 software projects using data available in the dataflow diagram. Table IV shows the effort estimates (man-hour), the actual efforts (man-hour), and percentage MRE from the analysis.
TABLE IV
DETALIS OF THE SOFTWARE PROJECTS FROM ARNUPHAPTRAIRONG [8]
Project No.
Estimated Effort (man –hour)
Actual effort (man –hour)
MRE (%)
1 4,959.33 400.00 1,139.83 2 6,613.23 1,016.00 550.91 3 34,721.80 560.00 6,100.32 4 1,830.98 640.00 186.09 5 2,461.02 240.00 925.43 6 1,416.48 400.00 254.12 7 6,147.94 458.00 1,242.34 8 4,432.44 384.00 1,054.28 9 1,211.29 550.00 120.23 10 1,188.59 600.00 98.10 11 3,027.70 520.00 482.25 12 3,635.39 1,080.00 236.61 13 8,384.19 95.00 8,725.46
MMRE (%) 1,624.31
The 13 projects were student projects required for their master program. All of them were business application implemented with VB.net, C++, or C#.net. The Mean Magnitude of Relative Error (MMRE) was 1,624.31% which was very high. All the estimated values were higher the actual efforts for every projects.
TABLE V
THE MAGNITUDE OF RELATIVE ERROR (MRE) WITH VARIOUS PROJECT DELIVERY RATES
Author (year) Effort (man-hour) MRE
(%)
Albretch & Gaffney (1983) [9]
Effort = FP / 0.0595 or 16.81
*FP 1,747 Behrens (1983) [10] Effort = 18.3 * FP 1,894 Moser & Nierstrasz
(1996) [11]
Effort = 6.667 * FP
629 Lokan et al. (2000) [12] Effort = 21 * FP (0.826) 82 Maxwell&Forselius
(2000) [13]
Effort = FP / 0.337 or 2.97 * FP 263 Jeffery et al. (2001) [3] Effort = 2.2 * FP 189
Table V shows that the selection of Project Delivery Rates or project delivery rate (PDR) can produce better results. For example, with the productivity rate equation of Lokan et al. (2000) -- Effort = 21 * FP (0.826), gives a MMRE of 82%, or with the productivity rate of Jeffery et al. (2000) -- Effort = 2.2 * FP, resulted in a MMRE of 189%.
[image:3.595.303.549.208.280.2]Table VI summarized the accuracy of the three studies. The weighted average MMRE of all studies is 90.38%.
TABLE VI
PERCENTAGE OF MMRE OF ALL THREE FUNCTION POINTS STUDIES
Report no.
Author (Year) Number of software
Projects
MMRE (%)
1 Kemerer (1987) 15 102.74 2 Chandrasekaran and
Kumar (2012)
1 13.8 3 Arnuphaptrairong
(2013)
13 82.00 Weighted average of
all reports
90.38
B. Use Case Point Analysis Results
From the review of literature, there are four reports on the accuracy of Use Case Point (UCP) Analysis that contain the data needed. They are Gencel et.al. [14] in 2000, Anda et.al. [6] in 2001, Caroll [15] in 2005 and Frohnhoft and Engels [5] in 2008. The following section gives the details of these reports.
Gencel et.al. [14]
Gencel et.al. [14], in the article entitled “A Case Study on the Evaluation of COSMIC-FFP and Use Case Points” in 2000, presented the results of a case study on applying COSMIC-FFP and Use Case Point methods to a military inventory management software that integrated with a document management system project. Table VII shows the effort estimate (11,859.88 man-hour), the actual effort (6,308 man-hour), and percentage MRE (88.01%) data of the case study.
TABLE VII
DETALIS OF THE SOFTWARE PROJECTS FROM GENCEL ET AL. [14]
Estimated effort (Man-Hour)
Actual effort (Man-Hour) MRE
(%)
11,859.88 6,308 88.01
Anda et.al. [6]
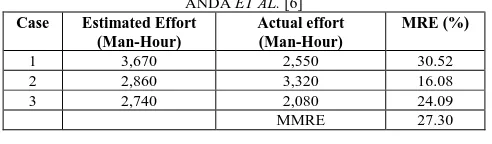
Anda et.al. [6], in the article entitled “Estimating Software Development Effort based on Use Case – Experience from Industry”, in 2001, reported the experience in applying Use Case Point method for three industrial case studies of a Scandinavian software company. Table VIII shows the effort estimate day), the actual effort (man-day), and percentage MRE data of the three case studies. The MMRE of the three projects was 27.30%.
TABLE VIII
DETALIS OF THE SOFTWARE PROJECTS FROM ANDA ET AL. [6]
Case Estimated Effort
(Man-Hour)
Actual effort (Man-Hour)
MRE (%)
1 3,670 2,550 30.52 2 2,860 3,320 16.08 3 2,740 2,080 24.09 MMRE 27.30
Caroll [15]
Caroll [15] in the article entitled “Estimating Software Based on Use Case Points” in 2005, described how a large software company -- Agilis Solutions in Oregon, estimates software project cost using Use Case Point Analysis. The article showed how to use and suggest improvement through a case study. Table IX shows the effort estimate (420 man-day), the actual effort (245.98 man-man-day), and percentage MRE (70.75) data of the case study.
TABLE IX
DETALIS OF THE SOFTWARE PROJECTS FROM CAROLL [15] Effort estimate (Man-Day) Actual effort (Man-Day) MRE (%) 420 245.98 70.75
Frohnhoft and Engels [5]
In presenting a method to improve Use Case Point Analysis, Frohnhoft and Engels [5], in 2008, applying Use Case Point method on 15 commercial software projects in a company --sd&m, in Capgemini. Table X shows the effort estimate (man-hour), the actual effort (man-hour), and percentage MRE data of the 15 projects.
TABLE X
DETALIS OF THE 15 SOFTWARE PROJECTS FROM FROHNHOFT AND ENGELS [5]
Project Industry Effort
estimates (Man- Hour)
Actual Effort (Man- month)
MRE (%)
1 Apparel industry
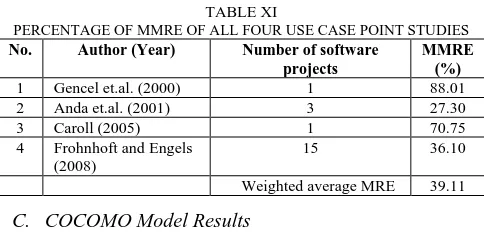
[image:3.595.45.293.342.440.2]Table XI summarized the accuracy of the four studies. The weighted average MMRE of all studies was 39.11%.
TABLE XI
PERCENTAGE OF MMRE OF ALL FOUR USE CASE POINT STUDIES
No. Author (Year) Number of software
projects
MMRE (%)
1 Gencel et.al. (2000) 1 88.01 2 Anda et.al. (2001) 3 27.30 3 Caroll (2005) 1 70.75 4 Frohnhoft and Engels
(2008)
15 36.10 Weighted average MRE 39.11
C. COCOMO Model Results
There are not many reports about CCOCOO model accuracy. Three reports of COCOMO model accuracy were found in the review of literature that contented the information needed. They are the studies of MayaZaki and Mori in 1985 [16], Kemerer in 1987 [2], and Chandrasekaran and Kumar in 2012 [7].
MayaZaki and Mori [16]
In 1985, MayaZaki and Mori [16], in the article entitled “COCOMO Evaluation and Tailoring”, reported the accuracy of applying COCOMO model in the study of 33 software projects. The MRE was found at 165.6%. The details of the project effort estimates and actual efforts were not shown in the report.
Kemerer [2]
In 1987, Kemerer [2], as mentioned earlier, in his paper entitled “An Empirical Validation of Software Cost Estimation Models” besides reported the accuracy of Function Point Analysis, also reported the accuracy of the COCOMO Model that performed on 15 software projects of a software company. The software were mostly business application written in COBOL ranged from 39 KSLOC to 200 KSLOC. Kemerer analyzed many COCOMO models. COCOMO Intermediate showed the least Mean Magnitude of Relative Error (MMRE). The effort estimate (person month), the actual effort (person month), and percentage MRE of the 15 software projects are shown in Table XII. The Mean Magnitude of Relative Error (MMRE) of the 15 projects was 583.82%
TABLE XII
DETALIS OF THE SOFTWARE PROJECTS FROM KEMERER [2]
No. Estimated Effort
(person month)
Actual Effort (person month)
MRE (%)
1 917.56 287.00 219.71 2 151.66 82.50 83.83 3 6,182.65 1,107.30 458.35 4 558.98 86.90 543.25 5 1,344.20 336.30 299.70 6 313.36 84.00 273.05 7 234.78 23.20 911.98 8 1,165.70 130.30 794.63 9 4,248.73 116.00 3,562.70 10 180.29 72.00 150.40 11 1,520.04 258.70 487.57 12 558.12 230.70 141.82 13 1,073.47 157.00 583.74 14 629.22 246.90 154.85 15 133.94 69.90 91.62 MMRE 583.82
Chandrasekaran and Kumar [7]
[image:4.595.304.547.210.261.2]
In 2012, Chandrasekaran and Kumar [7], in the article mentioned earlier, reported a case study applying both COCOMO model and Function Point Analysis for the software project effort estimation. Table XIII shows the effort estimate (32.66 man-month), the actual effort (30.12 man-month), and percentage MRE (8.4%) data of the case study for the COCOMO model estimation.
TABLE XIII
DETALIS OF THE SOFTWARE PROJECT FROM CHANDRASEKARAN AND KUMAR [7]
Estimated Effort (Man-Month)
Actual effort (Man-Month)
MRE (%)
32.66 30.12 8.4
[image:4.595.310.547.312.416.2]Table XIV summarized the accuracy of the four studies. The weighted average MMRE of all studies was 284.61%.
TABLE XIV
PERCENTAGE OF MMRE OF ALL THREE COCOMO STUDIES
No. Author (Year) Number
Software project
MMRE (%)
1 MayaZaki and Mori (1985)
33 165.60 2 Kemerer (1987) 15 583.82 3 Chandrasekaran and
Kumar (2012)
1 8.4 Weighted Average
MMRE
284.61
V. CONCLUSIONS,DISCUSSIONS AND FUTURE RESEARCH
There were very limited reports that satisfied the research criteria. Only 8 studies with 10 reports were found for the analysis. Table XV concluded the accuracy performance of the 10 reports presented above –3 of Function Point Analysis, 4 of Use Case Point Analysis and 3 COCOMO Model.
[image:4.595.303.555.619.767.2]Table XV illustrates that Use Case Point Analysis outperforms other models with the least weighted average Mean Magnitude of Relative Error (MMRE) of 39.11%, compare to 90.38% for Function Point Analysis and 284.61% for COCOMO model.
TABLE XV
PERCENTAGE OF WEIGHTED AVERAGE MMRE OF ALL THREE ESTIMATION MODEL
Estimation Model
Number of study
Author Weighted
Average MMRE
(%)
Function Point Analysis
3 Kemerer (1987), Arnuphaptrairong (2013), Chandrasekaran and Kumar (2012)
90.38
Use Case Point Analysis
4 Gencel et.al. (2000), Anda et.al. (2001), Caroll (2005) Frohnhoft and Engels (2008)
39.11 COCOMO
Model
3 MayaZaki and Mori (1985) Kemerer (1987)
Chandrasekaran and Kumar (2012)
Table XV shows that the MMRE of the three estimation models are still very high [17], [18]. The lowest is the Use Case Point Analysis with MMRE of 39.11%. Then the question is: what are the causes of inaccuracy of software estimates?
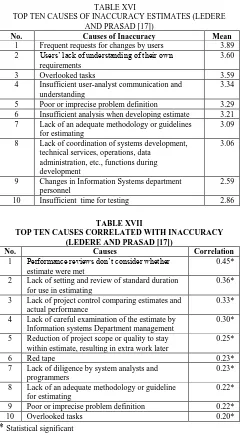
Lederer and Prasad [17] reviewed from the literature 24 causes of estimate inaccuracy. They surveyed 400 information system managers and analysts to collect their opinions on these 24 causes of inaccurate and 116 returned. The respondents were asked to rate using the 5 point Likert-scale which each was responsible for the inaccurate. Table XVI shows the top ten causes indicated by the respondents. Additional analysis was performed to find correlation between causes and inaccuracy. Table XVII shows top ten causes which statistically significant correlated with inaccuracy.
TABLE XVI
TOP TEN CAUSES OF INACCURACY ESTIMATES (LEDERE AND PRASAD [17])
No. Causesof Inaccuracy Mean
1 Frequent requests for changes by users 3.89 2 Users’ lack of understanding of their own
requirements
3.60 3 Overlooked tasks 3.59 4 Insufficient user-analyst communication and
understanding
3.34 5 Poor or imprecise problem definition 3.29 6 Insufficient analysis when developing estimate 3.21 7 Lack of an adequate methodology or guidelines
for estimating
3.09 8 Lack of coordination of systems development,
technical services, operations, data administration, etc., functions during development
3.06
9 Changes in Information Systems department personnel
2.59 10 Insufficient time for testing 2.86
TABLE XVII
TOP TEN CAUSES CORRELATED WITH INACCURACY (LEDERE AND PRASAD [17])
No. Causes Correlation
1 Performance reviews don’t consider whether estimate were met
0.45* 2 Lack of setting and review of standard duration
for use in estimating
0.36* 3 Lack of project control comparing estimates and
actual performance
0.33* 4 Lack of careful examination of the estimate by
Information systems Department management
0.30* 5 Reduction of project scope or quality to stay
within estimate, resulting in extra work later
0.25* 6 Red tape 0.23* 7 Lack of diligence by system analysts and
programmers
0.23* 8 Lack of an adequate methodology or guideline
for estimating
0.22* 9 Poor or imprecise problem definition 0.22* 10 Overlooked tasks 0.20*
* Statistical significant
Factor analysis was also performed and found that the 24 factors can be grouped into 4 groups or factors namely, --Methodology, Management control, Politics and User communication. They explained, as indicated in table XVI, that the information manager pointed to user communication factor (Users’ lack of understanding of their own
requirements, Frequent requests for changes by users, Users’ lack of data processing understanding, poor or imprecise problem definition) while as indicated in table XVII the factor that are correlated to the inaccurate are in fact the management control factor (i.e. Performance reviews do not consider whether estimates were met, Lack of project control comparing estimates and actual performance, and lack of careful examination of the estimate by Information Systems Department control). Of the observation that Use Case Point Analysis outperforms other models with the least weighted average Mean Magnitude of Relative Error (MMRE) of 39.11%, and the MMRE of the three estimation models are still very high [17], [18]. It indicates that there is still need to improve the estimation performance but the question is how to improve. One of the proposition is to incorporate the causes of software estimation inaccuracy of software estimates reviewed from [17] into the software estimation models. But again it leaves another question on how to integrate these factors into the estimation models or method for the future research.
REFERENCES
[1] T. Arnuphaptrairong, “The Development and Achievements of Software Size Measurement,” in Proceedings of the International MultiConference of Engineers and Computer Scientists 2012 (IMECS 2012), March 14-16, 2012, Hong Kong.
[2] C.F. Kemerer, “An empirical validation of software cost estimation models” Communication of the ACM, vol.30, no.5, 1987, pp.416-429. [3] R. Jeffery, M. Ruhe and I. Wieczorek, Using Public Domain Metrics to Estimate Software Development Effort, in Proceedings. Seventh International Software Metrics Symposium, 2001. METRICS 2001, p.16-27.
[4] S.D. Conte, H.E. Dunsmore, V.Y. Shen, Software Engineering Metrics and Models, The Benjamin/Cummings Publishing Company, Inc., 1986.
[5] S. Frohnhoff, and G. Engels, “Revised Use Case Point Method - Effort Estimation in Development Projects for Business,” in: Proceedings of the CONQUEST 2008 - 11th International Conference on Quality Engineering in Software Technology, Potsdam. dpunkt verlag, 2008.
[6] B. Anda, H. Dreiem, D. Sjøberg, M. Jørgensen, “Estimating software development effort based on use cases-experiences from industry,” in Fourth International Conference on the UML, 2001, pp. 487–502. [7] R. Chandrasekaran and R. V. Kumar, “On the Estimation of the
Software Effort and Schedule using Constructive Cost Model-II and Function Point Analysis,” International Journal of Computer Applications, vol.44, no.9, 2012, pp3844.
[8] T. Arnuphaptrairong, “Early Stage Software Effort Estimation Using Function Point Analysis: An Empirical Validation,” International Journal of Design, Analysis and Tools For Integrated Circuits and Systems, vol. 4, no. 1, December 2013, pp.15-21.
[9] A.J. Albretch, and J.E. Jr. Gaffney, “Software Function, Source Lines of Code, and Development Effort Prediction: A Software Science Validation,” IEEE Transaction on Software Engineering, vol. SE-9, no. 6, pp.639-648, 1983.
[10] C. Behrens, “Measuring the Productivity of Computer Systems Development Activities with Function Points,” IEEE Transaction on Software Engineering, vol. SE-9, no. 6, pp.648-652, 1983.
[11] S. Moser, and O. Nierstrasz, “The Effect of Object-Oriented Frameworks on Developer Productivity,” IEEE Computer, vol. 29, no.9, pp.45-51, 1996.
[12] C.J. Lokan, “An Empirical Analtsis of Function Point Adjustment Factors,” Information and Software Technology, vol.42, no.1, pp.649-659, 2000.
[13] K. Maxwell, and P. Forselius, “Benchmarking Software Development Productivity,” IEEE Software, January/February, pp.80-88, 2000. [14] C. Gencel, L. Buglione, O. Demirors, and P. Efe, “A Case Study on
[image:5.595.48.298.264.699.2][15] E.R. Caroll, “Estimating Software Based on Use Case Points,” in Proceeding OOPSLA '05 Companion to the 20th annual ACM SIGPLAN conference on Object-oriented programming, systems, languages, and applications, 2005, pp. 257-265.
[16] Y. MayaZaki and K. Mori, “COCOMO Evaluation and tailoring,” in Proceeding of the 8th International Conference on Software Engineering of the IEEE, 1985, pp.292-299.
[17] A. L. Lederer and J. Prasad, “Causes of Inaccurate Software Development Cost Estimates,” Journal Systems Software, vol. 31, 1995, pp.125-134.