ORIGINAL RESEARCH
Aberrant Diffusion and Geometric Properties in
the Left Arcuate Fasciculus of Developmentally
Delayed Children: A Diffusion Tensor Imaging
Study
J.-W. Jeong S.K. Sundaram A. Kumar D.C. Chugani H.T. Chugani
BACKGROUND AND PURPOSE:One of the neurologic substrates of poor language in children with DD is the abnormal development of perisylvian language networks. We sought to determine whether this manifests as aberrant regional changes in diffusivity or geometry of the left AF.
MATERIALS AND METHODS: We performed DTI studies in 16 young (age, 55.4 ⫾18.95 months)
patients with DD and 11 age- and sex-matched TD children (age, 60.09⫾21.27 months). All children were right-handed. To detect the malformation of left AF structure in native or standard space, we proposed new methodology consisting of 2 complementary approaches, principal fiber orientation quantification in color-coded anisotropic maps and tract-based morphometry analysis.
RESULTS: Patients with DD did not show the typical pattern of age-related maturity of the AP and ML pathways passing through the left AF (R2of the AP pathway: DD versus TD⫽0.002 versus 0.4542; R2of the ML pathway: DD versus TD ⫽0.002 versus 0.4154). In addition, the patients with DD showed significantly reduced FA in the temporal portion of the AF (mean FA of DD versus TD⫽0.37⫾ 0.11 versus 0.48⫾0.06,P ⬍.001), and the AF showed higher curvatures in the parietotemporal junction, resulting in sharper bends to the Wernicke area (mean curvature of DD versus TD⫽0.12⫾ 0.03 versus 0.06⫾0.02,P⬍.001).
CONCLUSIONS:The proposed methods successfully revealed regional abnormalities in the axonal integrity of the left AF in the patients with DD. These abnormalities support the notion that the perisylvian language network is malformed in children with DD.
ABBREVIATIONS:AD ⫽axial diffusivity; AF ⫽arcuate fasciculus; AP ⫽anteroposterior; CA ⫽ color-encoded anisotropy; DD ⫽ developmental delay; DTI ⫽ diffusion tensor imaging; FA⫽ fractional anisotropy; FDR⫽false discovery rate; GM⫽gray matter; H⫽hypothesis; MD⫽mean diffusivity; ML⫽mediolateral; MNI⫽Montreal Neurological Institute; RD⫽radial diffusivity; s⫽ arc-length coordinate; SI⫽superoinferior; SPM⫽Statistical Parametric Mapping; SPM-DARTEL⫽ Statistical Parametric Mapping Diffeomorphic Anatomical Registration Through Exponentiated Lie Algebra; TBM⫽tract-based morphometry; TD⫽typically developing; VBM⫽voxel-based mor-phometry; WM⫽white matter
G
lobal DD in children is characterized by significantly de-layed development inⱖ2 of the following developmental domains: gross/fine motor, speech/language, cognition, so-cial/personal skills, and activities of daily living. In particular, this is almost always accompanied by significant delay in the development of speech/language. While the neurologic sub-strate of normal speech development involves the perisylvian language networks in the left cerebral hemisphere and has been studied for more than a century, to our knowledge, the neurologic basis of speech delay has not been widely studied. An earlier preliminary DTI study on patients with DD foundthat these patients showed abnormal diffusivity changes in the centrum semiovale, corona radiata, internal capsule, corpus callosum, and subcortical WM of the frontal and parieto-oc-cipital lobes.1In a recent study of children with DD, by using
DTI we found that the major language tract in the left (dom-inant) hemisphere (ie, the AF) could not be identified in a significant proportion of the children.2This finding was even
more dramatic in Angelman syndrome, a severe developmen-tal disorder with cognitive delay, epilepsy, and virtually absent speech, because the AF could not be identified in almost every child with the disorder.3
This finding suggests that aberrant development of the AF region is a key factor in delayed speech development. More-over, the neuroradiologist who interprets the standard clinical structural MR imaging scan by visual analysis (without DTI) is unable to detect such abnormalities. While our prior studies established that the AF is abnormally formed or unidentifiable in children with DD and Angelman syndrome, these studies did not adequately characterize the abnormality along the whole length of the AF. Although our studies could not iden-tify the AF in a significant number of these children, we did not investigate the impact of regional variations in DTI
parame-Received June 17, 2010; accepted after revision July 16.
From the Carman and Ann Adams Departments of Pediatrics (J.-W.J., S.K.S., A.K., D.C.C., H.T.C.), Neurology (J.-W.J., S.K.S., A.K., H.T.C.), and Radiology (A.K., D.C.C., H.T.C.), Wayne State University School of Medicine, Detroit, Michigan; and Translational Imaging Center (J.-W.J., S.K.S., A.K., D.C.C., H.T.C.), Children’s Hospital of Michigan, Detroit, Michigan.
This work was supported by the 2-phase ARRA/NICHD grant, 1R01HD059817– 01A1.
Please address correspondence to Senthil K. Sundaram, MD, PET Center, Children’s Hospital of Michigan, 3901 Beaubien Blvd, Detroit, MI, 48201; e-mail: ssundaram@ pet.wayne.edu
Indicates open access to non-subscribers at www.ajnr.org
DOI 10.3174/ajnr.A2382
PEDIATRICS
ORIGINAL
ters along the AF pathway on the identifiability of the AF in these children.
Normal development of white matter tracts is dependent on regional concentration gradients of axon-guidance mole-cules, a process that is under genetic control.4Thus, any func-tionally significant mutations/polymorphisms in axon guid-ance pathways could result in regionally disorganized WM bundles (with abnormal DTI parameters, such as low FA, ab-normal shape or curvature, and so forth), which could mani-fest as unidentifiable/malformed tracts. The present study was designed to determine whether regional variations in DTI pa-rameters along the AF bundle exist in children with DD. We took 2 complementary approaches: 1) a region-of-interest analysis for fiber-orientation distribution that quantifies the regional distribution of the left AF directionality, and 2) TBM analysis of the left AF, which quantifies local variation in the shape of this tract along its whole length. Most important, this type of analysis allows one to evaluate the whole group of patients with DD whether the tract is identifiable or not. In addition, this analysis could demonstrate the regional abnor-malities along the course of the AF that resulted in the uniden-tifiability of the AF in our prior study.2
TBM analysis has been applied to investigate subtle alter-ations in diffusion parameters of the AF and cingulum.5This
method spatially normalizes the fibers of multiple subjects in standard space and then registers the coordinates of individual fibers to those of a group-standard fiber, followed by statistical analysis of DTI parameters only at the common coordinates of group subjects. Unlike other VBM analyses such as tract-based spatial statistics6 (www.fmrib.ox.ac.uk/fsl/tbss) and
tissue-specific smoothing-compensated voxel-based analysis,7 this
analysis uses the WM trajectory for the between-subject regis-tration, thus enabling the user to assess shape features (curva-ture) in the direction of the entire fiber bundle. We believe that the use of fiber trajectories to register the values of DTI param-eters across subjects will probably yield less registration error, which highly depends on the differences in individual mor-phology and will be more suitable for performing multiple comparisons for group analyses because the parameter values are directly sampled at anatomically equivalent locations.
Materials and Methods
Subjects
Sixteen children with the diagnosis of DD (age, 55.4⫾18.95 months; 9 males) and 11 TD children (age, 60.09⫾21.27 months; 9 males) underwent DTI and developmental-behavioral assessments. Four of the patients with DD were part of our previous study, and the AF was unidentifiable in these 4 patients.2All patients had been referred to the Children’s Hospital of Michigan Neurology Clinic. The diagnosis of DD was made by an experienced pediatric neurologist. Patients with the following conditions were excluded from the study: history of seizures, history of prematurity or a perinatal hypoxic-ischemic event, focal deficits on clinical examination by a pediatric neurologist, dysmorphic features suggestive of a clinical syndrome, structural clin-ical MR imaging interpreted as abnormal by a pediatric neuroradiolo-gist, positive findings on cytogenetic and/or fragile X tests, or the presence of an inborn error of metabolism.
All children in the study were right-handed. The group did not differ as to age (P⫽.28) or sex (P⫽.5). Written and informed
consent was obtained from 1 of the parents or legal guardians of the TD participants. The Human Investigations Committee at Wayne State University granted permission for the retrieval and analysis of the clinical data and MR imaging scans of children with DD.
Data Acquisition and Preparation
All DTI scans were obtained on a 3T Signa scanner (GE Healthcare, Milwaukee, Wisconsin) equipped with an 8-channel head coil at TR⫽1250 ms, TI⫽88.7 ms, FOV⫽240 cm, 128⫻128 acquisition matrix, contiguous 3-mm-thick sections to cover all the axial sections of the whole brain by using 6 isotropic gradient directions with
b⫽1000 s/mm2, 1b⫽0 acquisition, and NEX⫽6 to increase the signal intensity–to-noise ratio and to reduce the artifacts. Approxi-mate scanning time for the DTI acquisition was 9 minutes by using a double refocusing pulse sequence to reduce eddy current artifacts. An array spatial sensitivity encoding technique was also applied to further reduce the geometric distortion due to the sequence design.
To secure uniform quality of DTI data across the subjects, we corrected theb⫽1000 s/mm2images for eddy current distortion and any potential movement during the DTI acquisition. We used the Functional MR Imaging of the Brain Software Library module for this correction (Oxford Centre for Functional Magnetic Resonance Imag-ing of the Brain Software Library; http://www.fmrib.ox.ac.uk/fsl/fdt). The correction relies on a 12-parameter affine transformation.
Data Analysis
This study presents sequential modules to identify significant tions of DTI features between the TD and DD groups. These varia-tions were systematically assessed in 2 distinct spaces: the subject’s native head space (x,y,z) and standard MNI space (u,v,w). The meth-odology was implemented by the following 4 modules.
Estimation of DTI Parameters
Spatial maps of diffusion tensors at every voxel of native space were evaluated by using an in-house–implemented software incorporating a signal intensity–to-noise-ratio-weighed multivariate least squares fitting approach.7On the basis of the first eigenvector (v
1) and 3 eigenvalues (1,2,3) of the diffusion tensor matrix, we recon-structed diffusion parameter maps, including FA [3⫻variance of (1,2,3) / (12⫹22⫹32)]1/2, a CA map [scaled-(v
1x,v1y,v1z)], MD [(1⫹2⫹2) / 3], AD (AD⫽1), and RD [(2⫹3) / 2] at every voxel of native space.8,9The Frenet equation10was applied to measure the scale-free fiber curvature—that is, for a given fiber, its curvature was measured by the absolute magnitude of the first derivative of the tangent vector at the individual spatial coordinate.
Spatial Normalization of B0 image by Using SPM-DARTEL
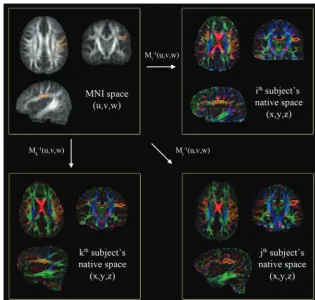
To enable group analysis of DTI parameters across the subjects, we first aligned DTI parameter maps of individual subjects in standard space via a nonlinear deformation field that spatially normalized a B0 image of the individual subject to a pediatric MNI B0 template. For this alignment, we used the SPM-DARTEL approach.11,12
repre-sentative TD subject, resulting in a nonlinear field to register the vox-els of native space to those of the TD population space. The Mi(x,y,z) is finally determined by a composite of the nonlinear field and an affine transformation between the GM coordinates of the TD space and those of the pediatric MNI space.13We repeated the above pro-cedure to obtain the Mi(x,y,z) for all subjects in both groups. Result-ing Mi(x,y,z) and its inverse, Mi⫺1(x,y,z) were directly applied to de-fine spatial transformation of DTI parameter maps, whole-brain tractography, and regions of interest between the MNI space and native subject space.
Region-Based Quantification Analysis
The direction of individual fibers in DTI data can be imaged by CA maps,14in which 3 components of the eigenvector v
1in association with the largest eigenvalue1are color-coded by using an RGB-color model, which is symmetric with respect to all color axes. The color axes are aligned with the patient coordinate system (green, AP; red, ⫽ML; blue, SI). As a direct metric to quantify a measure of directional fiber volume in the AF fibers, we summed up AP components (v1y, green component of the color-coded map) and ML components (v1x, red component of the color-coded map) at the CA voxels of the AF region.
The quantification of the directionality at a specific region for the group comparison can be achieved by 2 different methods: 1) to man-ually delineate the same region of interest on the CA map that was acquired in subject’s native space,2,15and 2) to normalize the tensor data of each subject to those of the MNI template space, reorient the tensor field according to the local transformation matrix, and
calcu-late the MNI-CA map from reoriented tensors.16-18The first ap-proach is performed in the subject’s native space, which is straight-forward, but its reproducibility is limited.19It requires reproducible protocols and operator experience to secure inter-rater variability. The second approach is studied in template space, which is more efficient to evaluate a large amount of data in a systematic manner but adds uncertainty in the analysis because it needs nonlinear warping of the tensor field and artificial manipulation of the tensor measure-ment.16,20More important, it typically requires a time-consuming computational process to achieve reasonable accuracy in tensor normalization.18
Figure 1 shows a hybrid approach that represents a compromise of the above 2 approaches. It defines a transaxial region of interest in the left AF region in the MNI space (orange contours of the top left panel of Fig 1). This region of interest is manually delineated on the MNI FA map (gray-scaled images) and then transformed via the Mi⫺1(x,y,z) to the individual subject’s head space (color maps). The inversely normalized region of interest (orange contours on each color map) is overlapped on the subject’s CA maps to assess the total number of AP and ML components in the left AF region.
Because the Mi⫺1(x,y,z) allows a free deformation to match the regions of template space to those of the ithsubject’s space, the size and location of the normalized region of interest can be extended or contracted depending on the size and structure of the ithsubject’s brain. Thus, the total number of AP and ML components inside the normalized region of interest provides a direct measure of the AF fiber connection existing in AP and ML directions, which do not depend on any experimental variability. We evaluated this metric for all
sub-Fig 1.Automatic quantification of a CA map in the left AF region of native space. A single region of interest to enclose core voxels of the left AF (orange contour of the top left panel)
is manually delineated on the MNI FA template (gray-scaled image in the top left panel). This region of interest is then transferred to individual CA maps (colored images) via the corresponding Mi⫺
1
[image:3.594.136.451.41.341.2]jects in both TD and DD groups. A 2-samplettest with equal variance corrected for multiple comparisons was used to examine the group difference.
TBM Analysis
The TBM analysis was recently reported to provide a new way to observe the local transition of DTI parameters along bilateral AF fi-bers of healthy adults,5where subtle differences of major eigenvalues existing in left and right AF fibers were clearly detected. This could not be found by conventional full-path analysis (ie, averaging of the pa-rameter values existing in entire tracts). This analysis registers an in-dividual subject’s AF fibers to a standard fiber called a “prototype.” The coordinates of individual fibers are spatially matched to corre-sponding coordinates of prototypes called “common arc-length co-ordinates.” At each arc-length coordinate, the DTI parameter is cal-culated in each subject and the group difference is examined.
To construct left AF group fibers for the TBM analysis, we con-ducted whole-brain tractography per subject of each group by using conventional streamline tractography based on the Runge-Kutta or-der 2 interpolation at FA⬎0.20, angular deflection⬍60°, and step size⫽0.2 mm. The coordinates of the resulting tracts were trans-formed to the MNI space via Mi(x,y,z) to be registered across subjects. Two binary regions of interest (inferior frontal and middle temporal) of the anatomical automatic labeling map21(www.cyceron.fr/web/ aal) were applied to isolate the left AF fiber bundle of each group.
To assure the consistency of individual fibers in the AF group bundle, we computed a group consistency map by summing up the number of fibers penetrating individual voxels in standard space. The voxels that the fibers passed through in at least half of the subjects of
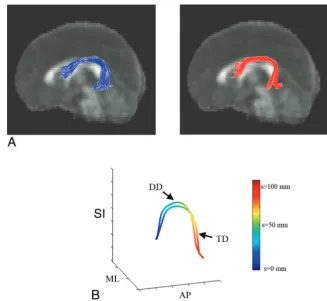
each group were assumed to represent a “consistent pathway.” The fibers existing inside the consistent pathway were subsequently con-sidered for the analysis. The longest fiber penetrating the highest at-tenuation region in the TD group was selected as the prototype. Fig-ure 2Ashows the group bundle of the left AF obtained from both groups. The prototype of each group bundle is shown in Fig 2B. The common arc-length coordinates for each group were placed every 2-mm arc-length along each prototype as color-coded in Fig 2B.
In this study, we used the arc-length coordinates of the TD proto-type for the group comparison—that is, at each arc-length coordinate of the TD prototype, its corresponding coordinate of individual fiber in both groups was identified by an optimal point-match method based on the Hungarian matching algorithm.5The parameter values of both groups at these matched coordinates were pooled together and then examined by a 2-samplettest under 2 different contrasts (TD⬎DD and TD⬍DD), which were controlled for age. The FDR
Pvalue22was considered for multiple comparisons. Variations in dif-fusion parameters (FA, MD, AD, and RD) and the geometric param-eter (curvature) were examined along all arc-length coordinates (FDR-correctedPvalue⬎.05).
Results
Region-Based Quantification Analysis
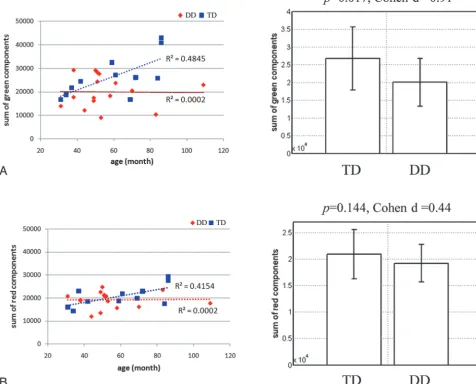
Figure 3 presents the results of region-based quantification of the AP (green) component and the ML (red) component in the CA map, plotted against the subject’s age in the TD and DD groups. There is an age-dependent increase in the AP and ML components in the TD group (R2⫽0.4542 and 0.4154,
Fig 2.Preparation of TBM analysis.A, Input multisubject fiber bundles of the AF: left TD (blue) and right DD (red).B, Prototype fibers obtained from the TD and DD bundles and their
[image:4.594.129.457.40.341.2]respectively). However, we could not identify an age-depen-dent increase in both components in the DD group (R2⫽
[image:5.594.56.533.55.439.2]0.0002 and 0.0002, respectively). The AP component was sig-nificantly decreased in the DD group (Pvalue ⫽.017 and effect size [Cohen d]⫽0.91). Meanwhile the decrease of the ML component was not significant (P⫽.144 and effect size [Cohen d]⫽0.44 for the ML component). Also to access the reliability of this analysis, 5 experienced neuroradiologists de-marcated separate regions of interest in the MNI space. The interdrawer reliability was tested by calculating the Pearson correlation of the AP and ML components obtained from dif-ferent drawers. The average and SD of correlation coefficients were 0.94 (0.05) and 0.87 (0.15) for the AP and ML compo-nents, respectively.
DTI Metric along the Entire AF Tract Bundle
The mean and SD of the FA, MD, AD, RD, and curvature along all the fiber bundles of both groups were measured be-fore the TBM analysis. The FA was significantly lower in the DD group (0.37⫾0.06 for TD and 0.31⫾0.05 for DD,P⫽
.02). Meanwhile other diffusivity parameters were higher in the DD group (MD: 7.95⫾0.77⫻10⫺4mm/s2for TD and
8.68⫾0.14⫻10⫺4mm/s2for DD; AD: 11⫾0.91⫻10⫺4
mm/s2for TD and 12⫾2.10⫻10⫺4 mm/s2for DD; RD:
6.31⫾0.84⫻10⫺4mm/s2for TD and 7.22⫾1.15⫻10⫺4 mm/s2for DD), consistent with those in our previous study.23
Similar curvature was observed in both groups (0.07⫾0.03 for TD and 0.07⫾0.04 for DD). Only RD showed a significant increase in the DD group (P⫽.05). No significant differences were found in MD, AD, and curvature obtained from the en-tire tract (P ⫽ .15 for MD, P ⫽ .61 for AD, P ⫽ 1 for curvature).
TBM Analysis
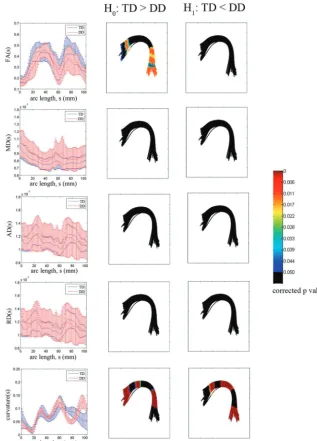
The results of all TBM analyses along the TD prototype of the left AF group bundle are presented in Fig 4. For each arc-length coordinate of the TD prototype, each subject’s mean of the DTI parameters was computed from all fibers belonging to the group bundle. The group mean and SD of the individual subject’s means were plotted against arc-length coordinates in millimeters (left column of Fig 4). The statistical group differ-ences in FA, MD, AD, RD, and curvature are shown in the middle and right columns (middle column for TD⬎DD and right column for TD⬍DD). The color bar indicates the
FDR-Fig 3.Results of region-based-quantification analysis.A, Sum of the AP component.B, Sum of the ML component. For both groups, 2 metrics are correlated with the age of the individual
subject in terms of the linear regression coefficient,R2
correctedPvalues. The multiple comparison FDR-correctedP
value was color-coded on the surface of the DD group fiber bundle. Note that black is used to indicate the locations show-ing no significant group difference between the 2 groups (cor-rectedPvalue⬍.05).
Compared with the group difference obtained from full-path analysis, the TBM analysis identified focal regions show-ing a significant difference even after correction for multiple comparisons. There was significantly decreased FA in 2 spe-cific regions of the left AF—Broca area in the frontal lobe and Wernicke area in the temporal lobe (see TBM image in the middle of the first row). No significant difference was found in MD, AD, or RD at all arc-length coordinates (second, third, and fourth rows of Fig 4). The curvature TBM analysis cap-tured a large amount of the shape variation between the 2 groups. Figure 4 (fifth row) shows that this variation is not
concentrated in 1 specific region but at multiple segments. The TD group showed higher curvatures in both language areas. The DD group produced higher curvatures in the region con-necting both language areas (left parietal). The Table lists the MNI coordinates showing significant curvature differences in both groups.
The sensitivity of overall TBM results to the selection of the prototype was studied by defining common coordinates on the prototype fiber of the DD group and repeating the same TBM analysis as we did for Fig 4. We observed a very similar localization in all cases, indicating that the obtained TBM lo-calization was independent of the selection of the prototype.
Discussion
This study found regional changes in FA and curvature of the left AF in children with DD, particularly involving the left
Fig 4.TBM group analysis of the left AF bundle by using a TD prototype fiber. For each arc-length coordinate (in millimeters), each subject’s mean FA, MD, AD, RD, and curvature values
[image:6.594.133.450.42.483.2]inferior frontal and middle temporal regions of the tract. In addition, the children with DD did not display the typical pat-tern of age-related maturity of AP and ML pathways passing through the left arcuate region. This lack of age-related matu-rity was particularly striking in the AP pathways that corre-spond to the left AF.
Characterization of AF Abnormality
As mentioned previously, the classic AF fibers were unidenti-fiable in a significant fraction of children with DD in our prior study.2The same finding was observed even more
dramati-cally in children with Angelman syndrome in whom the AF was unidentifiable in 6 of 7 subjects and barely identifiable in the remaining subject.3These findings suggest the importance
of normal development of the AF for speech/language devel-opment. The AF may not be identifiable in DTI studies due to several reasons: agenesis, excessive pruning, poor myelination, or an aberrant course of the AF due to regional abnormalities along the AF path resulting from genetic abnormalities in mo-lecular pathways involved in axonal guidance or scarring from brain injury blocking axonal growth.
Agenesis of large WM pathways is well-known for the cor-pus callosum, and genetic abnormalities in midline pattern-ing, birth, and specification of commissural neurons and axon guidance have all been implicated in callosal agenesis.24 Ge-netic abnormalities of axon-guidance pathways are major mechanisms underlying the abnormal development of WM tracts. Even though there are no animal/human studies that demonstrate the abnormalities in the axon-guidance mecha-nisms of the AF, specific axon guidance molecules that control the development of other tracts such as the corticospinal tract,25midbrain dopaminergic axons,26sensory axons,27
ol-factory pathway,28and ocular pathway29are increasingly be-ing identified. While the degree of specificity of axon-guidance molecules that control WM development is not fully known, involvement of specific molecules such asSemaphorin-6A25
(corticospinal tract),fzd3/fzd626(midbrain dopaminergic ax-ons),Cadherin Wernicke area27 (sensory axons), the Wnt
family of proteins28(olfactory pathway), andFzd529(ocular
pathway) identified in these studies suggests that relatively specific mechanisms control the development of different WM pathways. This finding suggests that specific molecular mechanisms may be operative that could also disrupt the nor-mal development of the AF. Similarly, DTI studies in
knock-out mice that disrupt axon guidance molecules show the lack of development of major pathways.30 For example, Fz-3
-/-knockout mice studies show an absence or severe reduction in the size of major axon tracts in the developing forebrain and a failure of sensory axons in the spinal cord to grow rostrally after crossing the midline.30
Similarly, any abnormality in the neurons at the origin or termination of the AF could result in the abnormal develop-ment of this tract. A microarray study to evaluate perisylvian cortical patterning identified several genes that are differen-tially expressed (25 upregulated and 147 downregulated) in the superior temporal gyrus relative to whole cerebral cor-tex.31Most of the upregulated genes encode transcription fac-tors, while the downregulated genes were predominantly in-volved in neurite outgrowth and axon path finding. This study further confirmed the importance of axon-guidance abnor-malities in the proper development of the perisylvian path-ways such as the AF. Most interesting, this study also revealed thatCNTNAP2was consistently expressed at higher levels in the middle and inferior frontal cortex compared with other cortical regions. TheCNTNAP2gene is implicated in autism spectrum disorder32,33and is regulated byFOXP2.34An
auto-somal dominant mutation in theFOXP2gene has been found to be associated with developmental verbal dyspraxia during the investigation of 3 generations of the KE family.35Thus, abnormalities in the larger gene-regulation network in which
FOXP2-CNTNAP2 interaction occurs may be a common mechanism behind language disorders.33While the entire
ge-netic network responsible for language and AF development has not yet been fully determined, these studies demonstrate key individual components of the network and their interac-tion patterns. Further studies to identify the determinants of unidentifiable AF will clarify this issue.
Methodologic Issues and Limitations
Most DTI-VBM analyses for the identification of regional ab-normality in WM have been implemented by using sophisti-cated spatial normalization. An important strength of the pro-posed TBM analysis is that it performs tractwise statistical comparisons based on tract normalization across subjects (not based on scalar map normalization). In the present study, tract normalization was secured in 2 different aspects: 1) Whole-brain tractography of individual subjects was spatially regis-tered across subjects by aligning brain maps to those of the template (SPM-DARETL normalization), and 2) normalized tracts of interest were reregistered across subjects by aligning them to the prototype.
We presume that these 2-step registrations yield a more efficient way to identify subtle group differences by perform-ing statistical comparisons at anatomically equivalent loca-tions across the subjects or groups. Although the accuracy of the SPM-DARTEL was successfully validated in a recent re-gion-of-interest– based VBM study,36this normalization can-not guarantee perfect registration of all the fiber bundles over whole brain. In fact, the deformation was quite accurate at deep WM structures such as major association tracts but was not as accurate in subcortical peripheral WM regions. To overcome this limitation, future studies will incorporate more sophisticated schemes of spatial normalization using atlas-landmark-based multichannel deformation algorithms.
An-Table: MNI coordinates of fiber regions showing significant group difference in curvaturea
Group
Curvature
(mean⫾SD)
MNI Coordinate (mm)
x y z
TD 0.0720 (0.0150) ⫺35.84 ⫺31.95 27.86
DD 0.0932 (0.0142)
TD 0.0565 (0.0247) ⫺49.68 ⫺49.84 ⫺2.19
DD 0.1247 (0.0258)
TD 0.0808 (0.0165) ⫺41.76 ⫺11.11 25.54
DD 0.0874 (0.0107)
TD 0.0538 (0.0305) ⫺58.46 4.53 11.87
DD 0.0341 (0.0111)
TD 0.0882 (0.0171) ⫺39.27 ⫺50.70 9.89
DD 0.0500 (0.0089)
other limitation of the present study is the lack of quantitative neuropsychological data along different developmental do-mains. This limits our ability to perform correlations between DTI variables and developmental status or outcomes.
The current TBM analysis could not overcome partial vol-ume effects of multiple tissue composites and fiber-crossings at single voxels because it performs statistical analysis on the basis of group bundles that were obtained by deterministic tractography. FA and curvature measured by using this meth-odology are also affected by these 2 factors. Thus, it is possible that they may be affected by anatomic differences of both groups and also differences in nearby or crossing tracts. None-theless, the TBM analysis for patients with DD is truly valuable because it provides a unique tool that can identify specific regions of the AF fibers showing aberrant variations in geom-etry. This cannot be detected by full-path analysis or other VBM approaches.
Conclusions
The present study demonstrated decreased regional anisot-ropy and sharper curvature of the left AF in children with DD in the inferior frontal and middle temporal regions. Children with DD also do not show the typical age-related maturational changes of the left AF. These findings are likely to be due to regional abnormalities in the axonal integrity of the left AF, thus providing new insights into abnormal development of the left AF in children with DD.
References
1. Filippi CG, Lin DDM, Tsiouris AJ, et al.Diffusion-tensor MR imaging in chil-dren with developmental delay: preliminary findings. Radiology
2003;229:44 –50
2. Sundaram S, Sivaswamy L, Makki M, et al.Absence of arcuate fasciculus in children with global developmental delay of unknown etiology: a diffusion tensor imaging.J Pediatr2008;152:250 –55
3. Wilson BJ, Sundaram SK, Hug AH, et al.Abnormal language pathway in chil-dren with Angelman syndrome: a diffusion tensor imaging (DTI) study.Ann Neurol2009;66:S109 – 09
4. Yamamoto N, Tamada A, Murakami F.Wiring of the brain by a range of guid-ance cues.Prog Neurobiol2002;68:393– 407
5. O’Donnell LJ, Westin CF, Golby AJ.Tract-based morphometry for white mat-ter group analysis.Neuroimage2009;45:832– 44
6. Smith SM, Jenkinson M, Johansen-Berg H, et al.Tract-based spatial statistics: voxelwise analysis of multi-subject diffusion data. Neuroimage
2006;31:1487–505
7. Lee JE, Bigler ED, Alexander AL, et al.Diffusion tensor imaging of white matter in the superior temporal gyrus and temporal stem in autism.Neurosci Lett
2007;7:127–32
8. Basser PJ, Mattielo J, Le Bihan D.MR diffusion tensor spectrography and imaging.Biophys J1994:66:259 – 67
9. Basser PJ, Pierpaoli C.Microstructural and physiological features of tissues elucidated by quantitative-diffusion-tensor MRI. J Magn Reson B
1996;111:209 –19
10. Batchelor PG, Calamante F, Tournier JD, et al.Quantification of the shape of fiber tracts.Magn Res Med2006;55:894 –903
11. Ashburner J.A fast diffeomorphic image registration algorithm.Neuroimage
2007;38:95–113. Epub 2007 Jul 18
12. Kelin J, Andersson BA, Ardekani J, et al.Evaluation of 14 nonlinear
deforma-tion algorithms applied to human brain MRI registradeforma-tion.Neuroimage
2009;46:786 – 802
13. Wilke M, Schmithorst VJ, Holland SK.Assessment of spatial normalization of whole-brain magnetic resonance images in children. Hum Brain Mapp
2002;17:48 – 60
14. Brun A, Park HJ, Knuttsson H, et al.Coloring of DT-MRI fiber traces using Laplacian eigenmaps.In:Diaz RM, Arencibia AQ (eds).Computer Aided Sys-tems Theory (EUROCAST ’03), Lecture Notes in Computer Science 2809.Las Pal-mas de Gran Canaria, Spain: Springer Verlag, 2003;564 –72
15. Yuan W, Holland SK, Schmithorst VJ, et al.Diffusion tensor MR imaging re-veals persistent white matter alternation after traumatic brain injury experi-enced during early childhood.AJNR Am J Neuroradiol2007;28:1919 –25 16. Alexander DC, Pierpaoli C, Basser PJ, et al.Spatial transformations of diffusion
tensor magnetic resonance images.IEEE Trans Med Imaging2001;20:1131–39 17. Xu D, Mori S, Shen D, et al.Spatial normalization of diffusion tensor fields.
Magn Reson Med2003;50:175– 82
18. Zhang W, Li X, Zhang J, et al.Landmark-reference voxel-based analysis of diffusion tensor images of the brain stem white matter tracts application in patients with middle cerebral artery stroke.Neuroimage2009;44:906 –13 19. Li H, Xu Z, Guo L, et al.A hybrid approach to automatic clustering of white
matter fibers.Neuroimage2010;49:1249 –58
20. Ruiz-Alzola J, Westin CF, Warfield SK, et al.Nonrigid registration of 3D scalar vector and tensor medical data.Med Image Anal2002;6:143– 61
21. Tzourio-Mazoyer N, Landeau B, Papathanassiou D, et al.Automated anatom-ical labeling of activations in SPM using a macroscopic anatomanatom-ical parcella-tion of the MNI MRI single-subject brain.Neuroimage2002;15:273– 89 22. Yekutieli D, Benjamini Y.Resampling-based false discovery rate controlling
multiple test procedure.J Statist Plann Inference1999;82:171–96
23. Kumar A, Sundaram SK, Sivaswamy L, et al.Alternations in frontal lobe tracts and corpus callosum in young children with autism spectrum disorder.Cereb Cortex2010;20:2103–13. Epub 2009 Dec 17
24. Paul LK, Brown WS, Adolphs R, et al.Agenesis of the corpus callosum: genetic, developmental and functional aspects of connectivity.Nat Rev Neurosci
2007;8:287–99
25. Ru¨enker AE, Little GE, Suto F, et al.Semaphorin-6A controls guidance of cor-ticospinal tract axons at multiple choice points.Neural Dev2008;3:34 26. Stuebner S, Faus-Kessler T, Fischer T, et al.Fzd3 and Fzd6 deficiency results in
a severe midbrain morphogenesis defect.Dev Dyn2010;239:246 – 60 27. Steinel MC, Whitington PM.The atypical cadherin Flamingo is required for
sensory axon advance beyond intermediate target cells.Dev Biol2009;327: 447–57. Epub 2008 Dec 30
28. Rodriguez-Gil DJ, Greer CA.Wnt/Frizzled family members mediate olfactory sensory neuron axon extension.J Comp Neurol2008;511:301–17
29. Lie C, Nathans J.An essential role for frizzled 5 in mammalian ocular devel-opment.Development2008;135:3567–76. Epub 2008 Oct 2
30. Wang Y, Zhang J, Mori S, et al.Axonal growth and guidance defects in Friz-zled3 knock-out mice: a comparison of diffusion tensor magnetic resonance imaging, neurofilament staining, and genetically directed cell labeling.J Neu-rosci.2006;26:355– 64
31. Abrahams BS, Tentler D, Perederiy JV, et al.Genome-wide analyses of human perisylvian cerebral cortical patterning.Proc Natl Acad Sci U S A2007;104: 17849 –54. Epub 2007 Oct 31
32. Alarco´n M, Abrahams BS, Stone JL, et al.Linkage, association, and gene-ex-pression analyses identify CNTNAP2 as an autism-susceptibility gene.Am J Hum Genet2008;82:150 –59
33. Poot M, Beyer V, Schwaab I, et al.Disruption of CNTNAP2 and additional structural genome changes in a boy with speech delay and autism spectrum disorder.Neurogenetics2010;11:81– 89
34. Vernes SC, Newbury DF, Abrahams BS, et al.A functional genetic link between distinct developmental language disorders. N Engl J Med
2008;359:2337– 45
35. Vargha-Khadem F, Gadian DG, Copp A, et al.FOXP2 and the neuroanatomy of speech and language.Nat Rev Neurosci2005;6:131–38
36. Bergouignan L, Chupin M, Czechowska Y, et al.Can voxel-based mor-phometry, manual segmentation and automated segmentation equally de-tect hippocampal volume differences in acute depression.Neuroimage