ORIGINAL RESEARCH
SPINE
Evaluation of Focal Cervical Spinal Cord Lesions in Multiple
Sclerosis: Comparison of White Matter–Suppressed T1
Inversion Recovery Sequence versus Conventional STIR and
Proton Density–Weighted Turbo Spin-Echo Sequences
XD.K. Sundarakumar, XC.M. Smith, XW.D. Hwang, XM. Mossa-Basha, andXK.R. Maravilla
ABSTRACT
BACKGROUND AND PURPOSE: Conventional MR imaging of the cervical spinal cord in MS is challenged by numerous artifacts and interreader variability in lesion counts. This study compares the relatively novel WM-suppressed T1 inversion recovery sequence with STIR and proton density–weighted TSE sequences in the evaluation of cervical cord lesions in patients with MS.
MATERIALS AND METHODS: Retrospective blinded analysis of cervical cord MR imaging examinations of 50 patients with MS was performed by 2 neuroradiologists. In each patient, the number of focal lesions and overall lesion conspicuity were measured in the STIR/proton density–weighted TSE and WM-suppressed T1 inversion recovery sequence groups. Independent side-by-side comparison was performed to categorize the discrepant lesions as either “definite” or “spurious.” Lesion contrast ratio and edge sharpness were independently calculated in each sequence.
RESULTS:Substantial interreader agreement was noted on the WM-suppressed T1 inversion recovery sequence (⫽0.82) compared with STIR/proton density–weighted TSE (⫽0.52). Average lesion conspicuity was better on the WM-suppressed T1 inversion recovery sequence (conspicuity of 3.1/5.0 versus 3.7/5.0,P⬍.01, in the WM-suppressed T1 inversion recovery sequence versus STIR/proton density–weighted TSE, respectively). Spurious lesions were more common on STIR/proton density–weighted TSE than on the WM-suppressed T1 inversion recovery sequence (23 and 30 versus 3 and 4 by readers 1 and 2, respectively;P⬍.01). More “definite” lesions were missed on STIR/proton density–weighted TSE compared with the WM-suppressed T1 inversion recovery sequence (37 and 38 versus 3 and 6 by readers 1 and 2, respectively). Lesion contrast ratio and edge sharpness were highest on the WM-suppressed T1 inversion recovery sequence.
CONCLUSIONS: There is better interreader consistency in the lesion count on the WM-suppressed T1 inversion recovery sequence compared with STIR/proton density–weighted TSE sequences. The focal cord lesions are visualized with better conspicuity due to better contrast ratio and edge sharpness. There are fewer spurious lesions on the WM-suppressed T1 inversion recovery sequence compared with STIR/proton density–weighted TSE. The WM-suppressed T1 inversion recovery sequence could potentially be substituted for either STIR or proton density–weighted TSE sequences in routine clinical protocols.
ABBREVIATIONS:LES⫽lesion edge sharpness; PDWTSE⫽proton density–weighted TSE; WMS⫽WM-suppressed T1 inversion recovery
T
he cervical spinal cord is commonly affected in multiple scle-rosis, which is often associated with an increase in clinical disability.1-3A focal form of involvement is more common in the relapsing-remitting variant of MS compared with the other less common MS subtypes.4MS lesions undergo complex cycles of inflammation, followed by variable extent of repair and,there-fore, have heterogeneity in the prolongation of T1 and T2 relax-ation times, which influence their conspicuity on the standard MR imaging sequences such as STIR and proton density– weighted TSE (PDWTSE).
The PDWTSE sequence with a lower TE is better than the longer TE T2-weighted sequences in the detection of focal MS lesions in the spinal cord.5,6STIR has intrinsic sensitivity to T1 shortening effects in addition to T2 prolongation effects and im-proves the lesion contrast compared with T2-weighted sequences, translating to a better interreader agreement in the assessment of the extent of disease.7Nevertheless, artifacts and lower lesion con-spicuity prevalent on these sequences may cause variability in the clinical evaluation of lesion burden, which is difficult to resolve in the absence of a true reference standard.8Reliable
characteriza-Received October 1, 2015; accepted after revision February 2, 2016.
From the Department of Radiology, University of Washington, Seattle, Washington.
Please address correspondence to Dinesh K. Sundarakumar, MD, Department of Radiology, University of Washington Medical Center, 1959 NE Pacific St, BB308, Seattle, WA 98195; e-mail: [email protected]
tion of the lesion burden on follow-up examinations is therefore important for assessing treatment efficacy and optimizing treat-ment strategies.
Many novel sequences have been devised attempting to im-prove imaging quality and lesion conspicuity with fewer artifacts and with a reasonable acquisition time. In a smaller study popu-lation, the WM-suppressed T1 inversion recovery (WMS) se-quence has shown improvement in lesion conspicuity over STIR and dual-echo fast spin-echo.9While the principles of the con-trast mechanism on WMS are similar to those on STIR, the se-quence parameters of WMS are optimized for better intramedul-lary imaging. In WMS, the section-selective inversion pulse is applied at 385 ms to suppress the background signal from white matter, whereas in STIR, it is applied at 160 ms to optimize fat suppression.10A shorter TE is used in WMS compared with STIR or PDWTSE, which further increases the T1-weighting of the se-quence, which acts as the main contrast mechanism in this long TR/short TE sequence.11,12MS lesions have increased T1 relax-ation times and thus are not suppressed with a white matter se-lective inversion recovery suppression pulse. There is a need for larger scale evaluation of WMS for clinical utility in routine prac-tice against the standard sequences (STIR and PDWTSE) in the detection of MS cord lesions. The purpose of this retrospective study was to compare the utility of WMS compared with routinely used STIR and PDWTSE sequences in the evaluation of focal cer-vical cord lesions is MS.
MATERIALS AND METHODS
SubjectsThis retrospective study was approved by the institutional review board and was conducted in compliance with the Health Insur-ance Portability and Accountability Act. Following earlier imple-mentation of the WMS sequence, cervical spinal cord MR imag-ing examinations of 50 consecutive patients with multiple sclerosis (14 men and 36 women; average age, 43.1 years; range, 19 – 64 years; median age, 43.5 years; disease duration range, 3–20 years; Expanded Disability Status Scale range, 1.0 –5.5) with known or suspected involvement of the spinal cord, scanned be-tween August 2013 and June 2014, were retrospectively reviewed. There were 40 relapsing-remitting, 5 primary-progressive, and 5 secondary-progressive subtypes of MS in the study population. These patients were being treated by using various regimens, in-cluding immunomodulatory therapy, as clinically appropriate.
MR Image Acquisition
The images were acquired on a 3T MR imaging scanner (Ingenia; Philips Healthcare, Best, the Netherlands), by using an integrated head and neck coil (18-channel maximum). Sagittal STIR (TR/ TE/TI, 2700/50/250 ms; FOV, 250 mm; echo-train length, 15; NEX, 1), sagittal PDWTSE (TR/TE, 2700/45 ms; FOV, 250 mm; echo-train length, 15; NEX, 1), and axial PDWTSE (TR/TE, 2700/45 ms; FOV, 140 mm; echo-train length, 15; NEX, 1) se-quences were compared with sagittal WMS (TR/TE/TI, 3600/11/ 385 ms; FOV, 240 mm; echo-train length, 8; NEX, 2) and axial WMS (TR/TE/TI, 3600/11/380 ms; FOV, 250 mm; echo-train length, 19; NEX, 1), acquired in the same corresponding geomet-ric planes. The TIs and TEs in WMS were chosen from a pilot trial
performed by us (data not presented here). The sagittal images were acquired with a section thickness of 3 mm; and axial images, with 5-mm thickness with a 10% intersection gap. The in-plane acquired pixel size was 0.89⫻0.89 mm for sagittal STIR and sagittal PDWTSE sequences, and it was 0.54⫻0.61 mm for the axial PDWTSE sequences. The in-plane acquired pixel sizes for sagittal and axial WMS sequences were 0.68⫻ 0.95 mm and 0.69⫻0.92 mm, respectively. The average combined scan time for both sagittal and axial WMS imaging was 7 minutes 30 sec-onds. WMS images were reconstructed in both magnitude and phase-sensitive modes. On magnitude reconstruction, there is the possibility of suppressing signal from lesions having a null point very close to that of normal white matter. Phase-sensitive reconstruction overcomes this “blind-spot” by using the directional information of the longitudinal magnetization, thereby improving the dynamic range of contrast near the TI.5To maintain uniformity between im-aging sequences, we used only the magnitude images for analysis and statistical comparison. Postcontrast sagittal and axial imaging was performed after IV injection of 0.1 mL/kg of gadoteridol (ProHance; Bracco Diagnostics, Princeton, New Jersey).
Image Analysis
The image series of the patients were segregated and randomized with the conventional sequences (sagittal STIR/sagittal PDWTSE/ axial PDWTSE) in 1 anonymized folder, and the WMS sequences (sagittal WMS/axial WMS), in a separate folder. The 2 image groups were independently examined by 2 blinded fellowship-trained neuroradiologists having 3 and 7 years’ experience, re-spectively. The axial images were cross-referenced to the sagittal sequences in each group. The cervical spine was arbitrarily di-vided into 2 levels: C1–C4 and C5–C7. The lesion count and the overall lesion conspicuity were reported for the 2 cervical levels in each sequence group. We decided to divide the cervical spine into upper and lower levels during evaluation due to imaging hetero-geneity between these 2 regions that arises from field inhomoge-neity artifacts and dielectric effects. These factors affect the image quality of the lower cervical region more than the upper region, due to increased body thickness at the shoulders, which can po-tentially confound evaluation.13Thus, we thought that separate comparison of upper and lower cervical lesions would be a more accurate assessment. This separation also allowed minimizing variation of measurements by limiting the region of cord being evaluated at one time. To assess the overall burden of focal abnor-malities, we initially asked the readers to count all visualized focal abnormalities, including those later determined to be spurious. Overall conspicuity for focal findings in each cervical level was then graded on the following scale: 1, image quality was nondiag-nostic; 2,⬎50% of lesions were uncertain; 3, 25%–50% of lesions were uncertain; 4,⬍25% of lesions were uncertain; and 5, all the lesions were well-visualized and certain.
were resolved by consensus. Then, within the STIR/PDWTSE group, each reader was asked the following question: On which sagittal sequence—STIR (A), PDWTSE (B), or similar on both (A⫽B)—were the lesions better visualized?
Quantitative contrast (lesion-to-cord) ratios for 82 selected focal lesions, visualized in all 3 sagittal sequences (up to 4 lesions in each patient), were calculated by D.K.S. by using following formula:
Contrast RatioLesion⫽
(Signal Lesion⫺Signal Normal Cord) Signal Normal Cord .
The lesion edge sharpness (LES) of 25 selected lesions (measuring ⱖ1 cm, up to 1 lesion per patient) was measured on the sagittal STIR, WMS, and PDWTSE sequences by D.K.S. A line was drawn along the length of these lesions and was extended slightly to in-clude normal-appearing cord at both ends. An intensity profile was obtained along this length (Fig 1). The lesion-margin sharp-ness was defined as the average of the distance for a 20%– 80% difference in signal intensity on the line-intensity profile at the cranial and caudal margins of the lesion.14
Statistical Analysis
Weightedstatistics were used to analyze the interreader variabil-ity in the lesion count in each group at each cervical level. The Wilcoxon signed rank test was used to compare the lesion
conspi-cuity between the 2 groups. The difference in lesion count per patient between sequence groups and the LES was analyzed by using a paired Studentttest. A linear regression model based on a generalized estimation equation was used to analyze the differ-ence in lesion contrast ratios among STIR, PDWTSE, and WMS. The comparison of reader preference between STIR and PDWTSE was analyzed by a2test. The threshold for statistical significance was
set atP⬍.05.
RESULTS
The number of lesions detected on STIR/PDWTSE by readers 1 and 2, respectively, was 177 (average lesions per patient, 4.2⫾3.0) and 183 (average lesions per patient, 4.3⫾3.4). The total number of lesions detected was marginally higher on WMS for both read-ers (reader 1: 191; average lesions per patient, 4.5⫾ 3.5; and reader 2: 189; average lesions per patient, 4.5⫾3.5). There was no statistically significant difference in the lesion count per patient between STIR/PDWTSE and WMS (P⫽.64) (Table 1). No le-sions were identified in 8 patients in both sequence groups by both readers.
Qualitative Analysis
Interreader agreement on lesion count per cervical level on STIR/ PDWTSE was fair (⫽0.49 and 0.52 at C1–C4 and C5–C7 levels, respectively; overall agreement, ⫽ 0.52). On the other hand, the interreader agreement for lesion count was substan-tial on WMS ( ⫽ 0.82 and 0.84 at C1–C4 and C5–C7 levels, respectively; overall agreement,⫽0.82).
The average score of both reviewers for overall subjective lesion conspicuity at the C1–C4 and C5–C7 levels was bet-ter on WMS (3.7/5 and 3.8/5) than on STIR/PDWTSE (3.1/5 and 3.1/5), re-spectively (P⬍.01) (Fig 2andTable 2). Within the STIR/PDWTSE group, the lesions were better visualized on STIR in 21 and 17 patients and better seen on PDWTSE in 10 and 12 patients. They were equal in 11 and 13 patients by read-ers 1 and 2, respectively (P⫽.1).
On a side-by-side comparison of the 2 sequence groups, 191 true lesions were identified. More spurious findings were FIG 1. Measurement of lesion edge sharpness on a sagittal WMS image in a 39-year-old woman
[image:3.594.55.375.346.522.2]with a relapsing-remitting subtype of multiple sclerosis. Alineis drawn along the long axis of the lesion located at the C2–C3 level, which includes the adjoining normal-appearing cord. The histogram derived represents the signal-intensity profile along the line. Lesion edge sharpness is determined by the average of distance required for a 20%– 80% change in the signal intensity at the upper and lower margins of the lesion.
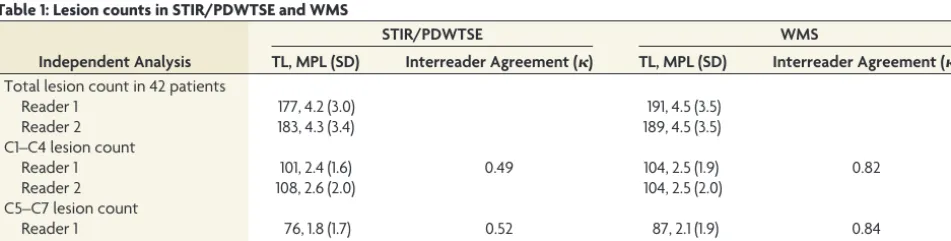
Table 1: Lesion counts in STIR/PDWTSE and WMS
Independent Analysis
STIR/PDWTSE WMS
TL, MPL (SD) Interreader Agreement () TL, MPL (SD) Interreader Agreement () Total lesion count in 42 patients
Reader 1 177, 4.2 (3.0) 191, 4.5 (3.5)
Reader 2 183, 4.3 (3.4) 189, 4.5 (3.5)
C1–C4 lesion count
Reader 1 101, 2.4 (1.6) 0.49 104, 2.5 (1.9) 0.82
Reader 2 108, 2.6 (2.0) 104, 2.5 (2.0)
C5–C7 lesion count
Reader 1 76, 1.8 (1.7) 0.52 87, 2.1 (1.9) 0.84
Reader 2 79, 1.9 (1.8) 85, 2.0 (1.8)
[image:3.594.56.532.603.723.2]noted on STIR/PDWTSE than on WMS by readers 1 and 2 in the cervical cord (23, 30 and 3, 4 on STIR/PDWTSE and WMS, respectively, P ⬍ .01). Of 53 spurious lesions noted by both readers in the STIR/PDWTSE group, 32 of 53 spurious lesions (60.4%) were noted on PDWTSE and 21 of 53 were noted on STIR (39.6%). Readers 1 and 2 missed 37 and 38 definite lesions on STIR/PDWTSE, whereas 3 and 6 such lesions were missed on WMS (P⬍.01) (Fig 3andTable 2).
Quantitative Analysis
The average contrast ratio and lesion sharpness were measured on the sagittal STIR, PDWTSE, and WMS sequences. Analysis was done on 82 lesions using all 3 sagittal sequences. Average length of the lesions was 1.0⫾0.5 cm. The con-trast ratio of these analyzed lesions was higher in WMS (0.8) compared with STIR (0.4) and PDWTSE (0.2) (P ⬍
.01). The contrast ratio was higher in STIR (0.4) compared with PDWTSE (0.2) (P⬍.01). The lesion edge sharp-ness was measured in a subset of 25 se-lected lesions by using a line-intensity profile tool. LES was higher on WMS (2.3 mm) than in the other group (3.1 mm on STIR and 2.9 mm on PDWTSE,
P⬍.01). Furthermore, within the STIR/ PDWTSE group, the LES was marginally better for PDWTSE (2.9) than on STIR (3.1), though this finding was not statis-tically significant (P⫽.11) (Table 3).
DISCUSSION
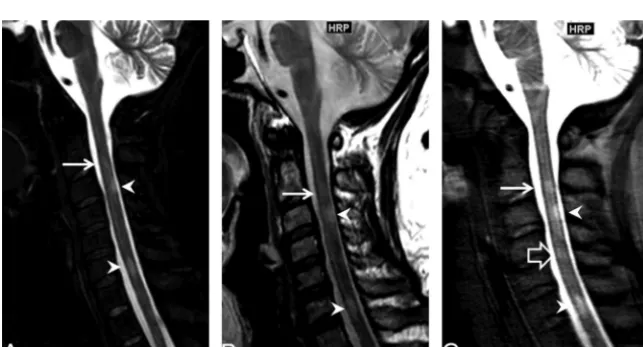
Detection of the focal spinal cord lesions may increase confidence in the clinical diagnosis of MS or can predict conver-sion of a clinically isolated syndrome into definite MS.15-17In diagnosed cases of MS, quantification of disease activity is important for monitoring treatment efficacy.18The purpose of this study was to compare the WMS sequence with a short TE with the conventional se-quences of STIR and PDWTSE in imag-ing the cervical spinal cord in MS. Be-cause there are no studies that detail the optimal TE used in the inversion recov-ery sequence for imaging MS lesions, we chose a WMS TE of 11 ms after compar-ing the signal-to-noise ratio and lesion contrast with TE⫽5 ms, TE⫽11 ms, and TE⫽25 ms in a pilot study (data FIG 2. Example of improved lesion conspicuity in a 45-year-old woman with a relapsing-remitting
subtype of multiple sclerosis. Sagittal STIR (A) and PDWTSE (B) images show a focal lesion in the dorsum of the cord at the lower C2 level (arrow). Anterior to this lesion, there is linear hyperin-tensity in the center of the cord usually noted on the STIR/PDWTSE sequence group ( arrow-head). The central canal is more homogeneous in signal intensity on sagittal WMS image (C); this feature improves the definition of the superior margin of the dorsal lesion. An additional focal lesion is noted in the ventral cord at the upper C2 level (open arrow), better identified on the WMS sequence (C).
[image:4.594.55.375.47.219.2]FIG 3. An example of a definite lesion missed on STIR/PDWTSE in a 40-year-old woman with multiple sclerosis. Sagittal STIR (A) and PDWTSE (B) images show focal lesions at the C3 and C6 levels (arrowheads). Another lesion at the C2 level (arrow) is less conspicuous due to central cord high signal in STIR/PDWTSE. On WMS (C), the lesion at C2 is better visualized. An additional focal lesion is noted on WMS at the C4 level (open arrow), which is identified on PDWTSE as a faint hyperintensity on the side-by-side comparison.
Table 2: Qualitative analysis of focal lesions
STIR/PDWTSE WMS PValue
Independent analysis
Overall subjective lesion conspicuity, C1–C4 (M1,2, M1, M2)
3.1, 3.1, 3.0 3.7, 3.8, 3.7 ⬍.01
Overall subjective lesion conspicuity, C5–C7 (M1,2, M1, M2)
3.1, 3.2, 3.0 3.8, 4.1, 3.5 ⬍.01
Side-by-side analysis Spurious discrepant lesions
Reader 1 (DL, MDL) 23, 0.5 3, 0.1 ⬍.01
Reader 2 (DL, MDL) 30, 0.7 4, 0.1 ⬍.01
True missed discrepant lesions
Reader 1 (DL, MDL) 37, 0.9 3, 0.1 ⬍.01
Reader 2 (DL, MDL) 38, 0.9 6, 0.1 ⬍.01
Note:—M1, 2indicates mean lesions per level for reviewers 1 and 2; M1, mean lesions per level for reviewer 1; M2, mean
[image:4.594.53.377.324.460.2] [image:4.594.55.377.494.668.2]not shown). A shorter TE in WMS (11 ms) compared with STIR or PDWTSE (50 and 45 ms, respectively) is advantageous for MS imaging. T1 prolongation is a manifestation of myelin loss in MS, which acts as a dominant contrast mechanism in long TR/shorter TE sequences such as WMS. Additionally, the dephasing effects of CSF pulsation artifacts are less pronounced at lower TEs.19On the other hand, T2 prolongation is less specific for MS and occurs due to edema in active lesions and gliosis in chronic lesions.20Also, as discussed earlier, there is a loss of contrast between the MS plaques and spinal cord on T2-weighted sequences with longer TEs.
The combined acquisition time of the axial and sagittal WMS sequence used in the current study (7.5 minutes) is similar or less compared with the sagittal and axial 2D single-inversion WMS (10.5 minutes) described in a prior study9and compared with previous descriptions using 3D double inversion recovery or T1WI magnetization-prepared rapid acquisition of gradient echo sequences (7–7.5 minutes).21,22While separate axial and sagittal acquisitions do not have the advantage of the isotropic resolution needed for multiplanar evaluation, they are less prone to image degradation due to shorter acquisition times compared with the 3D techniques.22
By implementing the WMS sequence in a routine MS cervical cord imaging protocol, we were able to increase interreader agree-ment in level-by-level focal lesion counts, improve lesion conspi-cuity, and decrease artifacts compared with standard STIR/ PDWTSE, without a serious time penalty.
The average number of lesions per patient detected on WMS was similar to that in STIR/PDWTSE. However, the lesion counts per patient at each cervical level varied between these techniques and had only fair intersequence group agreement. This finding signifies an underlying difference in the perception and interpre-tation of focal findings between the techniques (ie, in terms of what constitutes a lesion versus artifacts). The interreader agree-ment on the lesion count per each level and overall on WMS was significantly better compared with STIR/PDWTSE. Higher inter-reader agreement in WMS was probably related to better lesion contrast and margin delineation of lesions compared with STIR/ PDWTSE, a feature vital for maintaining consistency in monitor-ing MS disease activity across different radiologists on follow-up imaging.
The contrast ratio on WMS was 2-fold better than that on STIR and approximately 4 times better than that on PDWTSE. However, the extent of improvement in the contrast ratio on the WMS sequence we used was less than that reported by Poonawalla et al.9This difference may be due to variations in sequence pa-rameters, such as the TE used in this study. Previous studies have demonstrated that STIR provided a superior contrast ratio and better lesion depiction over PDWTSE.5In this study, although the contrast ratio on STIR was 2 times better than that on PDWTSE,
the LES was not significantly different; therefore, there was no reader prefer-ence toward either of these sequprefer-ences in terms of lesion delineation. The low in-terreader agreement on lesion count on STIR is comparable with findings de-scribed in an earlier study.7 Tradition-ally, STIR and PDWTSE have been used in combination to overcome each other’s shortcomings.10,23The LES in WMS was marginally but statistically better than that on STIR and PDWTSE; this finding may be due to better background suppression of the normal white matter. Better LES could also be a result of a shorter TE, which, in addition to improving lesion contrast by decreasing T2-weighting, also limited the dephasing effects of CSF pulsation, which could result in blurring of the tissue interfaces.5
The number of missed definite lesions was higher on STIR/ PDWTSE sequences. All these lesions could be retrospectively vi-sualized on STIR/PDWTSE by side-by-side comparison with WMS. The higher chance of missing true lesions on STIR/ PDWTSE could be explained on the basis of the lower contrast ratio of the definite lesions, higher number of artifacts, and decreased margin sharpness that was essential to resolve closely situated multiple lesions in the STIR/PDWTSE group.
Artifacts related to CSF pulsations are known to produce focal T2WI signal changes on the STIR sequence, which can be mis-taken for real abnormalities.24Similarly, the higher T2WI signal of gray matter and the central canal on STIR and PDWTSE can cause spurious T2WI hyperintense foci or can obscure the central lesions, which have a signal intensity similar to that of gray mat-ter.25WMS provided a more homogeneous background, in which the centrally located lesions were better appreciated than in the STIR/PDWTSE group. Nelson et al26 have demonstrated im-proved visualization of cortical and juxtacortical MS lesions on WMS over FLAIR and dual FSE in the cerebral cortex. Later, Poonwalla et al9described the advantage of phase-sensitive inver-sion recovery over STIR and dual-echo T2 sequences in the delin-eation of gray matter involvement in the cervical spinal cord. An-other study found that phase-sensitive inversion recovery retains this advantage over high-resolution axial 3D proton density– weighted gradient-echo (fast-field echo) imaging as well, though the latter sequence was better in detecting focal abnormalities.27 Studies specifically evaluating the utility of WMS in depicting lesions within the spinal cord gray matter will be needed in the future.
The study has a few limitations. Undersampling in the phase-encoding direction in WMS resulted in lower spatial resolution along the phase-encoding direction, manifesting as mild blurring. Further work is needed to overcome this shortcoming while lim-iting the image-acquisition time. While WMS was better than STIR and PDWTSE in the evaluation of focal cord lesions, the extra-axial structures such as disc, spine, and paraspinal tissues were not as well-visualized on WMS. Therefore, inclusion of ei-ther STIR or PDWTSE is still necessary for complete evaluation of extramedullary structures in the cervical spine MR imaging exam-ination. In this limited study, WMS was not advantageous over STIR or PDWTSE in evaluating diffuse lesions and cord atrophy in progressive subtypes of MS. In these patients, cord-volume assessment, magnetization transfer, and diffusion tensor imaging Table 3: Quantitative analysis of focal lesions
STIR (Mean)
(SD)
PDWTSE (Mean)
(SD)
WMS (Mean)
(SD)
PValue STIR vs
PDWTSE STIR vs WMS
may be better for the quantification of disease activity.18Finally, there is no reference standard for identification of “true” lesions in the spinal cord. Instead, we relied on follow-up imaging and 2-plane visualization to select lesions deemed most likely to rep-resent actual spinal cord lesions. With this classification system, WMS imaging outperformed STIR and PDWTSE sequences in our analysis.
CONCLUSIONS
WMS could potentially be substituted for either STIR or PDWTSE sequences in routine clinical protocols. There is better interreader consistency in the lesion count on WMS compared with STIR/PDWTSE sequences. The focal cord lesions are visual-ized with better conspicuity due to better contrast ratio and edge sharpness. There are fewer spurious lesions on WMS compared with STIR/PDWTSE. The WMS techniques can allow better le-sion delineation and confidence in lele-sion counts.
Disclosures: Kenneth R. Maravilla—UNRELATED:Consultancy: Guerbet;Grants/ Grants Pending: Bayer,* Bracco,* Guerbet,*Comments: clinical trial grants;Payment for Lectures (including service on Speakers Bureaus): Bracco. *Money paid to the institution.
REFERENCES
1. Bergers E, Bot JC, De Groot CJ, et al.Axonal damage in the spinal cord of MS patients occurs largely independent of T2 MRI lesions.
Neurology2002;59:1766 –71CrossRef Medline
2. Bergers E, Bot JC, van der Valk P, et al.Diffuse signal abnormalities in the spinal cord in multiple sclerosis: direct postmortem in situ magnetic resonance imaging correlated with in vitro high-resolu-tion magnetic resonance imaging and histopathology.Ann Neurol
2002;51:652–56CrossRef Medline
3. Lycklama G, Thompson A, Filippi M, et al.Spinal-cord MRI in mul-tiple sclerosis.Lancet Neurol2003;2:555– 62CrossRef Medline
4. Bot JC, Barkhof F, Polman CH, et al.Spinal cord abnormalities in recently diagnosed MS patients: added value of spinal MRI exami-nation.Neurology2004;62:226 –33CrossRef Medline
5. Hittmair K, Mallek R, Prayer D, et al.Spinal cord lesions in patients with multiple sclerosis: comparison of MR pulse sequences.AJNR Am J Neuroradiol1996;17:1555– 65Medline
6. Chong AL, Chandra RV, Chuah KC, et al.Proton density MRI in-creases detection of cervical spinal cord multiple sclerosis lesions compared with T2-weighted fast spin-echo.AJNR Am J Neuroradiol
2016;37:180 – 84CrossRef Medline
7. Nayak NB, Salah R, Huang JC, et al.A comparison of sagittal short T1 inversion recovery and T2-weighted FSE sequences for detec-tion of multiple sclerosis spinal cord lesions.Acta Neurol Scand
2014;129:198 –203CrossRef Medline
8. Vargas MI, Delavelle J, Kohler R, et al.Brain and spine MRI artifacts at 3Tesla.J Neuroradiol2009;36:74 – 81CrossRef Medline
9. Poonawalla AH, Hou P, Nelson FA, et al.Cervical spinal cord lesions in multiple sclerosis: T1-weighted inversion-recovery MR imaging with phase-sensitive reconstruction. Radiology 2008;246:258 – 64
CrossRef Medline
10. Philpott C, Brotchie P.Comparison of MRI sequences for evalua-tion of multiple sclerosis of the cervical spinal cord at 3 T.Eur J Radiol2011;80:780 – 85CrossRef Medline
11. Vaithianathar L, Tench CR, Morgan PS, et al.Magnetic resonance imaging of the cervical spinal cord in multiple sclerosis–a quanti-tative T1 relaxation time mapping approach.J Neurol2003;250: 307–15CrossRef Medline
12. Smith SA, Edden RA, Farrell JA, et al.Measurement of T1 and T2 in the cervical spinal cord at 3 Tesla.Magn Reson Med2008;60:213–19
CrossRef Medline
13. Fries P, Runge VM, Kirchin MA, et al.Magnetic resonance imaging of the spine at 3 Tesla.Semin Musculoskelet Radiol2008;12:238 –52
CrossRef Medline
14. Camren GP, Wilson GJ, Bamra VR, et al.A comparison between gadofosveset trisodium and gadobenate dimeglumine for steady state MRA of the thoracic vasculature.Biomed Res Int2014;2014: 625614CrossRef Medline
15. Bot JC, Barkhof F.Spinal-cord MRI in multiple sclerosis: conven-tional and nonconvenconven-tional MR techniques.Neuroimaging Clin N Am2009;19:81–99CrossRef Medline
16. Polman CH, Reingold SC, Banwell B, et al.Diagnostic criteria for multiple sclerosis: 2010 revisions to the McDonald criteria.Ann Neurol2011;69:292–302CrossRef Medline
17. Sombekke MH, Wattjes MP, Balk LJ, et al.Spinal cord lesions in patients with clinically isolated syndrome: a powerful tool in diag-nosis and progdiag-nosis.Neurology2013;80:69 –75CrossRef Medline
18. Gass A, Rocca MA, Agosta F, et al; MAGNIMS Study Group.MRI mon-itoring of pathological changes in the spinal cord in patients with mul-tiple sclerosis.Lancet Neurol2015;14:443–54CrossRef Medline
19. Melhem ER, Benson ML, Beauchamp NJ, et al.Cervical spondylosis: three-dimensional gradient-echo MR with magnetization transfer.
AJNR Am J Neuroradiol1996;17:705–11Medline
20. Bru¨ck W, Bitsch A, Kolenda H, et al.Inflammatory central nervous system demyelination: correlation of magnetic resonance imaging findings with lesion pathology. Ann Neurol 1997;42:783–93
CrossRef Medline
21. Riederer I, Karampinos DC, Settles M, et al.Double inversion recov-ery sequence of the cervical spinal cord in multiple sclerosis and related inflammatory diseases.AJNR Am J Neuroradiol 2015;36: 219 –25CrossRef Medline
22. Nair G, Absinta M, Reich DS.Optimized T1-MPRAGE sequence for better visualization of spinal cord multiple sclerosis lesions at 3T.
AJNR Am J Neuroradiol2013;34:2215–22CrossRef Medline
23. Rovira A, Wattjes MP, Miller D, et al; MAGNIMS study group. Evi-dence-based guidelines: MAGNIMS consensus guidelines on the use of MRI in multiple sclerosis— establishing disease prognosis and moni-toring patients.Nat Rev Neurol2015;11:597– 606CrossRef Medline
24. Bot JC, Barkhof F, Lycklama a` Nijeholt GJ, et al.Comparison of a conventional cardiac-triggered dual spin-echo and a fast STIR se-quence in detection of spinal cord lesions in multiple sclerosis.Eur Radiol2000;10:753–58CrossRef Medline
25. Yiannakas MC, Kearney H, Samson RS, et al.Feasibility of grey mat-ter and white matmat-ter segmentation of the upper cervical cord in vivo: a pilot study with application to magnetisation transfer mea-surements.Neuroimage2012;63:1054 –59CrossRef Medline
26. Nelson F, Poonawalla AH, Hou P, et al.Improved identification of in-tracortical lesions in multiple sclerosis with phase-sensitive inversion recovery in combination with fast double inversion recovery MR im-aging.AJNR Am J Neuroradiol2007;28:1645– 49CrossRef Medline
27. Kearney H, Altmann DR, Samson RS, et al.Cervical cord lesion load is associated with disability independently from atrophy in MS.