INTERACTIVE PARAMETER ADAPTATION TOOL FOR
IMAGE SEGMENTATION
Olivier Pauplin, Praminda Caleb-Solly and Jim Smith
Bristol Institute of TechnologyUniversity of the West of England Bristol, BS16 1QY, UK
{Olivier.Pauplin, Praminda.Caleb-Solly, James.smith}@uwe.ac.uk
ABSTRACT
This paper describes an Interactive Parameter Adaptation Tool (IPAT) for determining parameters to control texture based segmentation of Regions of Interest (ROI) on images. This tool enables non-image processing experts to interact with evolutionary algorithms to produce a set of ROI segmentation parameters that are capable of segmenting ROI in response to existing system constraints.
KEYWORDS
Texture based segmentation, interactive evolution, evolutionary algorithm.
1.
INTRODUCTION
Recent years have seen advances in Machine Vision (MV) systems used for images analysis and classification, whereby the human expert is (at least partially) replaced and / or supported by the combination of dedicated image capture and processing hardware with sophisticated pattern-recognition and classification systems such as Artificial Neural Networks. Such systems are now commercially available and an overview can be seen in [Malamas 2003].
The process of developing customised reliable image segmentation algorithms for the detection, and possibly categorisation of regions of interest within images, can require significant investment of expert time to set up. The algorithms can often be ―brittle‖ in the sense of being highly specialised to the task for which they are tuned, and are consequently sensitive to changes in operating conditions or image specifications. This can raise problems where the end-users are experts in their domain, but not in image processing.
One approach is to use Interactive Evolution for developing rapidly reconfigurable systems in which the users’ tacit knowledge and requirements can be elicited and used for finding the appropriate parameters to achieve the required segmentation without any need for specialised knowledge of the underlying machine vision systems. This paper describes an interactive tool that can be used to quickly and easily evolve optimal image segmentation parameters from scratch.
One of the key requirements for a system that is based on user interaction is a high level of usability, both in terms of effectiveness – being able to build accurate models that meet end-user requirements – and efficiency – being able to achieve the required results within a minimal amount of time and undue effort. The system described in this paper has been designed with these considerations in mind to ensure a high level of user-experience of the interaction process.
1.1 Image processing
The ROI (Region of Interest) segmentation method used in IPAT is based on texture calculation. We have found texture based segmentation to perform most consistent and robust region detection for a number of industrial web material inspection applications at which this system is targeted.
Texture describes the spatial distribution of sub-patterns of grey levels in an image, called texels, and visually it can be described as fine, coarse, smooth, speckled etc.
Mathematically, one of the ways in which textural information can be extracted is by computing the statistical relationships of the spatial distribution of the texels [Haralick et al., 1973]. This involves the calculation of a set of grey level co-occurrence matrices from which statistical measures that relate to characteristics such as homogeneity, contrast, correlation, variance and entropy, are calculated.
A window (or kernel) is centered on each pixel of the original image, a texture value of the ensemble of pixels belonging to that window is computed, and the result becomes the value of the corresponding pixel in the texture image. The texture image is completed by moving the window along all the pixels (eventually one every two pixels) of the original image. It is then normalised and resized to the size of the original image, and thresholded. If a ROI to be segmented has an image texture which gives high values with the texture function used, provided the parameters (window height, window width, threshold) have adequate values, the contours of the thresholded texture image should match the contours of the ROI.
Eight different texture functions are used to differentiate textures: variance, skewness, kurtosis, homogeneity, inertia, correlation, energy and entropy. A direction – horizontal, first diagonal, vertical and second diagonal, or 0, 45, 90 and 135 degrees – is also needed to compute some texture values.
A ―profile‖ is made of the parameters mentioned above. However, to be able to process a broader range of cases effectively, profiles comprise parameters of several ―kernels‖, and the number of kernels used. For example, a profile may be:
Each of these parameters, including the number of kernels in use, can be evolved by the evolutionary algorithm. Processing is performed independently on the original image by all the kernels in the profile, then the resultant ROI are derived from the binary image obtained by applying an ―OR‖ operator on the thresholded images derived from the different kernels. The ability to evolve the number of kernels in a profile is a new feature of this tool to enhance the applicability of the algorithm by enabling it to operate on a more diverse range of data.
In order for the segmentation to be effective it is important to determine the optimal parameters within the profiles. Searching the space of possible parameter is achieved using an evolutionary algorithm which is described in the next section.
1.2 Evolutionary Algorithms and Interactive Evolution
Evolutionary Algorithms are a class of stochastic population-based search heuristics loosely modelled on Darwinian Evolution and genetics. Each member of the population consists of the set of parameters needed to construct a candidate solution together with a scalar ―fitness‖ value, which reflects some measure of the
quality of that solution. To the population are iteratively applied the stochastic processes of selection of
parents (with a bias towards ―fitter‖ individuals), recombination of parents (whereby parts of two or more
parents are mixed at random to produce a new solution), mutation of the resultant offspring (whereby with a
low probability random changes are made to the parameters) and finally replacement of the parents by the
new set of offspring. This is now a mature technology, which has been successfully applied in a wide range of problem domains.
Profile = Number of kernels = 2 , , texture function = inertia kernel height = 11 kernel width = 17 angle = 45 deg. threshold = 110
texture function = entropy kernel height = 7 kernel width = 21 angle = 135 deg. threshold = 84
Interactive evolution involves the allocation of the fitness value for a candidate solution by a human, as opposed to being calculated by a pre-determined mathematical model. The field of interactive evolution has been expanding into numerous and varied application areas since Dawkins introduced the evolution of ―biomorphs‖ using subjective selection [Dawkins 1987]. In reviewing the literature, applications using ―interactive evolution‖ were found to range from generating Jazz solos [Biles 1994] to personalising hearing
aid characteristics [Takagi 1999] and manufacturing plant design optimisation [Brintrup 2007] . In [Takagi
2001], Takagi divides research based on interactive evolution in three major fields - artistic, engineering and educational, and lists a vast range of references demonstrating the scope of this idea. Human expertise is exploited in terms of its unparalleled creativity and ability for pattern recognition. Interactive evolution is particularly appropriate for the optimisation of a quality metric which is difficult to mathematically define and possibly subject to change over a period of time, but can be assigned by a human on the basis of tacit expert knowledge. However, the reliance on human guidance and judgement to direct and control the search creates both the potential weaknesses and strengths. On one hand, human assessment tends to have a component of subjectivity and non-linearity of focus over time. Hence including a human in the loop introduces a need for rapid convergence to prevent the interactive process from becoming tedious for the human participant. At the same time the ability to manoeuvre the search interactively can potentially be exploited as a powerful strategy for adapting an otherwise naive evolutionary algorithm.
2.
IPAT
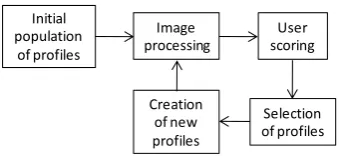
IPAT (Interactive Parameter Adaptation Tool) [Caleb-Solly 2004, Caleb-Solly 2005] is an application that has been designed to provide an effective and efficient graphical interface to find optimal image segmentation parameters to segment regions of interests (ROI) on images from users’ knowledge. Its functioning is based on an evolutionary algorithm, which evolves a population of individuals, the profiles. Profiles store the parameters according to which images are processed, and are evaluated through a segmentation quality score given by a user, who judges whether or not a profile results in a satisfactory segmentation of the ROIs. Best profiles are selected and mutated in order to produce the next generation of profiles. Several iterations of this process are usually needed to obtain a satisfactory segmentation; the main IPAT loop can be seen on figure 1, and its components are detailed hereafter.
Image processing
User scoring
Selection of profiles Creation
of new profiles Initial
[image:3.595.220.390.453.531.2]population of profiles
Figure 1. Main IPAT loop.
2.1 Initial population
The population of profiles is initialised at random. Profiles contain the image processing parameters, described in section 2.2. It is also possible to start the search from a pre-determined point by loading a previously saved profile that has been successful on other problems. This can in some instances reduce the search time.
2.3 Scoring of profiles
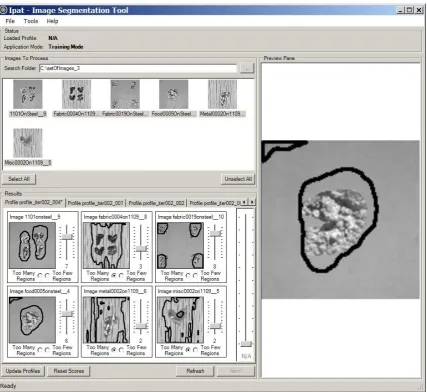
images are displayed in the bottom left section (―Results‖ part), and the right section is a preview pane used to zoom on a particular image.
The user can switch between the different profiles of the current population, to compare them. He/she can choose to display results by profile (as shown on figure 2), or by image.
There are two ways to give a score to a profile:
A global score can be assigned to a profile using the big vertical slider bar on the right hand side of
the ―results‖ part of the IPAT window. This is the quickest way to score profiles.
Local scores can be given to each image of each profile, using the small vertical slider bars on the
right hand side of the segmented images. This can be useful when a profile performs well on some images and not on others. A global score is obtained by calculating the average of local scores by the system.
[image:4.595.93.521.287.679.2]The user can also give a hint about whether he thinks the contours are too wide or too small compared to the ROI. This is made possible with the radio buttons ―too many regions / too few regions‖, which can be seen under each contour images on figure 2. These hints are then used to modify the threshold value: ―too many regions‖ means the threshold is certainly too low and should be increased, and selecting ―too few regions‖ has the converse effect. The Reset Scores button deselects the radio buttons and reinitialises the scores.
3.
EXPERIMENTS
Experiments were conducted by three users, each one using three sets of six images. The images are synthetic images made from Brodatz and VisTex sets of textures [Brodatz 1966, VisTex]. Each image is composed of a different background and foreground texture, the latter being the ROI of various sizes and shapes.
[image:5.595.89.526.244.409.2]Overall, two textures were used for the background and six for the foreground. A typical application of IPAT would be to tune image processing parameters in order to find an optimum set of parameters on a given data set, to construct a customised image processing system for a given problem. For instance, it can be used to find defects on the surface of hot-rolled steel [Caleb-Solly 2007]; in such cases, the defects can present different textures, whereas the surface (background) has a consistent texture. Hence the first and second sets of images each have only one background texture (figures 3 and 4). The third set of images is a mixture of all eight textures (figure 5).
Figure 3. Set of images 1: one background texture, three foreground textures.
[image:5.595.81.526.439.509.2]Figure 4. Set of images 2: one background texture, three foreground textures (all different textures than set 1).
Figure 5. Set of images 3: two background textures and six foreground textures.
Experiments were all run using a population of six profiles. Half the experiments were run using the ―too many / too few regions‖ hint, and the other half, without. The user runs an experiment until he/she considers a profile giving a satisfactory segmentation on all the training images has been found. A total of 60 experiments were run, each user performing 10 runs for each of the three image sets, five using the hints function and five without.
4.
RESULTS AND DISCUSSION
4.1 Run length
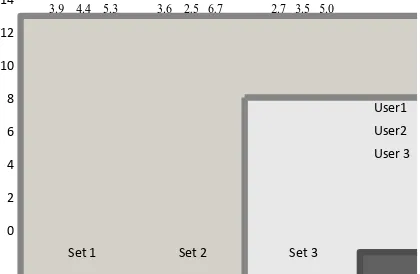
The technique proved to be successful with an average of 9.63 iterations, that is to say 9.63 (in average) scoring phases of the population of six profiles.
different textures, was expected to be the most difficult set to process and to require the highest number of iterations. Surprisingly, it required, on average, less iteration iterations than set 1. Examining the scores allocated by the users, and then looking at the resultant segmented images using the final profiles, one possible reason might be that the users realise set 3 is more difficult, and subsequently lower their expectations. They tend to stop the IPAT runs when the contours only very roughly match the visible ROIs.
0 2 4 6 8 10 12 14
Set 1 Set 2 Set 3
[image:6.595.204.414.172.309.2]User1 User2 User 3
Figure 6. Average number of iterations. The nine numbers on the top are the corresponding standard deviation values.
[image:6.595.195.413.389.433.2]That is highlighted by the score values given to the final (and best) profiles. Table 1 shows the average final scores for the different sets of images, and it can be seen that, whereas set 2 leads to very satisfying profiles, set 3 gives much less satisfaction to the users.
Table 1. Average final scores for each set
Image set number Average score of the best profiles
1 8.28
2 3
9.23 6.26
4.2 Use of hints
The focus of these experiments was to assess the utility of a key new feature, which was being able to incorporate specific expert knowledge to enhance the efficiency of the search in addition to the quantitative scores allocated by the user. The use of the ―too many / too few regions‖ hint proved to be a very efficient new feature. The average number of iterations with hint, 7.8, is lower than the average number of iteration without hint, 11.47. The difference in average final scores with and without hint is not statistically significant: 7.97 without hint, and 7.87 with hint. The use of hints is seen as one of the major steps forward in capturing additional domain knowledge from the expert working with the interactive evolution algorithm to increase the convergence speed.
4.3 Texture functions
One aspect that we were interested investigating was whether the search space could be reduced by eliminating some of the parameters values which were not utilized. When examining which texture functions were selected in the kernels of the best profiles, we found out that some texture functions were almost never used, whereas some others were much more frequently used. Moreover, we could confirm that the texture function leading to accurate segmentation varies depending on the textures present in the images.
Figure 7 shows the proportions of the different texture functions used to segment the three sets of images. Set 2, which is the easiest to segment, has the most pronounced trend in favour of one texture (entropy). Set 1
and set 3 have a less clearly marked optimal texture function, which certainly is linked with the fact they are more difficult to process as they contain more variability in terms of number of textures. Also, it can be seen that set 3, which is made of all the textures contained in sets 1 and 2, has proportions of texture functions between those of sets 1 and 2 for the most used texture functions (variance, correlation, entropy).
0 10 20 30 40 50 60
Set 1
Set 2
[image:7.595.170.453.153.304.2]Set 3
Figure 7. Percentage of each texture function used by best profiles, for each set of images.
5.
CONCLUSION
A new framework for interactive image segmentation has been presented which builds on previous work using interactive evolution. In terms of the underlying search algorithms, we have made some improvements by hybridising the evolutionary algorithm to include domain specific knowledge in the form, of a ― hints‖ feature which directs the mutation, and the ability to work with a broader range of images by evolving more texture kernels if required.
The key advancement is the development of an enhanced graphical user interface which enables non-image processing experts to interact intuitively with the system. The user is only concerned with the final outcome and needs to be able to guide the system without having to put in too much effort in terms of cognition or time, since that would result in fatigue and thus, disengagement with the process. This is enabled by introducing a number of features that enhance the usability of the system. Firstly, we have reduced the amount of interaction required per generation: the user only needs to hover over an image to view a higher resolution version, and they can now input a global score for a profile rather than having to score individual images. Second we have implemented measures to give the user more flexibility and confidence in how they use the tool. These include the ability to see the output grouped by profiles or by images (the latter is found to increase user confidence in the consistency of scores they are allocating), the provision of visual feedback to indicate which profiles have been already scored; and the ability to alter the number of profiles depending on the complexity of the solution space.
Future work will involve enhancing the Interactive Parameter Adaptation tool by incorporating alternative image segmentation algorithms in addition to texture based segmentation to widen the applicability of the tool to a wider range of image types The profile in this case will contain the type of image segmentation algorithm in addition to its corresponding parameters.
In addition, more experiments with a large user group and more image data sets will be conducted to provide more statistically verifiable data in assessing the effectiveness and efficiency resulting from the enhancements.
ACKNOWLEDGEMENT
This work was supported by the European Commission (project Contract No. STRP016429, acronym DynaVis). This publication reflects only the authors' views.
REFERENCES
Biles, J. A. (1994). GenJam: A genetic algorithm for generating jazz solos. ICMC Proceedings 1994. The Computer Music Association
Brintrup, Alexandra Melike , Jeremy Ramsden, Ashutosh Tiwari (2007) An interactive genetic algorithm-based framework for handling qualitative criteria in design optimization, Computers in IndustryVolume 58, Issue 3 Brodatz, P., 1966. Textures: A Photographic Album for Artists and Designers. Dover Publications, New York, USA. Caleb-Solly, P., Smith, J., 2004. Procs of the 6th Int. Conf Adaptive Computing in Design and Manufacture. Interactive
Evolutionary Strategy Based Discovery of Image Segmentation Parameters, Springer
Caleb-Solly, P. & Smith, J., 2005. Proc. IEEE Congress on Evolutionary Computation. Incorporation of Adaptive Mutation Based on Subjective Evaluation in an Interactive Evolution Strategy. pp 979—986.
Caleb-Solly, P. & Smith, J. E., 2007. Adaptive Surface Inspection via Interactive Evolution, Journal of Image and Vision Computing, Butterworth-Heinemann, 25, 1058-1072
Dawkins, R., (1987) The Blind Watchmaker. WW Norton and Company
Eiben, A.E. and Smith, J.E. (2003) Introduction to Evolutionary Algorithms. Springer.
Haralick, R.M., Shanmugam, K., Dinstein, I., 1973. Texture Feature for Image Classification. IEEE Transactions on Systems, Man and Cybernetics, Vol. SMC-3, No 6, November, pp 610-620
Malamas, Elias N., Euripides G. M. Petrakis, Michalis Zervakis, Laurent Petit, Jean-Didier Legat, (2003) A survey on industrial vision systems, applications and tools, Image and Vision ComputingVolume 21, Issue 2
Takagi, H., Ohsaki M. (1999): IEC- based Hearing Aid Fitting. Proceedings of Int’l Conf. On System, Man and
Cybernetics (SMC’99), Vol 3, 657-662 IEEE
Takagi, H. (2001). Interactive Evolutionary Computation: Fusion of the Capacities of EC Optimization and Human Evaluation. Proceesings of the IEEE 89, 9, pp. 1275-1296