Levulinic acid
Barbara Hachuła,a* Anna Polasz,aMarzena Dzida,aMaria Nowakband Joachim Kuszb
a
Institute of Chemistry, University of Silesia, 14 Bankowa Street, 40-006 Katowice, Poland, andbInstitute of Physics, University of Silesia, 4 Uniwersytecka Street, 40-007 Katowice, Poland
Correspondence e-mail: [email protected]
Received 19 July 2013; accepted 29 July 2013
Key indicators: single-crystal X-ray study;T= 100 K; mean(C–C) = 0.002 A˚; Rfactor = 0.040;wRfactor = 0.114; data-to-parameter ratio = 13.2.
The title compound (systematic name: 4-oxopentanoic acid), C5H8O3, is close to planar (r.m.s. deviation = 0.0762 A˚ ). In the
crystal, the molecules interactviaO—H O hydrogen bonds in which the hydroxy O atoms act as donors and the ketone O atoms in adjacent molecules as acceptors, formingC(7) chains along [201].
Related literature
For uses of levulinic acid, see: Timokhin et al. (1999). For density functional and Møller–Plesset perturbation theory calculations for levulinic acid, see: Reichertet al.(2010); Kim et al.(2011). For typical bond lengths and angles, see: Allenet al. (1987); Borthwick (1980). For hydrogen-bond motifs, see: Bernsteinet al.(1995); Etteret al.(1990). For background to the study, see: Flakus & Hachuła (2008); Flakus & Stachowska (2006).
Experimental
Crystal data
C5H8O3
Mr= 116.11 Monoclinic,P21=c
a= 4.8761 (2) A˚
b= 12.1025 (4) A˚
c= 9.8220 (3) A˚ = 99.112 (3)
V= 572.31 (3) A˚3
Z= 4
MoKradiation = 0.11 mm1
T= 100 K
0.440.210.16 mm
Oxford Diffraction Xcalibur diffractometer with a Sapphire3 detector
Absorption correction: multi-scan (CrysAlis RED; Oxford
Diffrac-tion, 2006)
Tmin= 0.585,Tmax= 1.000 7178 measured reflections 1013 independent reflections 902 reflections withI> 2(I)
Rint= 0.034
Refinement
R[F2> 2(F2)] = 0.040
wR(F2) = 0.114
S= 1.06 1013 reflections 77 parameters
H atoms treated by a mixture of independent and constrained refinement
max= 0.23 e A˚ 3 min=0.24 e A˚3
Table 1
Hydrogen-bond geometry (A˚ ,).
D—H A D—H H A D A D—H A
O1—H1 O3i
0.83 (2) 1.87 (2) 2.6977 (13) 176 (2)
Symmetry code: (i)x1;yþ1 2;zþ
1 2.
Data collection: CrysAlis CCD (Oxford Diffraction, 2006); cell refinement: CrysAlis RED (Oxford Diffraction, 2006); data reduc-tion:CrysAlis RED; program(s) used to solve structure:SHELXS97
(Sheldrick, 2008); program(s) used to refine structure:SHELXL97
(Sheldrick, 2008); molecular graphics:Mercury(Macraeet al., 2006); software used to prepare material for publication:publCIF(Westrip, 2010).
Supplementary data and figures for this paper are available from the IUCr electronic archives (Reference: FF2114).
References
Allen, F. A., Kennard, O., Watson, D. G., Brammer, L., Orpen, A. G. & Taylor, R. (1987).J. Chem. Soc. Perkin Trans. 2, pp. S1–19.
Bernstein, J., Davies, R. E., Shimoni, L. & Chang, N.-L. (1995).Angew. Chem. Int. Ed. Engl.34, 1555–1573.
Borthwick, P. W. (1980).Acta Cryst.B36, 628–632.
Etter, M. C., MacDonald, J. C. & Bernstein, J. (1990).Acta Cryst.B46, 256–262. Flakus, H. & Hachuła, B. (2008).Chem. Phys.B345, 49–64.
Flakus, H. & Stachowska, B. (2006).Chem. Phys.B330, 231–244.
Kim, T., Assary, R. S., Curtiss, L. A., Marshall, C. L. & Stair, P. C. (2011).J. Raman Spectrosc.42, 2069–2076.
Macrae, C. F., Edgington, P. R., McCabe, P., Pidcock, E., Shields, G. P., Taylor, R., Towler, M. & van de Streek, J. (2006).J. Appl. Cryst.39, 453–457. Oxford Diffraction (2006). CrysAlis CCD and CrysAlis RED. Oxford
Diffraction Ltd, Wrocław, Poland.
Reichert, D., Montoya, A., Liang, X., Bockhorn, H. & Haynes, B. S. (2010).J. Phys. Chem. A,114, 12323–12329.
Sheldrick, G. M. (2008).Acta Cryst.A64, 112–122.
Timokhin, B. V., Baransky, V. A. & Eliseeva, G. D. (1999).Russ. Chem. Rev.68, 73–84.
Westrip, S. P. (2010).J. Appl. Cryst.43, 920–925.
Structure Reports
Online
supporting information
Acta Cryst. (2013). E69, o1406 [doi:10.1107/S1600536813021090]
Levulinic acid
Barbara Hachu
ł
a, Anna Polasz, Marzena Dzida, Maria Nowak and Joachim Kusz
S1. Comment
Levulinic acid [systematic name: 4-oxopentanoic acid], (I), is a biogenic product of hexose acid hydrolysis at elevated
temperatures that can be obtained from renewable resources. This functionalized carbon structure is widely used as
chemical intermediate in the manufacture of fuel extenders, biodegradable polymers, herbicides, antibiotics, flavours and
useful 5-carbon compounds (Timokhin et al., 1999; Reichert et al., 2010). Levulinic acid was investigated in a
continuation of our studies of the IR spectra of hydrogen bonding in carboxylic acid derivatives (Flakus & Stachowska,
2006; Flakus & Hachuła, 2008). In order to study interactions occurring via hydrogen bonds and molecular packing in
this compound, we have now determined the structure of (I) using diffraction data collected at 100 K.
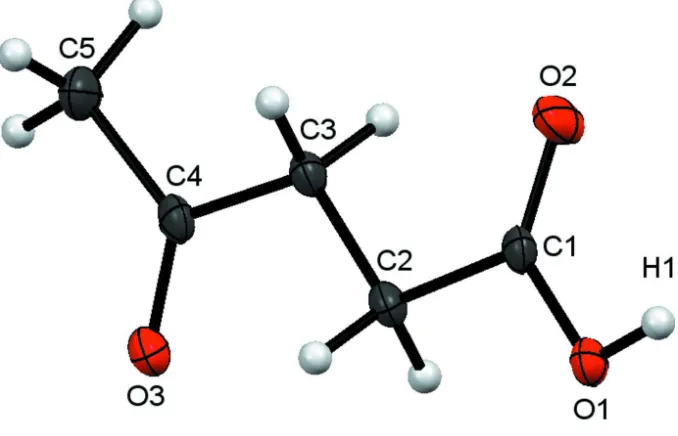
The molecule of (I) is nearly planar (r.m.s. deviation of fitted all non-hydrogen atoms is equal to 0.0762 Å). The C—O
(1.3373 (17) Å) and C=O (1.2044 (17) Å) bond distances differ slightly from the mean values given by Allen et al. (1987)
for a variety of carboxylic acid groups (C—O 1.308 Å and C=O 1.214 Å). The bond-angle values at the central C atom in
the carboxylic acid group of (I) (O2—C1—C2 124.51 (13) °; O1—C1—C2 112.48 (12)°) agree well with the mean
values specified by Borthwick (1980) for a typical carboxylic acid group (O2—C1—C2 123 (2)°; O1—C1—C2
112 (2)°).
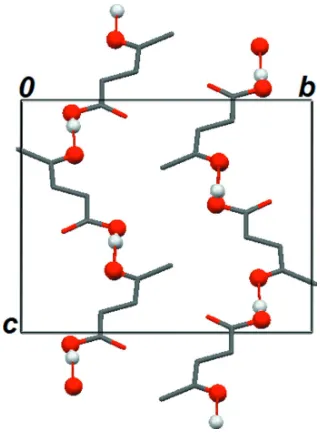
The monoclinic structure of (I) is composed of molecular sheets stacked along [101] direction. Atom O1 of the
carboxy-lic group acts as a hydrogen-bond donor via H1 to carbonyl atom O3 belonging to the acetyl group of adjacent molecule.
This interaction generates hydrogen-bonded chain with a graph-set motif of C(7) (Etter et al., 1990; Bernstein et al.,
1995).
S2. Experimental
Levulinic acid was purchased from Aldrich-Sigma. Crystals of title compound, suitable for X-ray diffraction, were
selected directly from purchased sample.
S3. Refinement
The H atoms were introduced in geometrically idealized positions and allowed for with an appropriate riding model with
C—H distances of 0.99 Å (CH2) and Uiso(H) values set at 1.2Ueq(C) or 0.98 Å (CH3) and with Uiso(H) values set at
1.5Ueq(C). The H atom which takes part in hydrogen bonding was located in a difference Fourier map and was refined
Figure 1
The asymmetric unit of (I), with the atom-numbering scheme, showing 50% probability displacement ellipsoids. H atoms
Figure 2
Part of the crystal structure of (I), viewed along the a axis, showing the C(7) chains. The red lines indicate the
hydrogen-bonding interactions. For the sake of clarity, all H atoms bonded to C atoms were omitted.
4-Oxopentanoic acid
Crystal data
C5H8O3
Mr = 116.11 Monoclinic, P21/c
Hall symbol: -P 2ybc
a = 4.8761 (2) Å
b = 12.1025 (4) Å
c = 9.8220 (3) Å
β = 99.112 (3)°
V = 572.31 (3) Å3
F(000) = 248
Dx = 1.348 Mg m−3
Melting point = 303–306 K Mo Kα radiation, λ = 0.71073 Å Cell parameters from 6623 reflections
θ = 3.4–34.5°
µ = 0.11 mm−1
T = 100 K
Oxford Diffraction Xcalibur
diffractometer with a Sapphire3 detector Radiation source: fine-focus sealed tube Graphite monochromator
Detector resolution: 16.0328 pixels mm-1
ω scan
Absorption correction: multi-scan
(CrysAlis RED; Oxford Diffraction, 2006)
Tmin = 0.585, Tmax = 1.000
7178 measured reflections 1013 independent reflections 902 reflections with I > 2σ(I)
Rint = 0.034
θmax = 25.1°, θmin = 3.4°
h = −5→4
k = −14→14
l = −11→11
Refinement
Refinement on F2
Least-squares matrix: full
R[F2 > 2σ(F2)] = 0.040
wR(F2) = 0.114
S = 1.06 1013 reflections 77 parameters 0 restraints
Primary atom site location: structure-invariant direct methods
Secondary atom site location: difference Fourier map
Hydrogen site location: inferred from neighbouring sites
H atoms treated by a mixture of independent and constrained refinement
w = 1/[σ2(F
o2) + (0.0797P)2 + 0.128P]
where P = (Fo2 + 2Fc2)/3
(Δ/σ)max < 0.001
Δρmax = 0.23 e Å−3
Δρmin = −0.24 e Å−3
Special details
Experimental. CrysAlis RED (Oxford Diffraction, 2006). Empirical absorption correction using spherical harmonics,
implemented in SCALE3 ABSPACK scaling algorithm.
Geometry. All e.s.d.'s (except the e.s.d. in the dihedral angle between two l.s. planes) are estimated using the full covariance matrix. The cell e.s.d.'s are taken into account individually in the estimation of e.s.d.'s in distances, angles and torsion angles; correlations between e.s.d.'s in cell parameters are only used when they are defined by crystal symmetry. An approximate (isotropic) treatment of cell e.s.d.'s is used for estimating e.s.d.'s involving l.s. planes.
Refinement. Refinement of F2 against ALL reflections. The weighted R-factor wR and goodness of fit S are based on F2,
conventional R-factors R are based on F, with F set to zero for negative F2. The threshold expression of F2 > σ(F2) is used
only for calculating R-factors(gt) etc. and is not relevant to the choice of reflections for refinement. R-factors based on F2
are statistically about twice as large as those based on F, and R- factors based on ALL data will be even larger.
Fractional atomic coordinates and isotropic or equivalent isotropic displacement parameters (Å2)
x y z Uiso*/Ueq
O1 0.4194 (2) 0.16988 (8) 1.05179 (10) 0.0186 (3)
O2 0.3930 (2) 0.35384 (9) 1.06449 (12) 0.0286 (4)
O3 1.0589 (2) 0.31839 (8) 0.73324 (10) 0.0197 (3)
C1 0.4836 (3) 0.27238 (11) 1.01688 (14) 0.0159 (4)
C2 0.6782 (3) 0.27359 (12) 0.91177 (14) 0.0164 (4)
H2A 0.5932 0.2323 0.8288 0.020*
H2B 0.8537 0.2361 0.9505 0.020*
C3 0.7411 (3) 0.39098 (12) 0.87113 (14) 0.0170 (4)
H3A 0.5641 0.4276 0.8328 0.020*
H3B 0.8221 0.4319 0.9552 0.020*
C4 0.9364 (3) 0.39950 (11) 0.76733 (13) 0.0163 (4)
C5 0.9722 (3) 0.51213 (13) 0.70857 (16) 0.0242 (4)
H5B 0.9909 0.5671 0.7827 0.036*
H5C 0.8097 0.5299 0.6398 0.036*
H1 0.311 (4) 0.1766 (16) 1.108 (2) 0.036*
Atomic displacement parameters (Å2)
U11 U22 U33 U12 U13 U23
O1 0.0253 (6) 0.0186 (6) 0.0137 (5) −0.0011 (4) 0.0093 (4) 0.0006 (4)
O2 0.0435 (7) 0.0204 (6) 0.0275 (7) 0.0010 (5) 0.0231 (5) −0.0016 (5)
O3 0.0240 (6) 0.0218 (6) 0.0148 (5) 0.0025 (4) 0.0072 (4) 0.0001 (4)
C1 0.0200 (7) 0.0187 (7) 0.0088 (7) −0.0002 (6) 0.0020 (5) 0.0003 (5)
C2 0.0202 (7) 0.0187 (8) 0.0112 (7) 0.0017 (5) 0.0050 (5) −0.0009 (5)
C3 0.0218 (7) 0.0183 (8) 0.0118 (7) −0.0002 (5) 0.0060 (6) −0.0015 (5)
C4 0.0183 (7) 0.0207 (8) 0.0092 (7) 0.0000 (5) 0.0001 (5) −0.0016 (6)
C5 0.0334 (8) 0.0224 (8) 0.0195 (8) 0.0008 (6) 0.0125 (6) 0.0036 (6)
Geometric parameters (Å, º)
O1—C1 1.3373 (17) C3—C4 1.5050 (19)
O1—H1 0.83 (2) C3—H3A 0.9900
O2—C1 1.2044 (17) C3—H3B 0.9900
O3—C4 1.2231 (17) C4—C5 1.501 (2)
C1—C2 1.5092 (19) C5—H5A 0.9800
C2—C3 1.520 (2) C5—H5B 0.9800
C2—H2A 0.9900 C5—H5C 0.9800
C2—H2B 0.9900
C1—O1—H1 106.3 (14) C4—C3—H3B 108.6
O2—C1—O1 123.01 (13) C2—C3—H3B 108.6
O2—C1—C2 124.51 (13) H3A—C3—H3B 107.6
O1—C1—C2 112.48 (12) O3—C4—C5 122.14 (13)
C1—C2—C3 111.32 (12) O3—C4—C3 121.30 (12)
C1—C2—H2A 109.4 C5—C4—C3 116.57 (12)
C3—C2—H2A 109.4 C4—C5—H5A 109.5
C1—C2—H2B 109.4 C4—C5—H5B 109.5
C3—C2—H2B 109.4 H5A—C5—H5B 109.5
H2A—C2—H2B 108.0 C4—C5—H5C 109.5
C4—C3—C2 114.68 (12) H5A—C5—H5C 109.5
C4—C3—H3A 108.6 H5B—C5—H5C 109.5
C2—C3—H3A 108.6
O2—C1—C2—C3 −1.2 (2) C2—C3—C4—O3 −8.66 (18)
O1—C1—C2—C3 178.42 (10) C2—C3—C4—C5 171.36 (11)
D—H···A D—H H···A D···A D—H···A
O1—H1···O3i 0.83 (2) 1.87 (2) 2.6977 (13) 176 (2)