International Doctorate School in Information and Communication Technologies
DISI - University of Trento
Multimedia Content Analysis
for Event Detection
Andrea Rosani
Advisor:
Prof. Francesco G.B. De Natale Universit`a degli Studi di Trento
The wide diffusion of multimedia contents of different type and format led
to the need of effective methods to efficiently handle such huge amount of
in-formation, opening interesting research challenges in the media community.
In particular, the definition of suitable content understanding
methodolo-gies is attracting the effort of a large number of researchers worldwide, who
proposed various tools for automatic content organization, retrieval, search,
annotation and summarization. In this thesis, we will focus on an
impor-tant concept, that is the inherent link between ”media” and the ”events”
that such media are depicting. We will present two different methodologies
related to such problem, and in particular to the automatic discovery of
event-semantics from media contents. The two methodologies address this
general problem at two different levels of abstraction. In the first approach
we will be concerned with the detection of activities and behaviors of people
from a video sequence (i.e., what a person is doing and how), while in the
second we will face the more general problem of understanding a class of
events from a set visual media (i.e., the situation and context). Both
prob-lems will be addressed trying to avoid making strong a-priori assumptions,
i.e., considering the largely unstructured and variable nature of events.
As to the first methodology, we will discuss about events related to the
behavior of a person living in a home environment. The automatic
under-standing of human activity is still an open problems in the scientific
com-munity, although several solutions have been proposed so far, and may
pro-vide important breakthroughs in many application domains such as
in this thesis, providing (i) a compact representation of human activities,
and (ii) an effective tool to reliably measure the similarity between activity
instances. In particular, the activity pattern is modeled with a signature
obtained through a symbolic abstraction of its spatio-temporal trace,
allow-ing the application of high-level reasonallow-ing through context-free grammars
for activity classification.
As far as the second methodology is concerned, we will address the problem
of identifying an event from single image. If event discovery from media is
already a complex problem, detection from a single still picture is still
con-sidered out-of-reach for current methodologies, as demonstrated by recent
results of international benchmarks in the field. In this work we will focus
on a solution that may open new perspectives in this area, by providing
bet-ter knowledge on the link between visual perception and event semantics.
In fact, what we propose is a framework that identifies image details that
allow human beings identifying an event from single image that depicts it.
These details are called ”event saliency”, and are detected by exploiting
the power of human computation through a gamification procedure. The
resulting event saliency is a map of event-related image areas containing
sufficient evidence of the underlying event, which could be used to learn the
visual essence of the event itself, to enable improved automatic discovery
techniques.
Both methodologies will be demonstrated through extensive tests using
pub-licly available datasets, as well as additional data created ad-hoc for the
specific problems under analysis.
There are many persons that I would like to thank, for different reasons. I would like to express my gratitude to the staff of the Multimedia Sig-nal Processing and Understanding research group, in particular to Prof. Francesco De Natale, Dr. Giulia Boato and Dr. Nicola Conci, who helped me a lot in these past years, making it possible to restart my study activity after some years of work, opening new possibilities for the future of my job. A particular thanks goes to the people I met, who helped me with their comments and suggestion, or just sharing the time of this experience, in particular Duc Tien, Valentina, Paolo, Cecilia, Krishna, Mattia, Alfredo, and Nicola.
A huge hug goes to my family, to my wife Maria Stella and my daughter Letizia, for their unconditioned support and love. To my Dad, who watches over me from the ”high mountains”. To my Mum, my sister Laura and her family. To Margherita who helped us a lot.
1 Introduction 1 1.1 Activity modeling and matching for human behavior
under-standing from video . . . 2
1.2 Content mining for social event detection . . . 5
1.3 Structure of the Thesis . . . 8
2 Context-Free Grammars for Activity Modeling and Match-ing 9 2.1 Background . . . 10
2.2 Motivations . . . 14
2.3 Proposed Framework . . . 15
2.3.1 Context Free Grammar formalism . . . 16
2.3.2 Activity representation . . . 17
2.3.3 CFG Rules Discovery . . . 18
2.3.4 Parsing the CFG . . . 22
2.4 Datasets for Human behavior analysis . . . 25
2.5 A Context-Free Grammar behavior analysis tool . . . 26
2.5.1 Ubicomp dataset . . . 29
2.5.2 Home environment . . . 32
2.5.3 Office environment . . . 34
2.6 Real time behavior analysis in compressed domain . . . 36
Comparison . . . 39
Reconfiguration . . . 39
3 Event identification using Games With a Purpose 41 3.1 Background . . . 42
3.1.1 Event-based media analysis . . . 42
3.1.2 Gamification in media analysis . . . 45
3.2 Event Saliency . . . 49
3.2.1 EventMask . . . 50
Game Mechanics . . . 52
Scoring system . . . 53
3.2.2 Event-saliency map generation . . . 55
3.3 Results . . . 59
3.3.1 Datasets and Experiments . . . 60
3.3.2 Assessment of the Event-Saliency Maps . . . 66
3.3.3 Discussion . . . 70
4 Conclusions 73
2.1 Sensor remapping. . . 31 2.2 Confusion Matrix using the proposed framework on the
“Ubi-comp dataset”. The values are percentages . . . 31 2.3 Comparison of obtained results respect [100]. . . 32 2.4 Classification accuracy using positive samples only. . . 33 2.5 Classification accuracy considering positive and negative
sam-ples. . . 33 2.6 Average classification accuracy after one learning stage. . . 34 2.7 Average classification accuracy after re-training. . . 34 2.8 Classification accuracy using positive samples only. . . 35 2.9 Classification accuracy considering positive and negative
sam-ples. . . 35 2.10 Average classification accuracy after one learning stage. . . 36 2.11 Average classification accuracy after re-training. . . 36 2.12 Performance of the algorithm on the dataset [8]. . . 38 2.13 Comparison to the state of the art approaches described in[37]. 38 3.1 Game scoring . . . 55 3.2 Event-saliency individual users’ masks evaluation . . . 67 3.3 Event-saliency maps evaluation: average percentage of event
1.1 Examples of variability in tracks. . . 4 1.2 Which is the event associated to this picture? Visual
ele-ments that allow answering the question have been removed, making it almost impossible to guess. We define such infor-mation event saliency, to distinguish it from the classical
visual saliency. . . 7
2.1 Examples of variability in human actions for two different activities: left image represent a sample for the action “Have a rest” and the right a sample of “Cooking”. Solid lines indi-cate the reference path, while dashed lines refer to different subjects performing that action in real-life. a, b, c, etc.
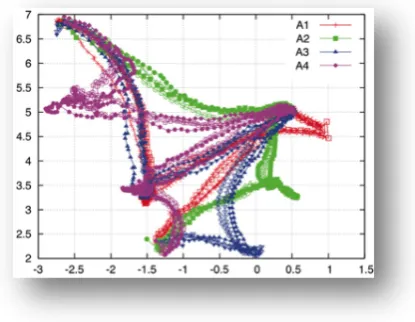
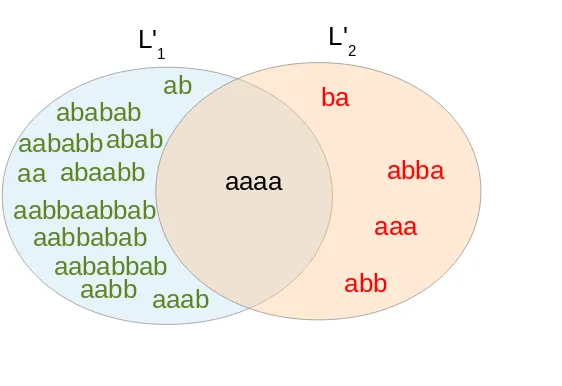
represent the labels for Hot Spots. . . 17 2.2 Intersection between languages L1 = L(P1) and L2 = L(P2)
generated by positive samples only. . . 21 2.3 Intersection between languages L01 = L(P10) and L02 = L(P20)
generated by positive and negative samples . . . 23 2.4 Activity spotting examples: (a) 2 consecutive sequences; (b)
hierarchy between two activities; (c) two nested activities with noisy symbols; (d) two overlapping activities with noisy
Hot Spots are provided with the corresponding legend; Bot-tom: views of the environment from the two installed
cam-eras (Cam1 left, Cam2 right). . . 27
2.6 Top: map of the office environment and camera positions. Hot Spots are provided with the corresponding legend; Bot-tom: views of the environment from the two installed
cam-eras (Cam1 left, Cam2 right). . . 28
2.7 Ubicomp dataset. Map of the considered environment, with
sensor labels. . . 30
2.8 Fall detection and subsequent reconfiguration of the camera
for better view. . . 40
3.1 Comparison between event saliency and visual saliency. Panel (a) represents the reference image; panel (b) has the same image where event salient areas are covered by a mask, re-sulting in a not intuitive association of the image to a specific event; panel (c) shows a second version of the masked image, where visual salient areas are covered: despite this, details
crucial for the event recognition are still visible. . . 49
3.2 Screenshot of the application showing an example of mask-ing procedure. Images are prompted to players and they should hide with a tool the most relevant parts related to
are represented along with the corresponding result on the global map, according to the procedure of weighting and fu-sion described in Equations (2) and (3), respectively. Panel (a) shows an example of starting masked image (left) with the first generated map (right), panel (b) shows the sec-ond mask considered (left) with the correspsec-onding result on the global map (right), panel (c) reports an example (taken among those generated) of “art” mask (left) and its reduced influence on the map (right), and panel (d) shows the
origi-nal image (left) with the fiorigi-nal event saliency map (right). . 57 3.4 Results on MediaEval SED dataset [87]. . . 63 3.5 Results on EiMM dataset [64]. . . 65 3.6 Example of masked images, using the binary event saliency
map superimposed on the original images, considering the same events represented in Figures 3.4 and 3.5. w repre-sent the percentage of recognition of the event during the
evaluation carried out. . . 68 3.7 Examples of automatically generated maps compared with
Multimedia data gained an important role in recent years, thanks also to the advances in communications, computing and storage technology. The potential of multimedia became fundamental in improving the pro-cesses in different fields like surveillance, wearable computing, biometrics, and remote sensing, but also in advertising and marketing, education and training, entertainment, medicine.
The wide diffusion of multimedia content has evidenced new require-ments for more effective access to global information repositories. Content analysis, indexing, and retrieval of multimedia data are one of the most challenging and fastest growing research areas. A consequence of the in-creasing consumer demand for multimedia information is that sophisticated technology is needed for representing, modeling, indexing, and retrieving multimedia data. In particular, there is the need of robust techniques to index/retrieve and compress multimedia information, new scalable brows-ing algorithms allowbrows-ing access to very large multimedia databases, and semantic visual interfaces integrating the above components into unified multimedia browsing and retrieval systems.
high variability of human behaviors, gap between visual appearance and scene semantics.
One of the major concept shared by different multimedia analysis frame-works is the description of events represented in such data, in order to pro-vide information about the content of the media. In fact, whatever they are personal experiences, such as a wedding or a birthday, or large social hap-penings, such as a concert or a football match, events mark our lives and memories. Moreover, event recognition is a crucial task to provide high-level semantic description of the video content. The bag-of-words (BoW) approach has proven to be successful for the categorization of objects and scenes in images, but it is unable to model temporal information between consecutive frames.
In this work we will discuss about the problem multimedia content anal-ysis addressing in particular two sub-problems: the modeling and match-ing of activities for human behavior understandmatch-ing from video; the content mining for social event detection from still images.
1.1
Activity modeling and matching for human
be-havior understanding from video
as it can be typically associated to a sequence of characteristic elements, behaviors imply a joint analysis of content and context, thus providing a semantically richer description of the event. For example the activity of “running” is considered a natural behavior on a soccer field, while it would be reported as suspicious if detected inside a bank office.
Among the different approaches proposed in literature to detect activi-ties and behaviors [26], video analysis is often preferred because of its lim-ited cost of installation and maintenance, and lower obtrusiveness. Video data contain a lot of significant information to infer human behaviors, in-cluding location, posture, motion, as well as interaction with objects, other people, and the environment [10]. In this context, motion patterns are probably the most popular descriptor for many reasons: they are rather easy and fast to calculate, robust, and especially, they can be captured even in far range and from different perspectives, where posture analysis or object detection may fail [84] [42].
The motion pattern of a moving object (often associated to its trajec-tory) is defined as the spatio-temporal evolution of one or more feature points extracted from the visual sequence. In particular, when tracking humans, a convenient representation of the motion trajectory is the one that maps the centroid of the bounding box retrieved by the tracking al-gorithm on the ground plane, which becomes the reference system.
The research in this area has been very active in the past decades, and very efficient detectors and tracking algorithms have been proposed [69]. Usually, the output consists of a trajectory T, namely a raw set of coordinates (Fig. 1.1 associated to a temporal reference for each moving target in the scene, as recalled in (1.1), wherePi = (xi, yi) and i is a frame
counter.
Figure 1.1: Examples of variability in tracks.
Although very basic, this representation makes it possible to perform a simple yet effective low-level classification of the incoming samples by matching them with a set of pre-stored templates [83] [95]. These ap-proaches provide good results especially when the environment is known and motion patterns are rather constrained, such as in vehicular traffic monitoring. Instead, when the variety and diversity of patterns is higher, the performance of low-level analysis drops [55], due to the increasing noise and uncertainty in the numerical representation that hinders a reliable matching. Human behaviors fall into this category of events, because of their high variability and largely unconstrained nature.
to key points or objects). They can be easily made invariant to transla-tion, rotatransla-tion, and scaling [69]. This makes symbolic approaches suitable for both activity detection, where the syntax of symbol chains is consid-ered, and behavior analysis, where additional attributes may be exploited to interpret more sophisticated scenarios.
In this work we propose a framework for human behavior analysis in indoor environments using Context-Free Grammars (CFGs). Activities are modeled considering the prominent areas of the environment visited by the subject. Compared to other existing approaches that use CFGs for activity modeling and matching, our method provides several important novelties. First of all, it classifies the events considering both positive and negative samples, thus ensuring a better separation of the classes while maintaining good generalization properties. Second, we introduce a re-training procedure, in order to update the grammar rules in presence of changes in the environmental setup or in the users’ habits. Finally, we introduce the capability of dealing with concatenated or nested actions. According to the definition provided at the beginning of the section, we will use the termbehavioral analysis not only to refer to the mere detection of the activity performed by the individual (what), but also to consider the semantic connotation of such activity (why and how).
1.2
Content mining for social event detection
Recent studies demonstrate that users find it easier to search and browse media archives when they are organized according to underlying events [108]. Many works propose the use of event models to enable efficient media indexing and retrieval (see, e.g., [66][64][96]), and some interesting prototypes have also appeared [1][3].
tra-Figure 1.2: Which is the event associated to this picture? Visual elements that allow answering the question have been removed, making it almost impossible to guess. We define such informationevent saliency, to distinguish it from the classicalvisual saliency.
ditional visual saliency. In fact, visual saliency typically highlights the part of a picture that grabs users’ attention at a first glance [34]. This is generally connected to the brightness of colors, the contrast, the position, the prominence and, in general, the image syntax. On the contrary, event saliency captures the picture areas that are related to the event indepen-dently of their visual prominence, and is therefore concerned with image semantics. Event saliency may include part of the background, a periph-eral image area, or a small but revealing detail. The idea is illustrated in Fig. 1.2, where the black box exactly hides the detail that would make possible recognizing the event.
The choice of performing this task through gamification (i.e., the use of game mechanics and game design techniques in non-game contexts) was driven by the consideration that this strategy has been proven to be suc-cessful in solving complex problems that require human intervention [104]. With respect to crowdsourcing, a well-studied gamification approach is more engaging and entertaining, thus attracting more users with higher commitment and less bias. In this work we show how a carefully designed game allowed creating a significant collection of accurate event saliency maps out of a dataset of representative images associated to a set of com-mon events. To achieve this goal, we involved a large community of users in an adversarial game, where the real objective (producing the maps) was hidden.
In Ch. 3 we introduce the event saliency, as the collection of perceptual elements contained in an image that allow humans recognizing the depicted event. Furthermore, we propose EventMask, a GWAP conceived to detect event saliency in event-related pictures.
1.3
Structure of the Thesis
ing and Matching
Automatic recognition of human activities and behaviors is still a chal-lenging problem due to many reasons, including limited accuracy of the data acquired by sensing devices, high variability of human behaviors, gap between visual appearance and scene semantics. Symbolic approaches can significantly simplify the analysis, turning raw data into chains of mean-ingful patterns. This allows getting rid of most of the clutter produced by low-level processing operations, embedding significant contextual in-formation into the data, as well as using simple syntactic approaches to perform the matching between incoming sequences and models. In this context we propose a symbolic approach to learn and detect complex activ-ities through sequences of atomic actions. Compared to previous methods based on Context Free Grammars (CFGs), we introduce several important novelties, such as the capability to learn actions based on both positive and negative samples, the possibility of efficiently re-training the system in the presence of misclassified or unrecognized events, the use of a parsing procedure that allows correctly detecting the activities also when they are concatenated and/or nested one with each other. Experimental validation on three datasets with different characteristics demonstrates the robustness of the approach in classifying complex human behaviors.
known indoor environment, in order to acquire knowledge about his/her behavior. This information is very important in situation where there is the need to monitor person’s activity, like in home care (e.g. fall detection), as well as when the system should be able to rise up an alert depending on a substantial difference in users habits, like in video-surveillance (e.g. robber detected using abnormal behavior). We will achieve this goal by modeling human motion patterns through Context-Free Grammars (CFGs). It will be demonstrated that the proposed strategy allows not only to acquire and recognize the examples provided during the training phase, but also to generalize them, thus being able to detect instances of the activities that have not been included in the training set.
2.1
Background
High-level reasoning based on symbolic representations of the scene under investigation could provide effective results in behavioral analysis. Some of the most significant approaches proposed in this context are summarized in the following paragraphs.
seman-tics contained in the motion trajectories, introducing a Rao-Blackwellised particle filter in the recognition process to achieve real-time performances. Through this approach, the actions of a subject are learned from an un-segmented training set.
The authors in [59] propose a scalable approach that includes two major modules: a low-level action detector to process low-level data using a Dy-namic Bayesian Network (DBN), and a Viterbi-based inference algorithm used to maintain the most likely activity given the DBN status and the output of the low-level detectors.
The main advantage of these methods is in the capability of handling the uncertainties generated during the low-level processing. On the other hand, as the event complexity increases, the recognition performance dramati-cally drops, due to a combination of factors including insufficient training data, semantic ambiguity in the model, or temporal ambiguity in com-peting hypothesis. Although some methods for unsupervised parameter estimation of the graphical model have been proposed (see [19]), the major problem remains the definition of the network topology, which is usually too complex to be learned automatically, requiring the help of human op-erators.
of a-priori knowledge about the temporal structure of events.
In [67] a system is proposed to generate detailed annotations of complex human behaviors performing the Towers of Hanoi through a parameter-ized and manually-defined stochastic grammar. In [68] the authors also use SCFGs to extract high-level behaviors from video sequences, in which multiple subjects can perform different separable activities. An alternative approach is proposed in [93]. Here, the so-called attribute grammars [56] are employed as descriptors for features that can not be easily represented by finite symbols.
A common drawback of the systems relying on formal grammars is in the definition and update of the production rules. In fact, an exhaustive for-malization and structuring of the observable activities that a person can perform in everyday life is not practical [74]. For this reason, in [45] a com-putational framework is proposed, able to recognize behaviors in a mini-mally supervised manner, relying on the assumption that everyday activi-ties can be encoded through their local event subsequences, and assuming that this encoding is sufficient for activity discovery and classification.
Another major limitation of SCFG-based systems is that the parsing strategy can handle only sequential relations between sub-events, being unable to capture the parallel temporal relations that often exist in complex events. To overcome this issue, the authors of [112] propose to derive the terminal symbols of a SCFG from motion trajectories. In particular, they transform them into a set of basic motion patterns (primitives) taken as terminals for the grammar. Then, a rule induction algorithm based on the Minimum Description Length (MDL) derives the spatio-temporal structure of the event from the primitive stream.
iteratively decomposed in expressions and contexts. Intuitively, given the entire set of training sentences, the algorithm searches for frequent combi-nations of expressions and contexts, and interprets them as a grammatical type.
However, the main drawback of this approach is that the generalization properties of the grammar cannot be controlled during training. The more diverse are the examples proposed in input, the larger becomes the final set of patterns that satisfies the grammar. In fact, part of these patterns do not belong to the training, but arise from generalization. It is then possible that unwanted expressions satisfy the resulting grammars .
Moreover, given two grammars generated from disjoint training sets, it is not guaranteed that their overlap is null, implying that, due to general-ization, it is not possible to guarantee the separation of languages. If the grammars are used to classify the symbol strings, this means that there will be a subset of strings that will fit multiple classes.
A very detailed overview about the literature in the field can be found in [7]. For the sake of completeness, we report hereafter a short summary about the most relevant benefits of CFG-based approaches in activity and behavior modeling compared to other competing algorithms [110]:
• ability to model the hierarchical structure of events, which is difficult to capture with graphical models such as HMM;
• ability to take into account temporal relationships, so that long-term activities can be considered;
• capability of describing sequential features, resulting in a more efficient representation if compared to that obtained via bag of features;
• simpler understanding compared to other knowledge driven models based on ontology (VERL [39], VEML [75]).
2.2
Motivations
The proposed framework stems from a recent work in this area [28] and extends it by introducing a more sophisticated learning strategy. In fact, behavior classes are in general not well separated, especially in the case of indoor or home monitoring, due to the high variability of human behaviors. Fig. 2.1 provides an example, referring to two different home activities, each one associated to an ideal model (the trajectory described by the solid line). Dashed lines report the actual behavior of two subjects performing the same actions in real life. It is possible to observe that these behaviors show non-negligible spatio-temporal differences compared to the model, leading to potential errors when using simple approaches based on the matching with pre-stored templates.
Results have been presented in [88] [89], [90], exploiting the properties of a Context Free Grammar originally developed for Natural Language Processing [98]. In these cases, grammars tend to overlap, and, for a single activity, multiple grammar rules may return a positive match. In the current approach, instead, we define a methodology to overcome the drift problem, by adopting a learning strategy that considers both positive and negative examples, and introducing a re-training stage, so as to improve the accuracy of the detection.
It will be shown that this procedure can avoid the overlapping of classes while learning the models, allowing a better generalization, and maintain-ing a good separation among them.
simply extend the knowledge of the system by feeding additional samples validated by the user into the learning procedure. In this way, false and missed alarms can be progressively learned in order to increase the accu-racy of the detector, as well as adapting to changes in both environmental conditions and users’ habits.
Finally, the proposed method allows processing the video stream in real time, as soon as the motion patterns are available, as it behaves like a symbolic parser [73], [11]. Thanks to the implemented parsing strategy, the method is also able to handle complex situations that typically de-grade the performances of traditional matching tools, such as the presence of concatenated or nested activities, namely, when an action is partially or totally executed within another one [36].
It is worth noting that the algorithm does not impose any specific tech-nology for data acquisition, which can be performed though various posi-tioning devices (video tracking, sensor networks [101], RFIDs, etc.), thus providing a completely customizable solution for indoor monitoring.
2.3
Proposed Framework
To cope with the issues mentioned in the previous section, the proposed method operates a significant simplification of the observed domain, as-sociating symbols only to a limited set of points of interest in the envi-ronment, called Hot Spots. Human actions are then described in terms of time-ordered sequences of such symbols. The obtained sequences are learned and recognized through Context-Free Grammars.
The most important steps of the proposed method can be summarized in the following points:
2. learning of the grammar sets that encode the rules for each set of training patterns;
3. classification of the incoming trajectories into the available rules, per-formed through parsing;
4. update of the grammar rules according to user feedback.
In this section, after briefly introducing the CFG formalism, we will provide a detailed description for each of the above mentioned items.
2.3.1 Context Free Grammar formalism
According to grammars theory, a set of strings over a finite set of symbols is defined as a language. A grammar is a tool that allows specifying which strings belong to a specific language.
A Context-Free Grammar (CFG) is defined as [72]:
G= (N, T, P, S) (2.1)
where N is a finite set of non-terminal symbols, T is a finite set of terminal symbols (N ∩ T = 0), P is a finite grammar of the form A → u (A ∈ N
and u ∈ (N ∪T)+), and S is the starting symbol (S ∈ N).
The set P derives a string of terminal labels w from a non-terminal symbol A, if there is a derivation tree A→ w with root A [72]. A language
L(G) of a CFG G is the set of all strings derived from the starting symbol
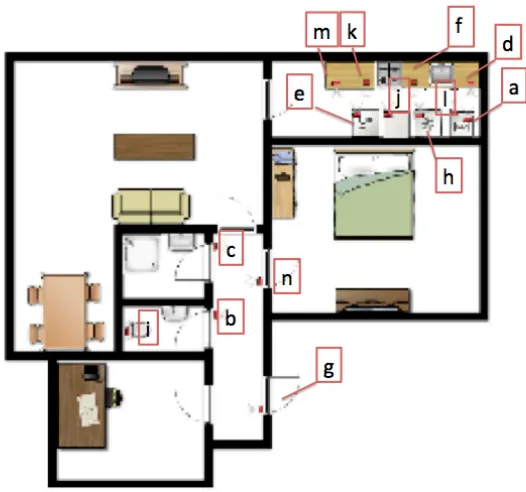
Living Room Area Kitchen Area c i n o b l m a d
g e f
Living Room Area Kitchen Area c i n o b l m a d
g e f
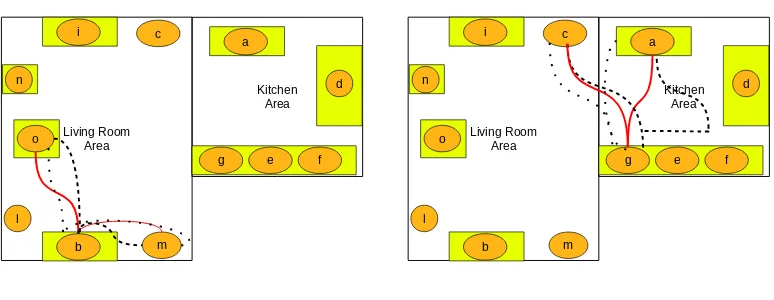
Figure 2.1: Examples of variability in human actions for two different activities: left image represent a sample for the action “Have a rest” and the right a sample of “Cooking”. Solid lines indicate the reference path, while dashed lines refer to different subjects performing that action in real-life. a, b, c, etc. represent the labels for Hot Spots.
2.3.2 Activity representation
In our approach we convert human motion patterns into temporal concate-nations of Hot Spots that the user has visited in a given time frame. We say that the user has visited aHot Spot if he/she has been in the proximity of it for a predefined temporal interval. Both proximity and visit time of each Hot Spot are application-driven and should be defined according to the environment and based on the user’s habits. As an example, operating a given appliance in a kitchen may request some time; a shorter stop at that location may therefore have a different meaning. Furthermore, older people may need longer time to perform the same action. Similarly, more stringent spatial requirements are necessary when moving in smaller rooms, compared, for example, to large exhibition areas. This allows simplifying the representation of (1.1) to a stream of symbols, each one associated to a pair (region-index, time-stamp) as in:
where Rj is the index of the Hot Spot and tj is the temporal reference.
Describing the path in terms of a sequence of Hot Spots rather than sam-pling it at fixed time intervals provides a twofold advantage: (i) it reduces noise and outliers in the trajectory caused by limited accuracy in acqui-sition and/or tracking, and (ii), it generates a simpler representation that preserves the significant spatio-temporal evolution of the activity, while making more tractable the next processing steps.
2.3.3 CFG Rules Discovery
Grammatical inference is a discipline related to a large number of fields, including machine learning and pattern recognition. It basically consists in feeding data into an entity, the learner, which returns a grammar capable of explaining it [32]. If we want our grammar to learn a particular concept associated to a given set of symbolic patterns, we should provide it as in-put to the learner, which will return as output a set of grammar rules that generate a language. If the input patterns are characterized by a certain level of diversity, i.e., diverse instances of the same concept, the grammar will learn all these possible variations, but will also provide a certain de-gree of generalization. As an example, let us consider the following input patterns:
• (ab);
• (abab);
• (aabb).
These patterns, can be exhaustively synthesized using the following gram-mar rules:
It can be easily seen that all three original strings satisfy this grammar. For instance, also the strings (aab), (ababab), and (abbb) are part of the language, although not present in the initial set of strings.
This problem is known in literature [28], and can be partially solved by introducing the possibility of providing counterexamples during the train-ing phase, by feedtrain-ing the learner with both positive and negative exam-ples, where negative examples can be used to separate the languages and to eliminate false positives.
To achieve this goal, we use a different learning algorithm, able to: (i) exploit both positive and negative samples as well as additional production rules in training, and (ii) allow the incremental learning of Context-Free Grammars.
For the first grammar generation our algorithm receives in input a la-beled set of positive and negative samples, and builds a grammar P such that all the strings labeled as positive, and no string labeled as negative, can be derived from P. Given a set of behaviors to be classified bj, j = 1, ..., J,
and a set of observed behavioral patterns tk, k = 1, ..., K, K J, we
create J clusters Ij such that:
Ij = IjP S ∪I N S
j (2.3)
where IjP S = [tk : tk ∈ bj]; IjN S = [tk : tk ∈/ bj] are the positive and
negative samples of the j-th behavior as classified by a supervisor. The grammar generation produces therefore a set of J grammars Pj, such that
each grammar will fulfill IjP S and not IjN S.
At any point of the operation of the classifier, when a certain number of patterns t∗k have been stored, for which the classification was not successful (either satisfying more than one grammar or none of them), the user may decide to run a re-training. In this case, the supervisor is again requested to manually classify the critical samples. Then, a new set of clusters Ij∗ is produced, and a new set of grammars Pj∗ is generated based on Ij∗. It is to be observed that the re-training starts from the previous grammars Pj
and processes the new samples only. Therefore the updated grammars Pj∗
will respect the rule Pj ∈ Pj∗.
In summary, the key features of the proposed system, as compared to other grammar-based behavior learning tools, are:
• CFGs are generated from positive and negative samples (possibility to limit grammar generalization and overlap);
• incremental learning of CFGs (possibility to easily do re-training, adding false positives and missed alarms in the training set as soon as an expert recognizes them).
The learning process described so far is illustrated by the following ex-ample, where we represent the positive and negative samples by the unit clauses of the form ps(w) and ns(w), where w is a string represented by an atom or a list of atoms [72]. The terminal symbols in the list are restricted to atoms other than p, q, r, ...z, which are used for non-terminal symbols. The symbol S is the starting symbol and the generated grammar is an unambiguous CFG in extended Chomsky normal form.
Let us consider two sets of positive samples only:
Set1 =ps(ab);ps(aa);ps(abab);ps(aabb);ps(ababab);ps(aababb);ps(aaab);ps(abaabb);
ps(aabbabab);ps(aabbaabbab);ps(aabaabbabb);
L1 L2
ab
ba abb
aaa
abba
aabb aa
aababb
abaabb aababbab
abab ababab aaab
aabbabab aabbaabbab
Figure 2.2: Intersection between languages L1 = L(P1) and L2 = L(P2) generated by
positive samples only.
Our algorithm, according to the description provided in the previous paragraphs, generates the following grammars:
P1 = S →aa;S →ab;S →Sa;S →Sb;S →bS
P2 = S →aa;S →aS;S →ba;S →bb;S →bS
As can be seen in Fig. 2.2, the two grammar rules P1 and P2
gener-ate two languages such that L1 ∩L2 6= 0 and, in particular, some of the
training samples belong to both languages. By introducing the use of neg-ative samples, we can overcome this situation, forcing the separation of the
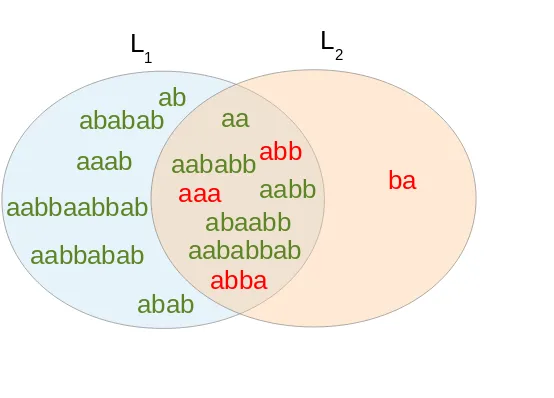
training samples. To this purpose we builtSet01 containing Set1 as positive
samples and Set2 as negative, and viceversa for Set02.
Set01 =ps(aa);ps(ab);ps(abab);ps(aabb);ps(ababab);ps(aababb);ps(aaab);ps(abaabb);
ps(aabbabab);ps(aabbaabbab);ps(aabaabbabb);
ns(ba);ns(aaa);ns(abb);ns(abba)
Set02 =ps(ba);ps(aaa);ps(abb);ps(abba);
ns(aa);ns(ab);ns(abab);ns(aabb);ns(ababab);ns(aababb);ns(aaab);ns(abaabb);
ns(aabbabab);ns(aabbaabbab);ns(aabaabbabb);
P10 = p→aS;p→bS;S →aa;S →ab;S →ap;S →bb;S →bp
P20 = p→aa;p→bb;S →ap;S→ba;S →Sa
this, we apply the update procedure described above. The misclassifica-tion of the atom (aaaa) will be considered initially as an error. In a second stage, it will be prompted to an evaluator that classifies it. The grammars are updated accordingly. Adding (aaaa) as a positive sample of Set2, will
lead, for example, a the new set of rules.
P100 = p→bS;q →aS;S→aa;S→ab;S →ap;S →qb;S →qp
P200 = p→aa;p→bb;p→ab;S →ba;S →Sa
2.3.4 Parsing the CFG
An appropriate parsing procedure has been defined in order to check the compliance of the input strings with the generated grammar P. The parser receives in input the symbols corresponding to the Hot Spots visited by the person in the monitored environment. Symbols are progressively stored in a buffer, which initial length is equal to the maximum length (K) of the grammar words used in the learning stage. The parser reads the symbols in the buffer, calculating all possible combinations, without repetition, of the considered string, until they reach the minimum possible dimension.
The number of combinations Nk to be considered for a string of length
1 ≤ k ≤ K can be computed as:
Nk =
K k
= K!
L'1 L'2
ab ba
abb aaa
abba
aabb aa
aababb abaabb
aababbab abab ababab
aaab aabbabab aabbaabbab
aaaa
Figure 2.3: Intersection between languages L01 = L(P10) and L02 = L(P20) generated by positive and negative samples
In this way, we ensure that in presence of complex actions, the parser is able to detect also nested and concatenated subsequences, which are removed from the input pattern as soon as they are associated to an action. Then, the parsing can proceed on the remaining symbols in the stack.
When an activity is detected, the associated symbols are removed from the buffer, new symbols are added to the parsing string until the buffer is filled, and the process iterates.
The symbols remaining in the buffer can represent either actions that have not been learned by the system (for instance, a new or a rare behavior) or anomalous patterns, possibly generated by noise. They can be signaled as errors or anomalies, or can be stored for successive learning phases (e.g., personalizing on a given user’s behavior).
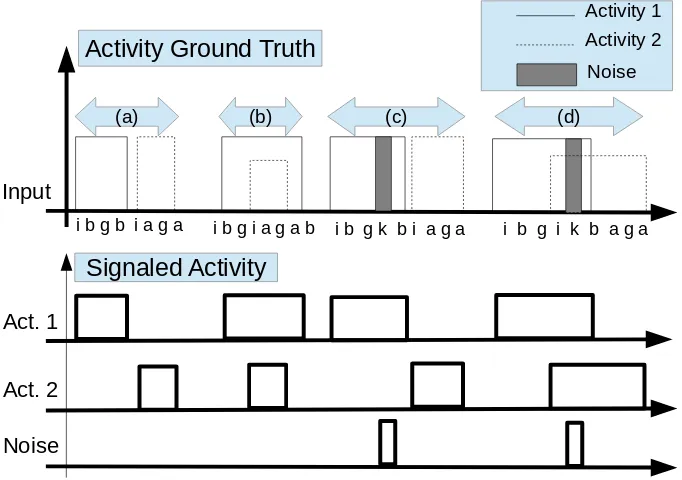
Activity Ground Truth
Activity 1 Activity 2
Signaled Activity Input
Act. 1
Act. 2
i b g b i a g a i b g i a g a b i b g k b i a g a i b g i k b a g a
Noise
Noise
(a) (b) (c) (d)
Figure 2.4: Activity spotting examples: (a) 2 consecutive sequences; (b) hierarchy between two activities; (c) two nested activities with noisy symbols; (d) two overlapping activities with noisy symbols.
activ-ity stream with the corresponding sequence of hot spots; (ii) the signaled activities; and (iii) detected noise patterns. As can be seen from the figure, and thanks to the parsing strategy, the system is able to disclose chunks of activities even if the incoming data stream is corrupted by noise.
2.4
Datasets for Human behavior analysis
Given that the proposed method uses the motion trajectory just to detect the proximity of the subject to the hot-spots identified in the environment, in principle any sensor providing such information is viable for our pur-poses. Examples of devices that can provide the requested information include video cameras, but also active and passive RFIDs, WSNs, acoustic sensors, etc. Adopting any combination of such sensors would also make it possible to provide more reliable estimates, reducing problems caused by occlusions, presence of multiple subjects, and so on.
In our experimental validation we have considered three different datasets, based on different sensor systems and application scenarios.
The second and third datasets have been build in our research labs, using the facilities available in two domains: assisted living and video-surveillance. Both datasets use visual information to track the subjects and extract the positioning information. The former refers to the “Home Dataset” and has been collected in a realistic domestic environment de-signed for testing ambient-assisted-living technologies (Fig. 2.5). The dataset includes a total of 81 trajectories equally divided into 3 classes: A) Cooking, B) Eating, C) Taking a break, and executed by 9 volunteers performing the same activity for 3 times in slightly different ways.
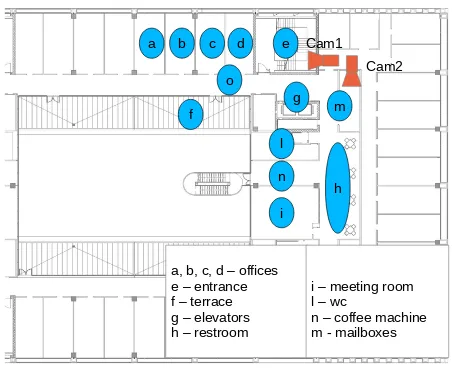
The latter, called “Office Dataset”, has been recorded in an office environ-ment, using multiple cameras (Fig. 2.6). The dataset includes 120 paths divided into 4 classes: A) Arrival, B) WorkTime, C) Have a break, D) Print.
Similarly to the previous one, it has been performed by 10 volunteers doing the same activity for 3 times in slightly different ways.
In both cases, the video streams have been processed by a motion tracker to extract the top-view trajectories of the moving subjects.
2.5
A Context-Free Grammar behavior analysis tool
In this section we present and discuss the results obtained by our method on the datasets described in Section 2.4.
Considering that the tracker is out of the scope of this work, the exper-imental validation only concerns the behavior analysis module.
Living Room Area
Kitchen Area c
i
n
o
b l
m
a
d
g e f
a – table b – sofa c – entry d – pantry e – sink f – cooker g – fridge
h – heaterA i – tv l – heaterB m – doorA n – small table o – chair
Cam1
Cam2
b c d
a e
o
f
g m
l
n
i h
a, b, c, d – offices e – entrance f – terrace g – elevators h – restroom
i – meeting room l – wc
n – coffee machine m - mailboxes Cam1
Cam2
2.5.1 Ubicomp dataset
In order to make it suitable to be fed into our framework, we had first to characterize each activity as a sequence of sensor events.
To this purpose, we mapped the 14 sensors assigning an identifier to each of them (Fig. 2.7) according to the indication in Table 2.1, so that each action is described by the sequence of sensor events generated within the action time-slot.
As an example, we report hereafter the sequence of sensor events for the action “Sleeping”, according to the notation used in our framework:
SetSleeping =ps(nn);ps(nnn);ps(bnni);ps(nninnn);
ps(nncbbn);ps(bnccnc);ps(bnnibnn);
ps(innccnn);ps(bncicnn);ps(cnnccnn);
ps(bnncicnn);ps(nnncicnn);ps(nnnncicnn);
ps(nnccnccnin);ps(nncnincicn);
ps(nnncicnncicnn);ps(bnncicinncnicn);
ps(nnbnncibbiciiicbn);
ps(nbccbnnnbnbbbbibbbnncicncnncnn);
Starting from this description, using as positive samples the strings for the considered action and as negative samples the ones of all the other actions, we can generate the set of grammars required to classify each ac-tion. As an example, we show in the following the grammar for the action “Sleeping”:
PSleeping = S →bn;S→bS;S→cn S →cS;S →iS;
S →nc;S →ni;S →nn;S →nS
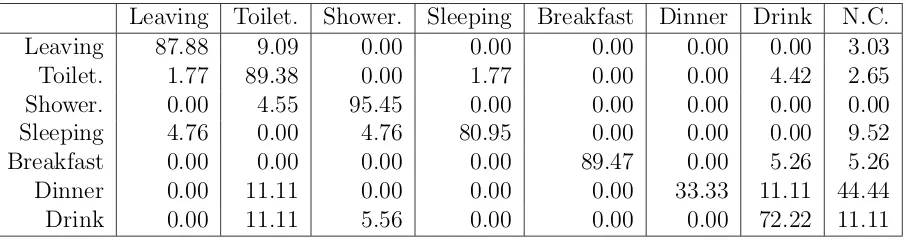
To make the results comparable to the ones presented in [101] and [100], we adopted the “leave one day out” validation proposed by the authors.
Figure 2.7: Ubicomp dataset. Map of the considered environment, with sensor labels.
Table 2.1: Sensor remapping.
Position Letter assigned
Microwave a
Hall-Toilet door b Hall-Bathroom door c Cups cupboard d
Fridge e
Plates cupboard f
Frontdoor g
Dishwasher h
ToiletFlush i
Freezer j
for testing one full day of sensor readings and for training the remaining days. We have iterated this process so that each of the days contained in the dataset has been considered for testing.
Table 2.2: Confusion Matrix using the proposed framework on the “Ubicomp dataset”. The values are percentages
Leaving Toilet. Shower. Sleeping Breakfast Dinner Drink N.C. Leaving 87.88 9.09 0.00 0.00 0.00 0.00 0.00 3.03 Toilet. 1.77 89.38 0.00 1.77 0.00 0.00 4.42 2.65 Shower. 0.00 4.55 95.45 0.00 0.00 0.00 0.00 0.00 Sleeping 4.76 0.00 4.76 80.95 0.00 0.00 0.00 9.52 Breakfast 0.00 0.00 0.00 0.00 89.47 0.00 5.26 5.26 Dinner 0.00 11.11 0.00 0.00 0.00 33.33 11.11 44.44 Drink 0.00 11.11 5.56 0.00 0.00 0.00 72.22 11.11
Mod-els (HMM), Hidden Semi-Markov ModMod-els (HSMM), Conditional Random Fields (CRF). For comparison purposes our approach is reported as the last one.
Table 2.3: Comparison of obtained results respect [100]. Model Precision Recall F-Measure Accuracy Naive Bayes 67.3±17.2 64.8±14.6 65.8±15.5 95.3±2.8 HMM 54.6±17.0 69.5±12.7 60.8±14.9 89.5±8.4 HSMM 60.2±15.4 73.8±12.5 66.0±13.7 91.0±7.2 CRF 66.2±15.8 65.8±14.0 65.9±14.6 96.4±2.4 Our Framework 89.9±10.9 78.3±19.6 83.7±14.0 85.5±11.8
As can be seen, the proposed framework obtained significant improve-ments in terms of Precision, Recall and F-Measure. The accuracy is still high, although slightly lower compared to the other models. This is mainly due to the fact that our approach produces some unrecognized actions, which limit the accuracy parameter. This fact can be partially recovered by the re-training procedure, as will be shown in the next paragraphs.
2.5.2 Home environment
As far as the “Home Dataset” is concerned, we first randomly divide each set of examples in the in 2 parts, a training and a test set, each one con-taining one half of the samples provided for each behavior. Based on the training set we generate 3 grammars, one for each action. Then, we apply the grammar to classify the test set. In order to cross-validate the results, every experiment is repeated 10 times with different random partitions, and the classification results are averaged. Cross-validation is applied to all the tests reported in the following.
In the first test we consider positive samples only in the grammar gen-eration. Results are reported in Table 2.4.
Table 2.4: Classification accuracy using positive samples only.
In/Out A B C U nknown
A 0.54 0.15 0 0.31
B 0.08 0.54 0 0.38
C 0 0.15 0.62 0.23
misclassified and about one third of the patterns are classified as unknown, meaning that they are not recognized as valid patterns by the parser. In the second experiment we introduce negative samples in the grammar gen-eration, where for each class, the positive samples are the same as above, while the negative ones consist of the training of the other classes. Con-sequently, each of the 3 grammars is generated from 14 positive and 28 negative examples. Results are reported in Table 2.5.
Table 2.5: Classification accuracy considering positive and negative samples.
In/Out A B C U nknown
A 0.69 0 0 0.31
B 0 0.62 0 0.38
C 0 0 0.77 0.23
It can be observed that negative samples allow a better discrimination, i.e., removing the overlap among the three classes, as clearly shown by the new confusion matrix. On the contrary, the number of unrecognized samples remains unchanged, as the negative samples just restrict the region associated to each class.
recognized samples). These patterns are then used as additional training samples to update the grammars according to the proposed re-training procedure. Finally, the last subset is used for testing. The average results obtained after the first and second learning stage are reported in Tables 2.6 and 2.7, respectively.
Table 2.6: Average classification accuracy after one learning stage.
In/Out A B C U nknown
A 0.63 0 0 0.37
B 0 0.55 0 0.45
C 0 0 0.55 0.45
Table 2.7: Average classification accuracy after re-training.
In/Out A B C U nknown
A 0.74 0 0 0.26
B 0 0.69 0 0.31
C 0 0 0.67 0.33
Comparing the two tables one can observe that the performance con-siderably improves after re-training, leading to an average 70% of correct classification. It is also to be noted that the last result is better than the one shown in Table 2.5, although the total number of samples presented to the grammar generation tools is slightly lower on average. In fact, in the former, one half of the samples were used for training (14 per class), while in the latter, the average number was 13 (9 initial + 4 in re-training).
2.5.3 Office environment
for training, based on positive samples only. The test was performed on the remaining 15 samples per class. The confusion matrix is reported in Table 2.8.
Table 2.8: Classification accuracy using positive samples only.
In/Out A B C D U nknown
A 0.46 0.07 0 0 0.47
B 0 0.40 0 0.13 0.47
C 0 0 0.53 0 0.47
D 0.07 0 0 0.40 0.53
Also in this case, we tested the grammar generation tool adding negative examples, thus using 15 positive and 45 negative samples per class. Results are reported in Table 2.9.
Table 2.9: Classification accuracy considering positive and negative samples.
In/Out A B C D U nknown
A 0.53 0 0 0 0.47
B 0 0.53 0 0 0.47
C 0 0 0.53 0 0.47
D 0 0 0 0.47 0.53
Finally, re-training is simulated splitting the dataset in 3 equal parts (10 samples per class), and using the first subset for initial grammar generation, the second subset for the first test and the re-training, and the last subset for final test. The intermediate and final results are reported in Table 2.10 and Table 2.11, respectively.
Table 2.10: Average classification accuracy after one learning stage.
In/Out A B C D U nknown
A 0.55 0 0 0 0.45
B 0 0.50 0 0 0.50
C 0 0 0.48 0 0.52
D 0 0 0 0.58 0.42
Table 2.11: Average classification accuracy after re-training.
In/Out A B C D U nknown
A 0.73 0 0 0 0.27
B 0 0.71 0 0 0.29
C 0 0 0.82 0 0.18
D 0 0 0 0.78 0.22
2.6
Real time behavior analysis in compressed
do-main
of their deployment in real scenarios. In order to respond to this need, especially in case of elderly care, it is necessary to develop low-complexity algorithms, which can be deployed directly in the DSP (Digital Signal Processor) onboard of the camera and possibly in the compressed domain, thus dropping the need for decoding. In this work we present an algorithm which completely operates in the compressed H.264 [109] domain and that requires a negligible complexity, hence it can be deployed on DSP (or simi-lar) processor. Fall detection and reconfiguration is achieved by proposing a generic entropy measure derived using the distribution of the motion field extracted from the compressed video bit stream [57].
2.6.1 Evaluation
In order to demonstrate the utility and robustness of the algorithm, we first evaluate the performance of the fall detection algorithm by testing it against the reference fall detection dataset published by the University of Montreal [8], widely used to validate algorithms in this field.
To show the reconfiguration capability, we deployed a set up in a real environment and observe its performance during the occurrence of fall. To this extent we used two cameras “Sony SNC-EP521 indoor”, day/night, with PTZ. These IP cameras are equipped with a 36x optical zoom allowing operators to cover large, open areas and zoom in for detailed close-up shots. Panning can span from 0 to 340 degrees, with max 105 degrees tilt, and their configuration can change using built in network commands. The cameras have been installed in our Department facility, and falling events have been recorded thanks to the collaboration of volunteers.
Fall detection
reference encoder [46], at the frame rate of 25 frames per second. The thresholds necessary for a proper operation of the algorithm are learned for each camera and are maintained constant for that particular camera for all scenarios. Fall is defined as an event lasting 5-10 seconds, starting from the momentary stop by the subject just before the fall and ending with a motion less layover of the subject. The total number of correct fall detections, as compared to the ground truth, are deemed as true positives (TP), while false detections are termed as false positives (FP). Finally, true falls which have been skipped by the detector are termed as false negatives (FN). The results obtained for the video dataset are given in Table 2.12 in terms of Precision, Recall and F-Measure. A comparison with respect to the state of the art techniques is provided in 2.13. As can be seen, the fall detection algorithm performs reasonably well especially given the fact that it operates in real time. The algorithm fails to detect the falls, when the subject is very far away from the camera and subsequently the motion entropy generated by the subject is very low. In such scenario noise becomes dominant thereby causing false detections. Another scenario where the algorithm fails is in case of actions, which correspond to bending down on the floor etc. However, since we also took into consideration the momentary fall entropy, just after the fall most of such false detections have been resolved.
Table 2.12: Performance of the algorithm on the dataset [8].
Precision Recall F-Measure
0.89 0.86 0.88
Table 2.13: Comparison to the state of the art approaches described in[37].
Our method K-NN C4.5 SVM Bayes Feng et. all
Comparison
Our algorithm completely operates in the compressed domain. Hence it has the advantage of being very light in terms of computational and mem-ory requirements. Nevertheless it compares very well with the other pixel domain state of the art fall detection methods as we can see from the table 2.12. Our method also provides a significant improvement with respect to other compressed domain methods like [25]. Most of these methods rely on the segmentation of moving object and the trajectory of its centroid, and also include other features like velocity of centroid. Present algorithm also uses these aspects, but it turns out to be more robust as it also ex-ploits the motion disorder as one of the factors to determine fall detection. Furthermore, the compressed domain method presented in [25] uses AC and DC coefficients along with motion vectors to achieve object segmenta-tion, which are heavily dependent on the quantization parameter used for encoding the video bit stream. The proposed method, instead is entirely based on motion vectors, which are independent with respect to changes in QP. In terms of complexity our solution offers the lowest complexity of all compressed domain methods as it operates at the level of 32×32 blocks, and the number of operations required for processing one frame are 5.2K, 16K, 48K, 106K computations for CIF, VGA, HD, full HD resolutions, respectively.
Reconfiguration
Figure 2.8: Fall detection and subsequent reconfiguration of the camera for better view.
motion vectors extracted from the H.264 (JM 18.6 version) decoder [46]. In order to control the camera automatically the curl library functions [78] are adopted. The whole set up is implemented on an Intel i5 processor, 3.10 GHz.
pose
traditional concept of saliency, does not focus on perceptual prominence but rather on event-related semantics of media. Results of EventMask are collected in a publicly available dataset which can be exploited for further research in this domain. In this chapter we will introduce the analysis of images, and in particular we will address the problem of content mining for social event detection, starting from the information coming from an-other multimedia content respect to the previous section, i.e. galleries of still images. The objective is to provide a framework able to create the necessary groundtruth to automaticaly classify a single image respect to the represented event.
3.1
Background
In this section we review the state of the art in two areas that are strictly connected to our work: event-based media analysis and gamification for media analysis. A specific sub-section is dedicated to each of these aspects.
3.1.1 Event-based media analysis
photo collection is clustered based on the implicit event structures and the emerging event fingerprints are extracted to eventually discover the type of the related event. [41] proposes a similar idea but with the ambitious objective of determining the event on the basis of a single media item, using a visual concept vector. In practice, event classes are learned with a Mixture Subclass Discriminant Analysis and a nearest neighbor criterion is used to associate the media to an event class. The main problem with the above method, as well as with other approaches that use visual in-formation only, is the dependency on visual concept detectors, which still perform poorly. Multi-concept detection can partially solve this problem by finding evidence of a high-level concept, e.g., an event, from the joint presence of multiple visual concepts even with low individual accuracy. In this case, the joint weak detection of multiple related concepts reinforces the higher-level classification [97].
Twitter stream and then perform event vs. non-event clustering. Event detection in social media (e.g., Facebook and Twitter) is also studied in [16] and [54].
Also social ties can be considered an important source of information. A new concept of social interaction is defined in [107], where social affinity is computed via a random-walk on a social interaction graph to determine similarity between two pictures. In [38] the authors propose to use the social information produced by users in the form of tags, titles and photo descriptions for classifying photos in event categories. In [21] various in-formations (e.g., time, location, textual and visual features) are combined within a framework that incorporates external data sources from datasets and online web services. In [61], the authors exploit geo-tagging informa-tion retrieved from online sources to determine the bounding box for a set of venues, while using time information to determine the set of events that can be compared to those occurred at the examined venue. In [82] a mul-timodal clustering approach is proposed, which predicts the same cluster relationship by exploiting pairwise similarities for all different modalities and achieving supervised fusion of the heterogeneous features. The social event detection is transformed into a watershed-based image segmenta-tion in [30] and [77], where visual and non-visual informasegmenta-tion are jointly exploited. A fully automated system for event recognition from an im-age gallery has been recently proposed in [111], by exploiting metadata information. In [22] authors identify, retrieve and classify photos in col-laborative web photo collections associated with social events, by using contextual cues and spatio-temporal constraints.
avail-able to the research community various annotated datasets, suitavail-able for training, testing and comparing different methodologies.
With special reference to the area of event media analysis, the main con-tribution of this paper is in the definition of the concept of event saliency, as a way to bring some light on the perception mechanisms that allow hu-man beings understanding events when looking at representative images. In particular, what we aim to do is to highlight on an image the revealing visual contents with respect to the underlying event. It is easy to imagine how this result could open new directions in the framework of the above referenced event media analysis techniques, making it possible to focus the attention on important visual concepts and their relationships, while getting rid of irrelevant visual information that may mislead the analysis.
3.1.2 Gamification in media analysis
Human computing is becoming a common solution to face complex or ex-tensive problems, where traditional computer-based approaches fail. Crowd-sourcing is an interesting solution in this domain, based on fragmenting a task into a large number of sub-tasks and involving large communities of workers to solve every micro-task for a relatively small individual reward. Although very interesting in many respects, current crowdsourcing tech-nologies suffer a number of problems. In particular, it is widely accepted that crowdsourced tasks have to be rather simple and fast to perform, there should be no dependency on each other, and there’s a risk connected to the reliability of the work performed. This implies a careful design of the tasks and not all the problems are suitable to be defined in an appropriate way.
that is fun and engaging, and includes a task that can only be completed by humans. Many different game mechanisms comply with the above char-acteristics. A first class is based on output agreement, where users have to collaborate to reach a consensus. An example is the ESP Game for collaborative labeling of images [103], where players try to label a given image while playing in pairs: the goal of the game is to agree on as many tags as possible that describe the given image; the two players that con-vene on the maximum number of keywords win. The hidden goal in this case is to tag images according to the content, for further use in image storage and retrieval. A second class is based on input agreement. An ex-ample is TagATune [58], where players are given inputs and are prompted to produce descriptive outputs, so that their partners can asses whether their inputs are the same or different. Another example is WhoKnows? [106], a game whose purpose is to detect inconsistencies in Linked Data and score properties to rank them for sophisticated semantic-search sce-narios. A third class of GWAPs introduces the so called inversion problem, where the problem is posed indirectly through a “double negation” crite-rion. Peekaboom [105] is a nice example of this type of games, aimed at supporting the creation of metadata associated to visual objects contained in images. It is played in couples in an adversarial way: the first player is given an image and a keyword related to it, and progressively reveals the image part related to the keyword until the other player guesses the object. Recently, a game called Bubbles [33] has been proposed for select-ing discriminative features for fine-grained categorization, where users can reveal small circular areas of blurred pictures to inspect details and guess the represented subject.
video as a whole, but different fragments of it, building a larger and richer set of metadata for that video content. In the context of event recognition in videos, a very recent work [18] proposes the new concept of minimally needed evidence to predict the presence or absence of an event in a video, which allowed improving event retrieval performance on two challenging datasets released under TRECVID [52][51]. Notice that video saliency is in general quite different from image saliency, since motion patterns tend to assume a prominent role in the perception.
InfoGarden [63] is a casual game, transforming document tagging into an activity like weeding a garden and protecting plants from gophers, de-signed to extend the willingness to maintain personal archives by enhancing the experience of personal archive management. Games used for the eval-uation and curation of the underlying data are effectively incentives-driven tools, as discussed in [94], employing ease of use, fun and competition as incentives for users to perform what would otherwise be an unrewarding and demanding manual tasks. An overview about the application of game mechanics in information retrieval can be found in [40].
The social dimension is also very important in games. Social gaming [5] has been one of the emerging trends in the last years, attracting both research and industrial efforts. As an example, the evolution of social networks such as Facebook or Twitter has introduced content generation as a mainstream concept, forcing users to continuously produce and consume contents. Geopositioning games, such as Foursquare1, Gowalla2, Buzzd3 or Facebook Places4 encourage users to do check-ins indicating where they are, and thus letting the system extract information about their location, top visited places, typical routes. Collabio [17] is a Facebook application
1http://foursquare.com/ 2http://gowalla.com/ 3http://www.buzzd.com/
that allows friends to tag each other with descriptive terms through a game. In GuessWho [44] users enter knowledge about their peers to enrich the organizational social network: each player is prompted with the name of a person and is asked to provide either names of people who are related to that person or tags that describe him/her. CityExplorer [65] combines social gaming with geospatial data gathering to set particular location of places and landmarks. Pirates! [12] encourages users to collaborate in the mapping process of WiFi networks available in the surroundings. Recently, a gamification approach that moves away from thinking of gamification as an “additive” process towards a more “holistic” paradigm was proposed in [49]. In this context, a novel definition was proposed that addresses gamification as a complete system in itself, positioning it as the process of adding an actionable layer of context.
3.2
Event Saliency
Let us consider the image in panel (c) of Fig. 3.1, which shows the same photo of Fig. 1.2 covered with a different mask. It is now rather easy to understand which event it depicts. In fact, a revealing element (the typical birthday pie with the candles) is now clearly visible. Moreover, this visual element suggests a number of additional information that in some way disclose also the covered parts. For instance, we can assume
(a) (b)
(c)
that the baby is a girl, because of the color of the candles, and that it is her second birthday. Incidentally, the mask used in this example has been obtained with a well-known saliency detector [71][70], thus underlining the low relatedness of visual saliency with event semantics. If we are able to cover all the image areas that are revealing the event and only those, so that the concealed image cannot be anymore associated to the correct event while minimizing the coverage, we have defined what we call an event saliency map. The event saliency is largely independent of the color and
contrast of the relevant visual elements, and can be made of any number of disjoint elements, with arbitrary shape and in any position over the image. In fact, revealing information can be hidden everywhere in the picture: in the background, in a small detail, or even in a low contrast or blurred area. For this reason, it is difficult to imagine automatic techniques able to extract it from a picture with the currently available technologies. On the contrary, the ability of human beings at recognizing events even from a small detail is incredibly high. For this reason we decided to use human interaction to gain knowledge about this complex problem. It is important however to notice that the overall purpose of the proposed method is not to directly involve people in event detection, while to learn from people the event semantics contained in visual media, i.e., what really matters in images to detect the subjacent event. In this sense, our method provides as output a groundtruth that can be used as a basis to implement better event detection and event-based image classification algorithms, or to improve existing ones.
3.2.1 EventMask