T
HE NEXUS BETWEEN ELECTRICITY
CONSUMPTION AND ECONOMIC GROWTH
IN
MENA
COUNTRIES
J
AMAL
B
OUOIYOUR
University of Pau, France
R
EFK
S
ELMI
High School of Trade of Manouba, Tunisia
ABSTRACT
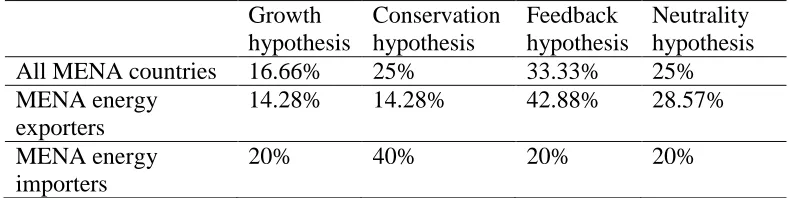
We assess the causality between electricity consumption and economic growth for a panel of twelve MENA countries (seven energy exporters and five energy importers) over the period 1975–2010 within a bivariate framework using panel cointegration methods and panel causality test. By doing so, we show that 16.66% of MENA countries supported the growth hypothesis, 25% the conservation hypothesis, 33.33% the feedback hypothesis and 25% the neutrality hypothesis. For energy exporters, we support the growth hypothesis in 14.28% of cases at the same way of conservation hypothesis, the feedback hypothesis in 42.88% and the neutrality hypothesis in 28.57%. For energy importers, almost 60% of cases provide support for conservation hypothesis. Additionally, we show that Iran and Turkey behave better than the rest of countries in terms of the focal link. We attribute this apparently result to the good structuring of the electricity sector.
Keywords
Electricity consumption, Economic growth, Causality, MENA countries.
Corresponding Author:
Jamal Bouoiyourame, University of Pau, Avenue de l'Université , BP 576 64012 PAU cedex
1. INTRODUCTION
The relationship between electricity consumption and economic growth has been the subject of an intense research during the last decades for American countries (e.g. Apergis and Payne (2009) and Apergis and Payne (2010)) Asian countries (e.g. Asafu-Adjaye (2000), Yoo (2006), Yuan et al. (2007), Gosh (2010) and Niu et al. (2011), among others), European countries (e.g. Narayan and Parasad (2008), Beck et al. (2011) and Dobnick (2011)) and Middle East North African countries (MENA); For instance, Acaravci and Ozturk (2010), Al-Mulati (2011) and Arouri et al. (2012). Appendix A provides a chronological list of the literature on the causal linkage between electricity consumption and economic growth depending to the nature of countries (American versus Asian versus European versus MENA countries, developed versus developing countries, economies with low income versus those with high income, energy importers versus energy exporters, countries with high GDP versus those with low GDP and OECD countries versus non-OECD countries, etc…).1
The strand of literature on this field propose four hypothesis for the possible causality outcomes (e.g. Dobnik, 2011): (i) the growth hypothesis suggests that energy consumption is a crucial component in growth. For this case, each economy is called energy dependent at which a decrease in energy consumption causes a decrease in growth rate ; (ii) the conservation hypothesis is based on a uni-directional causal relationship running from growth to energy consumption, showing that lower energy consumption may have little effect on growth ; (iii) the feedback hypothes is based on a bi-directional causal relationship; (iv) the neutrality hypothesis reveals that energy consumption has not any impact on real GDP.
From the review of theoretical and empirical studies on the energy consumption-growth nexus, we find that the prior results tend to vary depending to the nature of countries, time periods and the empirical methods that were used either in bivariate or multivariate frameworks (cointegration analysis and Granger tests).
Apergis and Payne (2010) examine the nexus between electricity consumption and economic growth in a multivariate framework by including measures of real gross fixed capital formation and labor force. They argue that there is short-run and long-run causality from energy consumption to economic growth in a panel of nine South american countries, supporting therefore the growth hypothesis.
With the exception of the studies by Mahadevan and Asafu (2007) and Arouri et al. (2012), the previous studies pertaining to MENA countries evaluated the linkage between energy consumption and economic growth in a bivariate framework. Accordingly, Ozturk and Acaravci (2011) investigate the dynamic linkage between energy consumption and growth rate in selected MENA countries using cointegration analysis developed by Pesaran and Shin (1999), and Granger causality test. The cointegration test results show that there is no cointegration and causal relationship between the electricity consumption and the economic growth in Iran, Morocco and Syria. However, the cointegration and causal relationship is found for the rest of selected countries, i.e. Egypt, Israel, Oman and Saudi Arabia. Intuitively,
1 We can refer to Payne (2010) for a detailed literature survey on the nexus between electricity
they argue that the energy conservation policy of MENA countries can have a no powerful impact on economic growth.
Several studies have been done on the linkage between the above key variables but up to now the area stills not well explored depending to countries’characteristics. Our work fills the void by extending the issue in three directions: (i) To assess whether the electricity consumption per capita and economic growth per capita are cointegrated while trying to check if there is a long run relationship between these variables; (ii) To investigate the causal relationship between electricity consumption and economic growth within a Vector Error Correction Model in a three panels of MENA countries2 and also
country-by-country.
Alternatively, various questions can be raised: What is the nature of the relationship between electricity consumption and economic growth? Is this relationship depend to the nature of countries (i.e. energy importers or energy exporters)? The answers of these questions will elucidate our understanding on the relationship between electricity consumption and growth rate.
Hence, the remainder of this paper is organised as follows. Section 2 is an overview of the evolution of energy consumption and economic growth in MENA countries. In section 3, we find a detailed analysis of the methods used throughout this study and then, we provide empirical results. Section 4 presents the main economic implications of the focal linkage. Section 5 concludes the paper.
2. AN OVERVIEW OF ENERGY CONSUMPTION AND ECONOMIC GROWTH IN
MENA COUNTRIES
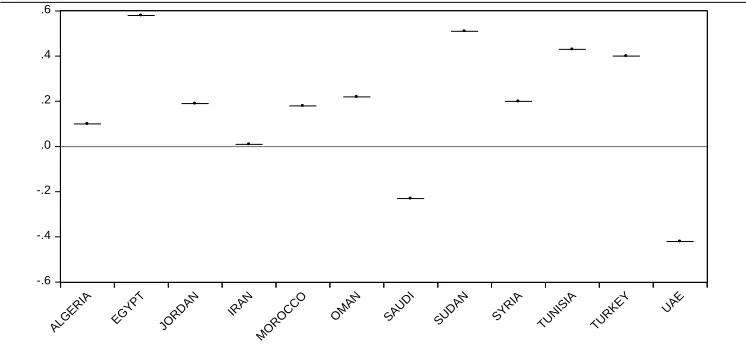
This study extend the recent works by applying a panel cointegration methods and panel causality test to investigate the relationship between electricity consumption and economic growth in 12 MENA countries from 1975 to 2010. We depict in Figure 1 a great difference in terms of growth dependency to electricity, which is very high for example in Egypt, Tunisia and Turkey comparable to the rest of countries, particularly, Saudi Arabia and UAE.
In addition, the considered countries are very diverse regarding their structure. We can classify these economies depending to their GDP, energy imports and energy exports dependency. From Table 1, we found that Jordan, Morocco and Tunisia are all importers with low GDP, except Turkey having a high GDP. Oman, Saudi Arabia and the UAE are exporters with a high GDP, while Algeria, Egypt, Iran and Syria are low GDP exporters.
2 The three groups of countries are successively: 07 MENA energy exporters (Algeria, Egypt, Iran,
Figure 1. The Dependence of Growth to Electricity Consumption
Source : Usherbrooke data and authors’calculation.
Table 1. The Energy Sector and Per Capita GDP among MENA Countries
High GDP Low GDP Energy
importers
Turkey Jordan, Morocco, Sudan,
Tunisia
Energy exporters
Oman, Saudi Arabia, UAE
Algeria, Egypt, Iran, Syria
Source : IMF (various reports).
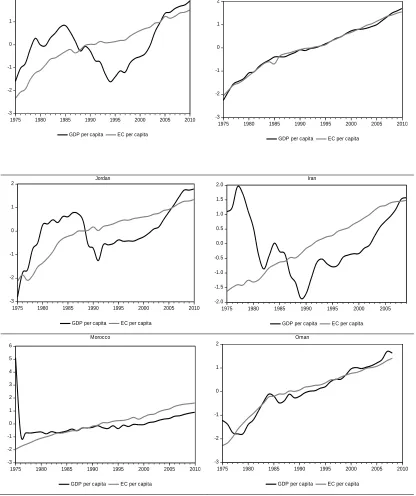
Besides and as depicted in Figure 2, we note that the dynamic interaction between electricity consumption and economic growth vary substantively from one country to another and from energy importers to energy exporters. Algeria, Egypt, Iran and Syria and (to a lesser extent) Tunisia use large shares of domestically produced gas and some oil, whereas Jordan, Morocco, Sudan and Turkey largely depend on imports. Saudi Arabia’s fuel mix consists of a 100% use of oil, whereas Oman and the United Arab Emirates predominantly uses domestically produced gas (e.g. Bouoiyour and Selmi, 2012).
-.6 -.4 -.2 .0 .2 .4 .6
ALG ERIA
EG YPT
JORD AN
IRAN MO
RO CC
O OM
AN SAUD
I SUD
AN SYRIA
Figure 2. The Evolution of Economic Growth and Electricity Consumption
-3 -2 -1 0 1 2
1975 1980 1985 1990 1995 2000 2005 2010 GDP per capita EC per capita
Algeria
-3 -2 -1 0 1 2
1975 1980 1985 1990 1995 2000 2005 2010
GDP per capita EC per capita
Egypt
-3 -2 -1 0 1 2
1975 1980 1985 1990 1995 2000 2005 2010
GDP per capita EC per capita
Jordan
-2.0 -1.5 -1.0 -0.5 0.0 0.5 1.0 1.5 2.0
1975 1980 1985 1990 1995 2000 2005
GDP per capita EC per capita
Iran
-3 -2 -1 0 1 2 3 4 5 6
1975 1980 1985 1990 1995 2000 2005 2010
GDP per capita EC per capita
Morocco
-3 -2 -1 0 1 2
1975 1980 1985 1990 1995 2000 2005 2010
GDP per capita EC per capita
Source : Usherbrooke data.
Energy importers : Jordan, Morocco, Sudan, Tunisia, Turkey.
Energy exporters : Algeria, Egypt, Iran, Oman, Syria, Saudi Aarabia, UAE.
-3 -2 -1 0 1 2 3
1975 1980 1985 1990 1995 2000 2005 2010
GDP per capita EC per capita
Saudi Arabia
-2 -1 0 1 2 3
1975 1980 1985 1990 1995 2000 2005 2010
GDP per capita EC per capita
Sudan
-3 -2 -1 0 1 2
1975 1980 1985 1990 1995 2000 2005 2010
GDP per capita EC per capita
Syria
-3 -2 -1 0 1 2
1975 1980 1985 1990 1995 2000 2005 2010
GDP per capita EC per capita
Tunisia
-2.0 -1.5 -1.0 -0.5 0.0 0.5 1.0 1.5 2.0
1975 1980 1985 1990 1995 2000 2005 2010 GDP per capita EC per capita
Turkey
-3 -2 -1 0 1 2
1975 1980 1985 1990 1995 2000 2005 2010 GDP per capita EC per capita
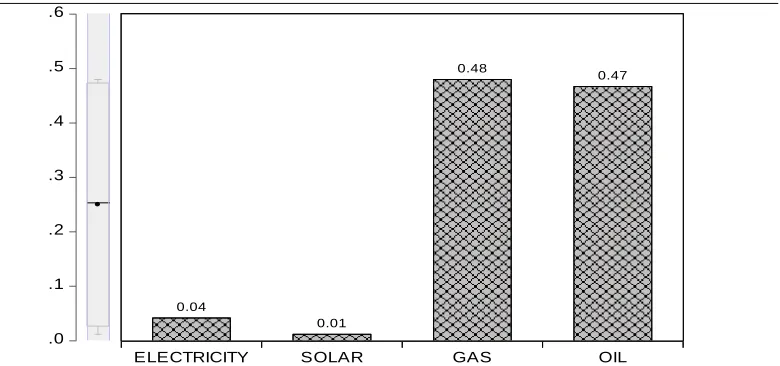
Arguably, Figure 3 indicates a great heterogeneity with respect to the energy sector. There is a dominance of oil and gas with a 46.7% share of oil and 48.0% share of gas used for heat. The electricity and the solar sub-sector contribute respectively to a 4.2% and 1.2% of final energy consumption.
Figure 3. Mix of Final Energy Consumption in MENA Countries
Source: Energy Information Administration Data (EIA), 2010.
Furthermore, the total of electricity generation in MENA countries grew by an average of 6.3% per year. We depict in Figure 4 that hydro power grew slightly comparable to renewable electricity. The contribution from hydro is dominated in Egypt and Morocco (12%, 9.2%, respectively) and to lesser extent in Tunisia by 0.1%. It is also worth notable that non-hydro renewable electricity was concentrated in Egypt, Jordan, Morocco, Tunisia and Turkey (i.e. 0.8%, 0.5%, 2.0%, 0.3%, 0.3%, respectively). Algeria, Saudi Arabia and UAE don’t report any non-hydro generation. It also worth notable that the final energy used in MENA region differs per country due to the combination of a Mediterranean climate among North Africa (Algeria, Morocco and Tunsia) where space heating demand is common, i.e. the demand consists to a large extent for food production, especially during the winter season. However, in Middle East countries which are distinguished during a desert climate (especially, Oman, Saudi arabia and the UAE), the demand is absent, although a small share of domestic hot water.
.0 .1 .2 .3 .4 .5 .6
ELECTRICITY SOLAR GAS OIL
0.04
0.01
0.48
Figure 4. Shares of Renewable Electricity and Heat in Energy Consumption (in %)
Renewable electricity share in the electricity mix
Share of heat in total final energy consumption
Source : Energy Information Administration Data, 2010.
3. METHODOLOGY AND EMPIRICAL RESULTS
This paper uses a developed panel techniques (panel cointegration and panel causality) to investigate whether there is a causal link between electricity consumption and growth in selected MENA countries.
0 2 4 6 8 10 12 14 ALGE RIA EGY PT JORDA N IRA N MO RO CC O OM AN SAUD I SUD AN SYRIA TUN ISIA TUR
KEY UAE
0.2 0.0 9.1 0.6 6.2 0.4 0.1 0.1 12.0 1.9 0.2
0.0 0.0 0.0 2.6
0.1 0.1 0.1 0.1 0.2 0.1 0.2 0.0 0.0 Hydro Non-Hydro 0 10 20 30 40 50 60 70 80 ALG ERIA EGYP T JORDA N IRA N MO ROCCO OM AN
SAUDI SUDA
N
SYRIA TUNI
SIA
TURK
EY UAE
12.0 28.0 23.0 19.0 2.0 18.0 66.0 4.0 18.0 31.0 19.0 4.0 15.0 3.0 7.0
3.1 Descriptive Analysis
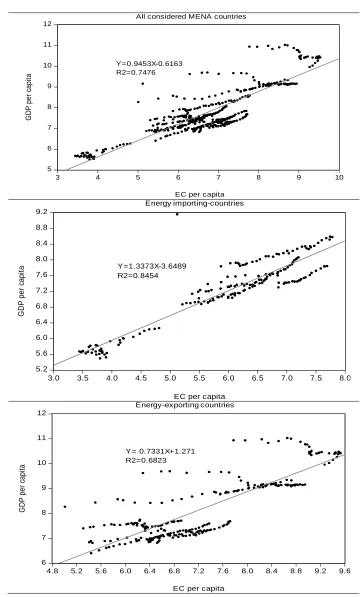
We report the descriptive statistics in Table 2. The sample means of electricity consumption and economic growth are positive for all cases. The kurtosis measure indicates that distributions of the returns of both key variables are positive. Therefore, the returns of these series are leptokurtic relative to a normal distribution. The Jarque–Bera normality test indicates high levels, which implies the reject of normality for both series for all groups of countries.
Table 2. Descriptive Statistics
MENA
countries
Energy
exporters
Energy
importers
Ln(EC)
Ln(GDP)
Ln(EC)
Ln(GDP)
Ln(EC)
Ln(GDP)
Mean
6.57235 7.577190 8.238640 7.311124 7.241326 6.034652Median
6.63002 7.455004 7.587564 7.098891 7.414573 6.287852Maximum
8.95001 9.691655 11.02476 9.534306 9.151121 7.785496Minimum
3.44776 5.493061 6.398595 5.012567 5.493061 3.447763Std. Dev.
1.16709 0.922263 1.256213 1.114944 0.836671 1.216851Skewness
-0.61591 0.143520 0.672195 0.336762 -0.648468 -0.75764Kurtosis
3.59940 3.002271 2.152000 2.078687 2.637893 2.487352Jarque-Bera
30.9653 1.359555 26.52811 13.67575 13.59872 19.19168Observations
433 433 252 252 181 181Notes:
EC : the electricity consumption per capita ; source : Usherbrooke data.
Figure 5. Correlation Between Electricity Consumption and Economic Growth
5 6 7 8 9 10 11 12
3 4 5 6 7 8 9 10
EC per capita
G
D
P
p
e
r
ca
p
it
a
Y=0.9453X-0.6163 R2=0.7476
All considered MENA countries
5.2 5.6 6.0 6.4 6.8 7.2 7.6 8.0 8.4 8.8 9.2
3.0 3.5 4.0 4.5 5.0 5.5 6.0 6.5 7.0 7.5 8.0
EC per capita
G
D
P
p
e
r
ca
p
it
a
Energy importing-countries
Y=1.3373X-3.6489 R2=0.8454
6 7 8 9 10 11 12
4.8 5.2 5.6 6.0 6.4 6.8 7.2 7.6 8.0 8.4 8.8 9.2 9.6
EC per capita
G
D
P
p
e
r
ca
p
it
a
Energy-exporting countries
With regard to our preliminary results, it is time to evaluate if there is a causal relationship between electricity consumption and growth, which varies depending to countries’characteristics. To do so, we pass to apply panel unit root analysis, panel cointegration analysis, panel causality analysis panel fully modified ordinary least square and we finish by testing causality per country.
3.2 Panel Unit Root Test
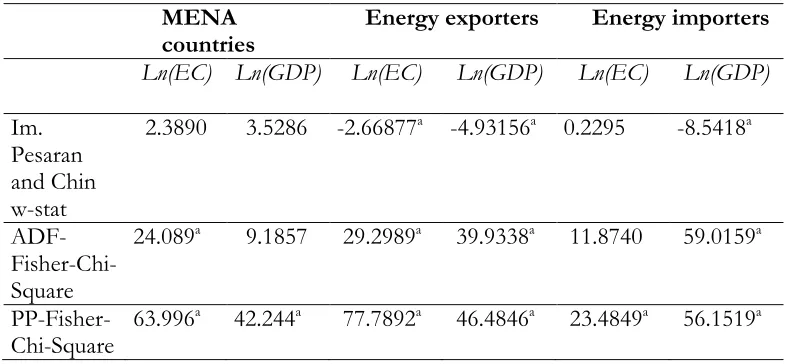
The properties of electricity consumption per capita and GDP per capita need to avoid the possibility of spurious regressions. In order to assess the stationary of these variables, we will previously test the dynamic heterogeneity. This allows us to assess if the linkage between electricity consumption and economic growth is characterized by heterogeneity in dynamics and error variances. Thus, we carry out three different unit root tests including IPS-W-statistic (Im et al. 2003), ADF-Fisher Chi-square (Augmented Dickey Fuller, 1979) and PP-Fisher Chi-square tests (Phillips and Perron, 1988).
The IPS test is given by the following autoregressive specification:
t i t i i t i i t
i
Y
X
Y
,
,1
,
, (1)where i=1, ..., N for each country in the three panel samples in question (All MENA countries, MENA energy exporters, MENA energy importers); t=1, ..., T refers to the time period; Yi,t represents the endogenous variable of the considered model ;
Xi,t represents the exogenous variables in the model including fixed effects or individual time trend; ρi are the autoregressive coefficients; and εi,t are the stationary error terms.
According to Im et al. (2003), the IPS test averages the ADF-Fisher Chi-square unit root test allowing different orders of serial corrections.
it j it
p
j j i t
i , ,
1 ,
,
(2)Then, the substitution of equation (2) into equation (1) yields:
it j it
p
j j i t
i i t i i t i
i
X Y
Y , ,
1 , ,
1 ,
,
(3)where pi represents the number of lags in the ADF regression. The null hypothesis is that each series in the panel contains a unit root (H0:ρi=1). The alternative hypothesis is that at least one of the individual series in the panel is stationary (H0:ρi<1).
Table 3. Panel Unit Root Tests MENA
countries Energy exporters Energy importers Ln(EC) Ln(GDP) Ln(EC) Ln(GDP) Ln(EC) Ln(GDP)
Im. Pesaran and Chin w-stat
2.3890 3.5286 -2.66877a -4.93156a 0.2295 -8.5418a
ADF- Fisher-Chi-Square
24.089a 9.1857 29.2989a 39.9338a 11.8740 59.0159a
PP-Fisher-Chi-Square 63.996
a 42.244a 77.7892a 46.4846a 23.4849a 56.1519a
Notes: Critical value at the 1% significance level denoted by “a” ; Panel unit root test includes intercept and trend.
3.3 Panel Cointegration
One of the reason of testing cointegration link between electricity consumption and economic growth is to determine whether the regressions are spurious. Before estimating the relationship between two variables and before testing whether there is a causal link, it is appropriate to test the cointegrating interaction between the series in question. Thus and after verifying the heterogeneity of GDP per capita and electricity consumption per capita using panel unit root tests which indicate that the first variable is integrated of order one and the second is integrated of order zero, the heterogeneous panel cointegration advanced by Pedroni (2004) is tested, expressed as follows:
t i t i i
t i i t
i LnEC
LnGDP,
,
,
,(4)
where i=1, ..., N for each country in the panel and t=1, ..., T refers to the time period. The parameters αi and δi allow for the possibility of country-specific fixed effects and deterministic trends, respectively. ε i,t denote the estimated residuals which represent deviations from the long-run relationship.
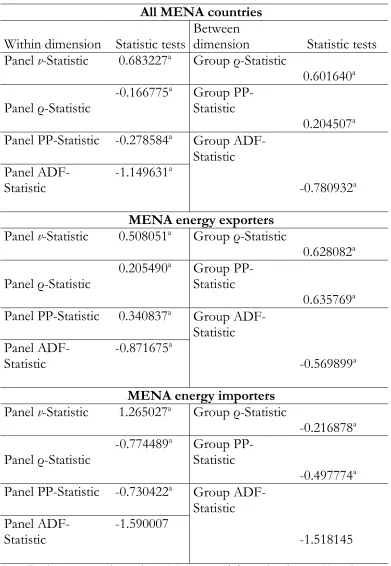
Table 4. Panel cointegration tests
All MENA countries
Within dimension Statistic tests
Between
dimension
Statistic tests
Panel
v
-Statistic
0.683227
aGroup ρ-Statistic
0.601640
aPanel ρ-Statistic
-0.166775
a
Group
PP-Statistic
0.204507
aPanel PP-Statistic
-0.278584
aGroup
ADF-Statistic
-0.780932
aPanel
ADF-Statistic
-1.149631
a
MENA energy exporters
Panel
v
-Statistic
0.508051
aGroup ρ-Statistic
0.628082
aPanel ρ-Statistic
0.205490
a
Group
PP-Statistic
0.635769
aPanel PP-Statistic
0.340837
aGroup
ADF-Statistic
-0.569899
aPanel
ADF-Statistic
-0.871675
a
MENA energy importers
Panel
v
-Statistic
1.265027
aGroup ρ-Statistic
-0.216878
aPanel ρ-Statistic
-0.774489
a
Group
PP-Statistic
-0.497774
aPanel PP-Statistic
-0.730422
aGroup
ADF-Statistic
-1.518145
Panel
ADF-Statistic
-1.590007
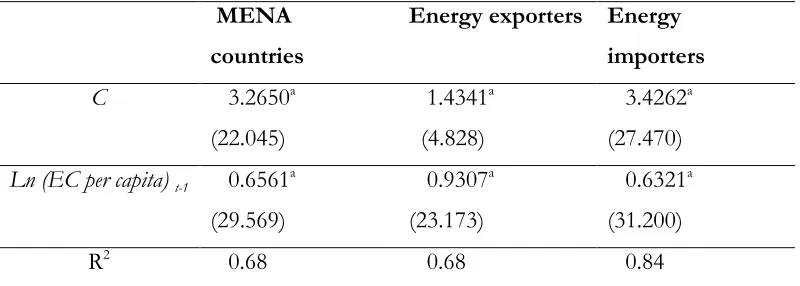
It is also observable from Table 5 that a strong and significant linkage runs from electricity consumption to GDP in the three groups of countries using FMOLS method.
Table 5. Panel FMOLS Long-run Estimates MENA
countries
Energy exporters Energy importers
C 3.2650a
(22.045)
1.4341a
(4.828)
3.4262a
(27.470)
Ln (EC per capita) t-1 0.6561a (29.569)
0.9307a
(23.173)
0.6321a
(31.200)
R2 0.68 0.68 0.84
Notes: t-statistics are reported in parentheses. In our estmates, we take account into White's heteroskedasticity test.Significance at the 1% level denoted by “a”.
Panel Causality
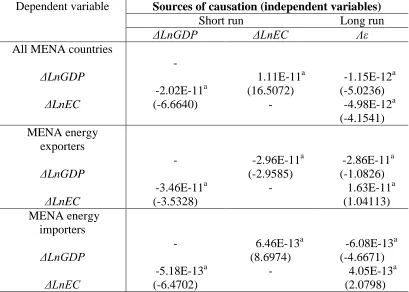
To examine the direction of causality between electricity consumption and economic growth, we use a dynamic panel error-correction specification.
e t i e t i q k e i k t i e k i k t i q k e k i e i t
i LnGDP LnEC
LnGDP , 1 ,
0 , , , 1 , ,
(5)v t i v t i q k v i k t i v k i k t i q k v k i v i t
i LnEC LnGDP
LnEC , 1 ,
0 , , , 1 , ,
(6)where i = 1, ..., N represents the samples of countries (all MENA countries, MENA energy exporters, MENA energy importers) and t = 1, ..., T denotes the time period while GDPi,tand ECi,tare economic growth and electricity consumption, respectively. Δ denotes the first-difference operator, αistands for the fixed effects, k denotes the lag length, εi,t−1 represents the one period lagged error-correction term, and u i,t is the serially uncorrelated error term with mean zero. The coefficients θji,k where j = e, v denote the short-run dynamics while λj
i where j = e, v represent the speeds of adjustment.
Table 6. Panel Causality Results
Dependent variable Sources of causation (independent variables)
Short run Long run
ΔLnGDP ΔLnEC Λε
All MENA countries
ΔLnGDP ΔLnEC - -2.02E-11a (-6.6640) 1.11E-11a (16.5072) -1.15E-12a (-5.0236) -4.98E-12a (-4.1541) MENA energy exporters ΔLnGDP ΔLnEC - -3.46E-11a (-3.5328) -2.96E-11a (-2.9585) -2.86E-11a (-1.0826) 1.63E-11a (1.04113) MENA energy importers ΔLnGDP ΔLnEC - -5.18E-13a (-6.4702) 6.46E-13a (8.6974) -6.08E-13a (-4.6671) 4.05E-13a (2.0798)
Notes: Partial F-statistics reported with respect to short-run changes in the independent variables. The sum of the lagged coefficients for the respective short-run changes is denoted in parentheses. λε
represents the coefficient of the error correction term. Significance at the 1% level is denoted by “a”.
Then, we apply a bivariate Granger test per country. The findings summarized in Table 7 confirm a bi-directional relationship between both considered series in the majority of energy exporters such as Algeria, Egypt and Iran) and in very few energy importing countries such as Sudan.
Table 7. Pairwise Probability of Granger Causality Test
MENA energy exporting-countries
Null hypothesis Algeria Egypt Iran Oman Saudi Syria UAE
EC does not cause GDP
GDP does not cause EC 0.0773 0.0984 0.0773 0.0984 0.0001 0.0200 0.0040 0.8485 0.1569 0.1443 0.4304 0.0507 0.1838 0.5459
MENA energy importing-countries
Null hypothesis Jordan Morocco Sudan Tunisia Turkey
EC does not cause GDP
GDP does not cause EC 0.5175 0.0214 0.0698 0.1662 0.0127 0.0783 0.9432 0.2857 0.0466 0.1550
4. OUTCOMES APPRAISAL AND ECONOMIC IMPLICATIONS
Our above findings summarized in Table 8 reveal that the supported hypothesis depends closely to the nature of countries. For instance, 16.66% of the whole countries supported the growth hypothesis, 25% the conservation hypothesis, 33.33% the feedback hypothesis and 25% the neutrality hypothesis. 14.28% of MENA energy exporters (i.e. Algeria, Egypt, Iran, Oman, Saudi Arabia, Syria and the UAE) supported the growth hypothesis at the same way of conservation hypothesis, 42.88% the feedback hypothesis and 28.57% the neutrality hypothesis. Additionally, almost of 60 % of energy importers provide support for conservation hypothesis.
Table 8. Summary of Causality Results
Growth hypothesis
Conservation hypothesis
Feedback hypothesis
Neutrality hypothesis
All MENA countries 16.66% 25% 33.33% 25%
MENA energy exporters
14.28% 14.28% 42.88% 28.57%
MENA energy importers
20% 40% 20% 20%
For energy-importing countries, there is evidence in favour of an unidirectional relationship between electricity consumption per capita and economic growth with causality running from electricity use to economic growth. This implies that restrictions on electricity consumption can threaten economic growth while increases of electricity usage can faster GDP. Thus, a policy here to reduce electricity consumption utilization will harm economic growth and can hinder economic enhancement. More precisely, a negative shock to electricity consumption leads to higher electricity prices or to electricity conservation policies which can affect negatively and significantly GDP per capita (e.g. Narayan and Singh, 2007). This suggests that good energy infrastructures may be considered as stimulus for economic growth.
For energy-exporting countries, there is highly important evidence in favour of neutrality hypothesis. Instead, the role of energy can be neutral vis-à-vis economic growth because the energy cost is very low relative to GDP, and thus energy consumption is not likely to have a significant impact on output growth. Hence, imposing taxes to reduce electricity consumption or implementing a conservation policy will not harm economic growth (e.g. Bildirici et al. 2012). Accordingly, Wolde-Rufael (2006) and Narayan and Smith (2009) show that the lack of causality in both directions implies that measures to save electricity usage can be taken without compromising economic growth. This can be intensely attributable to the fact that these countries have not yet reached a high level of electricity autonomy which allows them to reduce their energy use.
economy grows, electricity becomes predominant (e.g. Toman and Jemelkova, 2003). Although, a decrease in economic growth can lead to an absence of sufficient choice providing access to modern, adequate and efficient energy services able to mitigate economic and human development-damaging, i.e. energy poverty (e.g. Reddy (2000) and Wolde-Rufael (2006)).
Intuitively, we find that Iran in energy exporters and Turkey in energy importers are leaders in terms of the association between energy usage and economic growth. This may be mainly due to the good structuring of the electricity sector that leads necessarily to a positive and significant effect on economic growth.
5. CONCLUSION
The nexus between electricity consumption and economic growth is a widely studied research topic. Despite this large strand of literature on this issue, the empirical evidence stills conflicting in terms of the direction of causation. Our study finds an empirical survey of the literature on the link between electricity consumption and growth in MENA countries (energy importers versus energy exporters), to compare it with the previous results.
As prior studies, we find mixed results in terms of the causal relationship between electricity usage and growth. We support in different percentages various hypothesis (i.e. neutrality, growth, conservation and feedback). We show that for the specific countries surveyed (see Appendix A), 35.48% supported the neutrality hypothesis, 29.03% the conservation hypothesis, 12.9% the growth hypothesis and 22.58% the feedback hypothesis. It appears also that Iran and Turkey behave better in terms of the focal relationship comparable to the rest of countries of our set sample.
REFERENCES
Acaravci, A. and Ozturk, I. (2010). On the Relationship between Energy Consumption, CO2 Emissionsand Economic Growth in Europe. Energy, 35(12), 5412-5420.
Al-Iriani, M.A. (2006). Energy–GDP Relationship Revisited: An Example from GCC Countries Using Panel Causality. Energy Policy, 34(17), 3342-3350.
Apergis, N., Payne J-E. (2009). CO2 emissions, energy usage, and output in Central America. Energy Policy 37, 3282–3286.
Apergis, N., Payne, J.E. (2010). The Emissions, Energy Consumption, and Growth Nexus: Evidencefrom the Common Wealth of Independent States. Energy Policy, 38(1), 650-655.
Arouri, M.H, Ben Youssef, A., M'Henni, H, Rault, C. (2012). Energy Consumption, Economic Growth and CO2 Emissions in Middle East and North African Countries. CESifo Group Munich, Working Paper Series, 3726.
Asafu-Adjaye, J., (2000) The relationship between energy consumption, energy prices and economic growth: time series evidence from Asian developing countries, Energy Economics, 22; 615-625.
Belke, A., Dobnik, F. and Dreger, C. (2011). Energy consumption and economic growth: New insights into the cointegration relationship. Energy Economics 33(5), 782–789.
Bildirici, M., Bakirtas, T. and Kayiksi, F. (2012). Economic growth and electricity consumption: An ARDL analysis. Conference on International energy, Vienna 2012.
Bouoiyour, J. and Selmi, R. (2013). GCC countries and the relationship between oil price and real exchange rate. Working paper CATT, University of Pau.
Dickey, D.A., Fuller, W.A. (1979). Distribution of the Estimators for AutoRegressive Time Series with a Unit Root. Journal of the American Statistical Association, 74(366), 427-431.
Dobnick, F., (2011). Energy consumption and economic growth revisited : structural breaks and cross section dependence, Ruhr Economic Papers n° 303. Ebohon, O.J., (1996). Energy, economic growth andcausality in developing
countries: a case study of Tanzania and Nigeria. Policy 24 (5), 447–453.
Fisher, R.A. (1932). Statistical Methods for Research Workers (4th Ed.). Edinburgh, Scotland: Oliver and Boyd.
Im, K., Pesaran, M.H., Shin, Y. (2003). Testing for Unit Roots in Heterogeneous Panels. Journal of Econometrics, 115(1), 53-74.
Mahadevan, R. and Asafu-Adjaye, J. (2007). Energy consumption, economic growth and prices: A reassessment using panel VECM for developed and developing countries. Energy Policy 35(4), 2481–2490.
Narayan, P-K., and Prasad, A. (2008). Electricity consumption-real GDP causality nexus: evidence from a bootstrapped causality test for 30 OECD countries. Energy Policy 36, 910–8.
Narayan, P.K. and Singh, B. (2007). The electricity consumption and GDP nexus for the Fiji Islands. Energy Economics, 29: 1141-1150.
Niu, S., Ding, Y. Niu, Y. Li, Y. and Luo, G. (2011). Economic growth, energy conservation and emissions reduction: A comparative analysis based on panel data for 8 Asian-Pacific countries. Energy Policy 39(4), 2121–2131.
Ozturk, I. (2010). A literature survey on energy-growth nexus. Energy Policy, 38, 340-349.
Ozturk, I., Acaravci, A. (2011). CO2 Emissions, Energy Consumption and Economic Growth in Turkey. Renewable and Sustainable Energy Reviews, 14(9), 3220-3225.
Payne, J-E., (2010). A survey of the electricity consumption and growth literature, Applied energy 87, 723- 731.
Pedroni, P. (2004). Panel Cointegration: Asymptotic and Finite Sample Properties of Pooled Time Series Tests with an Application to the PPP. Econometric Theory, 20(3), 597-625.
Pesaran, M.H., Shin, Y. (1999). Pooled Mean Group Estimation of Dynamic Heterogeneous Panels. Journal of the American Statistical Association, 94(446), 621-634.
Phillips, P.C.B., Perron, P. (1988). Testing for a Unit Root in Time Series Regressions. Biometrika. 75(2), 335-346.
Reddy A-K. (2000). Energy and Social Issues, in “World Energy Assessment”, UNPD, New York. ISBN 92-1-126-126-0.
Toman, M. and Jemelkova, B., (2003). Energy and Economic Development: An Assessment of the State of Knowledge. Energy Journal, 24, 93-112.
Tang, C-F. (2008). A re-examination of the relationship between electricity consumption and economic growth in Malaysia. Energy Policy 36, 3077–85. Templet, P H. (1999). Energy, diversity and development in economic systems: an
empirical analysis. Ecological Economics 30 (2), 223–233.
Wolde-Rufael Y. (2006). Electricity consumption and economic growth: a time series experience for 17 African countries. Energy Policy, 34,1106–14.
Yoo, S-H. (2006). The causal relationship between electricity consumption and economic growth in the ASEAN countries. Energy Policy 34, 3573–82.
Appendix A. An Overview of Studies on the Energy Consumption-growth Nexus
Authors Period Countries Causality test Hypothesis American countries
Narayan and
Parasad (2008) 1971-2002 Canada Mexico USA
Energy ↔ Growth Energy ↔ Growth Energy ↔ Growth
Neutrality hypothesis Neutrality hypothesis Neutrality hypothesis Apergis and
Payne (2009) 1980-2004 Central America Energy → Growth Conservation hypothesis Apergis and
Payne (2010) 1980-2005 South America Energy → Growth Conservation hypothesis
Asian countries
Gosh (2009) 1950-1997 India Growth → Energy Growth hypothesis
Lee and Chang
(2005) 1954-2003 Taiwan Energy → Growth Conservation hypothesis
Yoo (2006) 1970-2002 Korea Energy → Growth Conservation
hypothesis Yuan et al.
(2007) 1978-2004 China Energy → Growth Conservation hypothesis Tang (2008) 1972-2003 Malaysia Energy → Growth Conservation
hypothesis Niu et al.
(2011) 1971-2005 Developed Developing Energy → Growth Growth → Energy Conservation hypothesis Growth hypothesis
European countries
Narayan and
Parasad (2008) 1960-2002 Belgium Netherlands France Italy Greece Spain Poland Norway Sweden
United Kingdom
Energy ↔ Growth Growth → Energy Energy ↔ Growth Energy ↔ Growth Energy → Growth Energy ↔ Growth Energy ↔ Growth Energy ↔ Growth Energy ↔ Growth Energy ↔ Growth
Neutrality hypothesis Growth hypothesis Neutrality hypothesis Neutrality hypothesis Conservation hypothesis Neutrality hypothesis Neutrality hypothesis Neutrality hypothesis Neutrality hypothesis Neutrality hypothesis Belke et al.
(2011) 1981-2007 OECD countries Energy ↔ Growth Feedback hypothesis Dobnick (2011) 1971-2009 OECD countries Energy ↔ Growth Feedback hypothesis
MENA countries
Al-Iriani (2006) 1971-2002 GCC countries Growth → Energy Growth hypothesis Mohadevan
(2007) 1971-2002 Energy exporters Energy importers Energy ↔ Growth Energy ↔ Growth Feedback hypothesis Feedback hypothesis Ozturk et al.
(2011) 1971-2005 Upper and lower income countries Energy ↔ Growth Feedback hypothesis Al-Mulati
(2011) 1980-2009 MENA countries Energy ↔ Growth Feedback hypothesis Arouri et al.
(2012) 1981-2005 MENA countries Energy → Growth Conservation hypothesis
Appendix B. Hypothesis of Causality Outcomes
Countries Causality Causality test Hypothesis All MENA
Countries Growth ↔ Energy Not verified Neutrality hypothesis MENA energy
exporters
Algeria Egypt Iran Oman Saudi Arabia Syria UAE
Growth ↔ Energy
Growth ↔ Energy Growth ↔ Energy Growth ↔ Energy Growth →Energy Growth ↔ Energy Energy → Growth Growth ↔ Energy
Not verified
Verified Verified Not verified Verified Verified Verified Verified
Neutrality hypothesis
Feedback hypothesis Feedback hypothesis Neutrality hypothesis Conservation hypothesis Feedback hypothesis Growth hypothesis Feedback hypothesis
MENA energy importers
Jordan Morocco Sudan Tunisia Turkey
Energy → Growth
Energy → Growth Growth →Energy Growth ↔ Energy Growth ↔ Energy Growth →Energy
Verified
Verified Verified Not verified Verified Verified
Growth hypothesis