Modelling spatial-temporal dynamics of
cyanobacteria abundance in lakes by integrating
cellular automata and genetic programming
Yuqing Ling
1, Min Wang
1, Qiuwen Chen
1*, Arthur E Mynett
1 1 CEER Nanjing Hydraulic Research Institute, Nanjing 210029, ChinaCorresponding author: [email protected]
Abstract
Cyanobacteria blooms are a serious problem around the world and have caused severe ecological and social-economic damage. Data-mining models have proven effective at predicting such blooms; however, few of them can provide the spatial dynamics. Although process-based numerical models do provide a way to model, such approach often involves too many parameters to be calibrated. This study took the case of Taihu Lake and developed a model that embedded a data-mining technique into a cellular automata configuration, so as to obtain the spatial-temporal dynamics of cyanobacteria blooms. The lake was divided into polygons in accordance with the monitoring stations by using the Voronoi method. Data on flows, water quality and phytoplankton were collected from monitoring stations inside Taihu Lake. Genetic programming was applied to establish predictive formulations for the cyanobacteria population dynamics in relation to flow and water quality variables by using the collected data. The formulations accounted for local interactions between polygons as the evolution rules for the cellular automata. The results show that in this way CA models are able to predict both approximate magnitudes as well as accurate timing of cyanobacteria blooms quite well for all areas except for regions with lower cyanobacteria population. Overall the CA model shows very promising performance in capturing the spatial-temporal dynamics of algal abundance in lakes.
1
Introduction
Blooms of cyanobacteria are a global environmental concern. Lake Taihu, located in a region of China undergoing rapid economic development, has experienced accelerating eutrophication over the past three decades (Qin et.al., 2007, 2010). The cyanobacteria population has increased considerably and accounts for nearly 85% of the summer phytoplankton biomass (Chen et al., 2003). The dominant species Microcystis is usually toxic and associated with severe human health effects (Jia et al., 2016).
Engineering
EPiC Series in Engineering
Volume 3, 2018, Pages 1214–1223
Cyanobacteria produce taste and odor problems in drinking water supplies, disrupt tourism and fishing, and cause economic losses (Yang et al., 2008; Guo et al., 2007).
The mechanisms causing cyanobacterial blooms are complicated, involving hydrodynamic, chemical and biological processes and interactions. During the past decades, considerable efforts have been made to develop models for predicting cyanobacteria blooms. Such models have proved helpful in ecosystem analysis and better understanding ecological interactions. Nowadays, process–based modelling and data mining approaches both are commonly used methods. Process–based models have achieved remarkable success in various lakes because they can describe the growth and outbreak processes of cyanobacteria quite well (Hamrick, 1992; Cole and Buchak, 1995; Moll and Radach, 2003; Gal et al., 2009; Zhang et al., 2013; Chen et al., 2014). However, a substantial amount of physical, chemical and biological data is needed to calibrate each detailed process description. This causes difficulties in practical application and leads to uncertainty of the predictive capabilities. Alternatively, many data mining techniques such as artificial neural networks, genetic programming and fuzzy logic have been applied to ecological case studies, in particular when the hydrodynamic and transport processes can be neglected (Chan et al., 2007; Chen and Mynett, 2003; Maier et al., 1998; Recknagel et al., 2003; Whigham and Recknagel, 2001). However, predictive models based on data mining techniques often focus on one particular lake only, which causes the portability of the models to be poor. Moreover, data-mining models usually cannot provide the spatial dynamics. Therefore, the prediction of cyanobacteria dynamics in large lakes with heterogeneous spatial properties still remains an extremely challenging topic in ecohydraulics research.
Cellular automata models are set up by subdividing the study space into cells and taking each cell as a separate subdomain with it’s internal rules on e.g. growth and decay processes. The CA approach can overcome the shortcomings of data mining models and reflect the spatial heterogeneity and local interactions (Chen et al., 2002). In recent years, CA has been widely used in ecological modelling, including rainforest dynamics (Alonso and Sole, 2000), population dynamics of animals (Chen and Mynett, 2003), competitive growth of underwater macrophyte species (Chen et al., 2002), vegetation evolution (Ye et al., 2010) and more.
In this study, genetic programming (GP) using the dataset of measurements from Lake Taihu was used to develop the internal rule-based system of the cellular automata model to predict the spatial-temporal dynamics of cyanobacteria blooms. The lake was divided into polygons by connecting the monitoring sites using the Voronoi method (Lin, 2014). For each site, GP was applied to establish a predictive formulation for cyanobacteria population dynamics in relation to physical-chemical variables. These formulations include local interactions between polygons to serve as evolution rules of cellular automata.
2
Materials and methods
2.1
Study area and data collection
Lake Taihu, situated in the South of the Yangtze River Delta (E30o56′~31o33′, N119o54′~120o36′) is the third largest shallow freshwater lake in China (Figure. 1). The surface area is 2,338 km2 and the water depth ranges from 1.0 to 2.5 m. The lake has a drainage area of 36,500 km2 and more than 30 canals and rivers discharge water into the lake. The inflow rivers mainly come from the Western lake. The Taipu River is the main river discharging water from the lake. The Wangyu River delivers Yangtze River water to the lake. In recent years, due to excessive wastewater discharge from factories, industry and agriculture, severe cyanobacteria blooms have occurred from May to October.
Monthly data on surface water (0.0~0.5 m) from 2008 to 2012 were collected from 31 sites in the whole lake (Figure. 1). For each site, physical, chemical and biological parameters were measured, including water temperature (WT), Secchi depth (SD), pH, nitrate-N (NO3-N), ammonia-N (NH3-N), phosphate-P (PO4-P) and cyanobacteria. Before developing any model, the data were linearly interpolated to produce daily values. The principle characteristics are given in Table 1.
2.2
Methodologies
Genetic Programming (GP) belongs to the class of evolutionary algorithms (EAs), which evolve tree structures and find optimized solutions (Koza, 1994, 1996). Banzhaf (1998) define GP as the direct evolution of programs or algorithms for the purpose of inductive learning. The method builds on the genetic algorithm (GA) concept, and represents an initialized population using LISP lists, which are specific tree structures. Subsequently, the population evolves and is optimized by means of genetic operators (a.o. crossover and mutation). The approach has been widely used in a variety of fields such as engineering science, economics science, medical science and environmental science.
In this study, GP was applied for predicting cyanobacteria populations in Lake Taihu by means of physical and chemical data. The coefficient of determination (r2) of a linear regression and visual comparison between predicted and measured data were used to determine the best performing predictive models generated by GP. The model was designed for 2-day ahead forecasting by imposing a time lag of two days between input and output data. For all applications of the GP, an initial population of 100 and a maximum number of generations of 80 were chosen based on trial and error.
Cellular automata constitute a mathematical system in which many simple components interact locally to produce globally complicated patterns of behaviour (Chen et al., 2002). A cellular automata system usually consists of a regular lattice of sites (cells or automata). Each site has some properties that are updated in discrete time steps according to local evolution rules, which are functions of the states of the cell itself and its neighbours (Chen and Mynett, 2006).
9 8
7
6 5
4
3 2
1
31 30 29 28 27
26 25
24
23 22
21
20
19
18 17
16 15
14
13 12 11 10
0 9 18 km CHINA
Zhihu Gang Liangxi River
Wangyu Rive r
Xu River
Taipu R iver W
ujin G ang Yincun
Gang
Dapu G ang
Jiapu River
Daqian Gang
A
B C
D
E F
G
H Lake Taihu
Selected sites Sampled sites Rivers
Figure 1: Map of Lake Taihu, where the large tributaries and sampled sites are named. Parts A~H indicate
Meiliang Bay, Zhushan Bay, Gonghu, Western Lake, Southern Lake, Main Lake, Eastern Lake and Southeast Lake.
2.3
Model setup
The Thiessen polygons based on the Voronoi method were used to set up the cells in the study area. In the CA model the Moore neighbourhood configuration is applied and the local evolution rules are built by GP from the measurement data obtained. Since the measured cyanobacteria population is affected by the neighbouring sites, assuming that the amount of nutrients and cyanobacteria population are constant in the whole lake, we eliminated the influence of neighbouring sites according to the weighted average method and build a generic predictive model under the condition of no winds, which is given by Eq. (1):
(1)
where is the average value of each variable; is the site; is the number of the site; is the area
that each site represents; is the total area of Lake Taihu. The converted data are used to produce the
generic predictive rule set. Then for each site the rule set is applied to predict the next level of cyanobacteria. Considering that the cyanobacteria at time step t+2 are affected by the cyanobacteria at time step t, the growth rate (R) is chosen as the output variable and the pH, water temperature, Secchi depth, NH4-N, NO3-N, PO4-P as the input variables. The growth rate formula is given by Eq. (2):
(2)
where represents the growth rate for site i at the time step t+2; represents the NO3-N values for site i at the time step t; represents the water temperature for site i at the time step t;
1
( * )
N
i i
i
V S V
S
=
=
å
V
i
N SiS
Rit+2
=(7.66+NO3it+0.0441* WTit−pHit−0.14 *PO4it) / (1.2+(NOi3t)2)
2 t i
R
+ NO3itWTit pH
i t Limnological variable Site 2 Site 6 Site 11 Site 12
Water temp. WT (°C) 1.90/17.95/30.70 2.00/18.46/32.50 1.60/17.96/32.60 2.50/18.29/32.60 Secchi depth SD (m) 0.25/0.33/0.41 0.27/0.38/0.48 0.28/0.36/0.43 0.31/0.51/0.71 pH 7.92/8.44/8.94 7.70/8.28/9.08 7.85/8.38/8.90 7.52/7.92/8.32 NO3-N (mg/L) 0.04/0.97/2.75 0.08/1.72/3.28 0.04/0.81/2.18 0.04/0.28/0.72
NH3-N (mg/L) 0.03/0.16/0.33 0.07/1.18/2.80 0.03/0.15/0.33 0.03/0.13/0.24
PO4-P (μg/L) 2.50/4.81/8.97 4.88/10.26/15.60 1.00/2.81/5.20 0.78/2.57/4.68
Cyanobacteria
(103cell/mL) 1.00/23.52/90.98 0.16/22.73/115.68 0.54/5.53/24.00 0.46/5.06/21.68
Limnological variable Site 17 Site 22 Site 24 Site 29
Water temp. WT (°C) 2.50/17.51/31.20 2.20/18.30/31.70 2.10/17.63/31.20 2.50/17.95/31.30 Secchi depth SD (m) 0.28/0.33/0.37 0.27/0.33/0.38 0.31/0.38/0.46 0.29/0.33/0.38 pH 7.85/8.32/8.80 7.62/8.43/9.26 7.82/8.21/8.63 7.74/8.31/8.93 NO3-N (mg/L) 0.67/2.05/2.63 0.04/1.04/2.62 0.04/0.49/1.28 0.04/1.13/2.32
NH3-N (mg/L) 0.03/0.15/0.36 0.03/0.25/0.46 0.03/0.11/0.20 0.03/0.17/0.36
PO4-P (μg/L) 1.56/4.01/7.93 1.43/4.94/9.30 0.91/1.96/3.71 1.04/4.03/7.80
Cyanobacteria
(103cell/mL) 0.93/10.76/42.70 0.80/23.46/116.60 0.72/2.67/11.85 0.66/11.33/52.72 Note: Data are minimum/mean/maximum
Table 1: Limnological variables measured at 8 typical sites in Lake Taihu from 2008 to 2012
represents the pH for site i at the time step t; represents the PO4-P values for site i at the time step t. For each site the measured cyanobacteria values are given as initial values. The predicted values of cyanobacteria are calculated iteratively according to Eq. (3):
(3)
where represents the predicted values of cyanobacteria for site i at the time step t+2;
represents the values of cyanobacteria for site i at the time step t. Then according to Eq. (4) the cyanobacteria for each site are updated to become the initial values at the next time step
(4)
where is the weight for site i, is the weight for neighbouring sites. represents the values of cyanobacteria for neighbouring site j at time step t+2. In Lake Taihu, the three prevailing winds are from the Southeast in spring and summer, Northeast in autumn, and Northwest in winter (Ma et al., 2009). The neighbouring sites are identified according to the flow field determined by the wind. Based on many trial experiments, was found to be 0.7; is calculated according to the inverse
distance between the affected site and its neighbouring site, while is 0.3.
3
Results
3.1
Temporal predictive modelling of cyanobacteria by CA
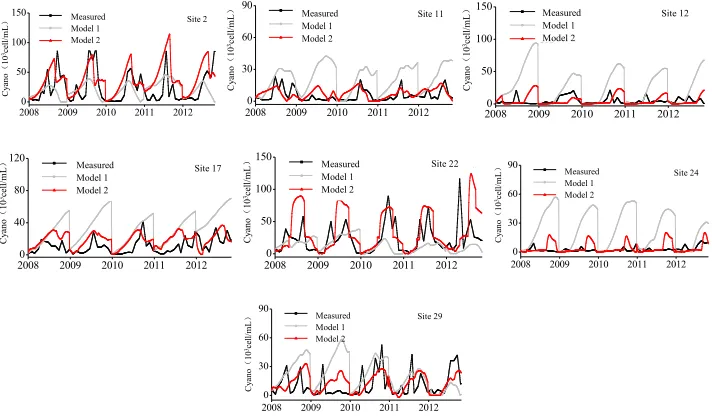
Figure 2 shows a comparison between the measured and predicted results for eight sites representing the eight parts identified within Lake Taihu. For site 2, site 6 and site 22 with hyper-eutrophication and very high cyanobacteria, the CA models could predict the magnitude and timing of cyanobacteria blooms well, and r2 values werewell above 0.54. For site 11, site 17 and site 29 with medium-eutrophication and high cyanobacteria, the r2 of the model fit werebetween 0.35 and 0.48. Although these r2 values are relative low, the CA models could still predict the outbreak of cyanobacteria blooms well. For sites 12 and 24 with light eutrophication and low cyanobacteria levels, the peak values of cyanobacteria predicted by the CA model were much higher than the measured results and the highest r2 was 0.12. This may be due to the fact that the Eastern Lake connects to the river outflow so the cyanobacteria flow out of the water body in reality, leading to the predictive values being higher than observed values.
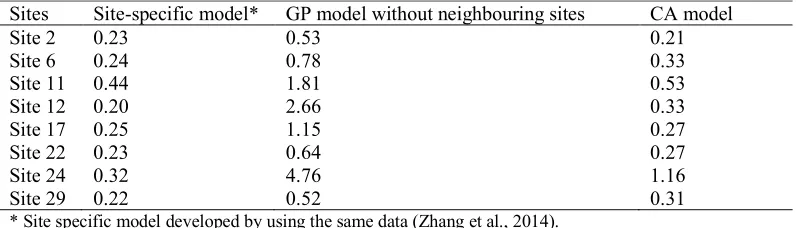
The results of the CA model were compared with those of the site-specific model (Zhang et al., 2014) and a genetic programming (GP) model that did not use any CA procedure (i.e. without the calculation of Eq. (4)). The comparisons are given in Table 2 to Table 4. Although the r2 in the CA models was relatively lower than the site-specific model, the CA models could better capture the outbreak of cyanobacteria in most areas except for the worst results, in the Eastern Lake. Compared to the GP models that did not account for the influence from neighbouring sites, the results from the CA models turned out to perform much better. For site 2, site 6 and site 22, the CA models achieved better predictive results. For site 12 and site 24, the timing of cyanobacteria blooms lagged in the GP model and the peaks were much higher than the measured results. Although the peak values in the CA models were substantially reduced, the timing of the peaks was still adequate. For site 11 and site 17, the peak values of cyanobacteria in the GP models came out higher than the measured results. The CA models greatly improved the results. For site 29, the CA models improved the peaks and timing of cyanobacteria blooms only slightly.
PO4it
2 2
t t t
i i i
C
+=
R
++
C
2
t i
C
+ ti
C
2 2 2
t t t
i i i j j
C
+=
a C
++
å
a C
+i
a
a
jC
tj 2+
i
a
a
jj
a
å
20080 2009 2010 2011 2012 50
100
150 Measured Site 2
未加CA CA Site 2 Measured Model 1 Model 2 Cy an o ( 10 3ce ll/ m L )
20080 2009 2010 2011 2012 30
60 90
Site 11Site 11 Measured Model 1 Model 2 Cy an o ( 10 3ce ll /m L )
20080 2009 2010 2011 2012
50 100 150 Site 12 Measured 未加CA CA Site 12 Measured Model 1 Model 2 Cy an o ( 10 3ce ll/ m L )
20080 2009 2010 2011 2012
40 80 120 Site 17 Measured 未加CA CA Site 17 Measured Model 1 Model 2 Cy an o ( 10 3ce ll/ m L )
20080 2009 2010 2011 2012 50 100 150 Site 22 Measured 未加CA CA Site 22 Measured Model 1 Model 2 Cy an o ( 10 3ce ll/ m L )
2008 2009 2010 2011 2012 0 30 60 90 Site 24 Measured 未加CA CA Site 24 Measured Model 1 Model 2 Cy an o ( 10 3ce ll/ m L )
20080 2009 2010 2011 2012 30 60 90 Site 29 Site 29 Measured Model 1 Model 2 Cy an o ( 10 3ce ll/ m L )
Figure 2: Comparison between measured and predicted results in eight sites representing eight typical parts
of Lake Taihu (model 1: GP models not considering the influences of neighbouring sites; model 2: Cellular automata prediction models considering the influences of neighbouring sites)
Sites Site-specific model* GP model without neighbouring sites CA model
Site 2 0.83 0.20 0.62
Site 6 0.83 0.22 0.56
Site 11 0.70 0.39 0.35
Site 12 0.77 0.11 0.08
Site 17 0.67 0.54 0.48
Site 22 0.78 0.14 0.54
Site 24 0.62 0.005 0.12
Site 29 0.73 0.11 0.40
* Site specific model developed by using the same data (Zhang et al., 2014).
Table 2: R-square values between the measured and predicted results for four models in eight sites
representing eight parts of Lake Taihu
3.2
Temporal predictive modelling of cyanobacteria by CA
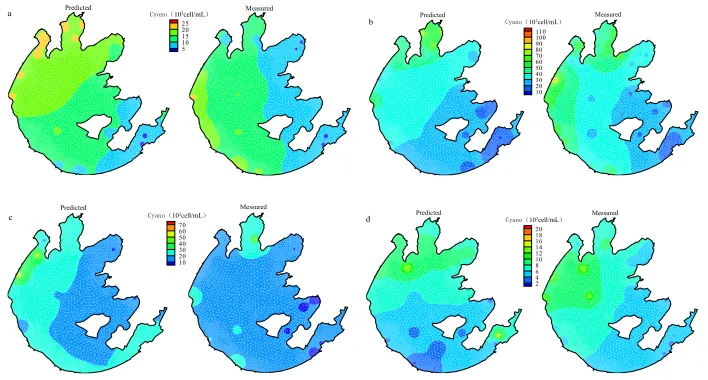
The spatial cyanobacteria dynamics in four seasons during 2008–2012 calculated by the CA model are presented in Figure. 3 which shows that CA models can capture the spatial patterns of cyanobacteria quite well compared to the observations, except that the predictive values in the Eastern Lake were higher than the measured values.
Sites Site-specific model* GP model without neighbouring sites CA model
Site 2 0.23 0.53 0.21
Site 6 0.24 0.78 0.33
Site 11 0.44 1.81 0.53
Site 12 0.20 2.66 0.33
Site 17 0.25 1.15 0.27
Site 22 0.23 0.64 0.27
Site 24 0.32 4.76 1.16
Site 29 0.22 0.52 0.31
* Site specific model developed by using the same data (Zhang et al., 2014).
Table 3: The absolute value of relative error between the measured and predicted results for four models
in eight sites representing eight parts of Lake Taihu
Sites Site-specific model* GP model without neighbouring sites CA model
Site 2 15 42 6
Site 6 20 32 21
Site 11 20 92 17
Site 12 24 100 95
Site 17 16 117 27
Site 22 18 77 30
Site 24 37 52 50
Site 29 30 59 40
* Site specific model developed by using the same data (Zhang et al., 2014).
Table 4: The mean error days between the measured and predicted results for four model in eight sites
representing eight parts of Lake Taihu
4
Discussion and conclusions
A spatial-temporal dynamic model of cyanobacteria blooms was developed using genetic programming to establish the transition rules from measurement data and integrate them into a cellular automata model set up for Taihu Lake, China. The resulting model proved to predict the magnitudes and timing of cyanobacteria blooms quite well for all areas except in the Eastern Lake which had a lower cyanobacteria population. Simultaneously, the model could capture the spatial dynamics of cyanobacteria and intuitively enhance our understanding of the spatial plaque formation mechanism of cyanobacteria blooms and help to improve the capability of cyanobacteria bloom management.
Clearly the site-specific models provided good results for each individual site, but did not provide a generic understanding of the underlying processes and key determining factors. The GP models based on aggregated data for all sites showed to overcome the disadvantages of site-specific models and turn out to have good portability. However, these models lack the ability to simulate spatial dynamics. In contrast, CA models can provide spatial dynamics, but the models produced from aggregated data gave worse results than the site-specific models. However, deploying GP to derive site-specific transition rules to be implemented into a spatially-explicit CA formulation, provides a generic modelling approach to site-specific conditions.
The evaluation criteria for models should not only focus on predictive capabilities at one particular site, but should also take into account the portability and generic interpretation. Overall, the results from the models employed in this study indicate that CA is a most effective method to deal with local interactions and model spatial variability. CA models not only consider the dynamic processes of cyanobacteria but also the spatial connection between the various sites, and have the capacity to simulate spatial-temporal dynamics. Compared to the traditional dynamic models for algal blooms based on two- or three-dimensional numerical simulation, this method avoids the complicated process of solving a great number of coupled partial differential equations, leading to higher
25 20 15 10 5
a Predicted Cyono(103cell/mL) Measured Predicted Measured
110
100 90 80 70 60 50 40 30 20 10 b Cyano(103cell/mL)
Predicted Messured
70 60 50 40 30 20 10
c Cyano(103cell/mL) Predicted Messured 20
18 16 14 12 10 8 6 4 2
d Cyano(103cell/mL)
Figure 3: Plots of spatial cyanobacteria dynamics in Lake Taihu in CA model (a) May 8, 2008; (b) Aug 7,
2011; (c) Oct 6, 2010; (d) Feb 9, 2012.
computational efficiency.
Genetic programming was used to formulate the transition rules for cyanobacteria population dynamics while the cellular automata approach was able to capture the spatial variability of bloom events. The results demonstrate that CA models can be used to forecast the magnitude, timing and location of cyanobacteria blooms by providing input on limnological time-series measurement data. The findings reveal that GP in combination with CA can provide a promising modelling approach in the field of spatial-temporal algal bloom forecasting.
Acknowledgements
This research was supported by the National Natural Science Foundation of China (No. 91547206, 51425902) and Jiangsu Water Resources Department (No. 2015005). The authors are grateful to Dr. Catherine Rice for proofreading the manuscript.
Reference
Alonso, D., & Solé, R. V. (2000). The DivGame simulator: a stochastic cellular automata model of rainforest dynamics. Ecological Modelling,133(1), 131-141.
Banzhaf, W., Nordin, P., Keller, R. E., & Francone, F. D. (1998). Genetic programming: an introduction: on the automatic evolution of computer programs and its applications. Morgan Kaufmann Publishers Inc.
Chan, W. S., Recknagel, F., Cao, H., & Park, H. D. (2007). Elucidation and short-term
forecasting of microcystin concentrations in Lake Suwa (Japan) by means of artificial neural networks and evolutionary algorithms. Water Research,41(10), 2247-55.
Chen, Q., & Mynett, A. E. (2003). Effects of cell size and configuration in cellular automata based prey–predator modelling. Simulation Modelling Practice & Theory,11(7), 609-625.
Chen, Q., & Mynett, A. E. (2003). Integration of data mining techniques and heuristic
knowledge in fuzzy logic modelling of eutrophication in Taihu Lake. Ecological Modelling,162(1), 55-67.
Chen, Q., & Mynett, A. E. (2006). Modelling algal blooms in the dutch coastal waters by integrated numerical and fuzzy cellular automata approaches. Ecological Modelling,199(1), 73-81.
Chen, Q., Mynett, A. E., & Minns, A. W. (2002). Application of cellular automata to modelling competitive growths of two underwater species chara aspera, and potamogeton pectinatus, in Lake Veluwe. Ecological Modelling,147(3), 253-265.
Chen, Q., Zhang, C., Recknagel, F., Guo, J., & Blanckaert, K. (2014). Adaptation and multiple parameter optimization of the simulation model SALMO as prerequisite for scenario analysis on a shallow eutrophic lake. Ecological Modelling,273(7), 109-116.
Chen, Y., Qin, B., Teubner, K., & Dokulil, M. T. (2003). Long-term dynamics of phytoplankton assemblages: microcystis-domination in Lake Taihu, a large shallow lake in china. Journal of Plankton Research,25(4), 445-453.
Cole, T. M. (2003). CE-QUAL-W2 : A two-dimensional, laterally averaged, hydrodynamic and water quality model, Version 3.2 user manual.
Gal, G., Hipsey, M. R., Parparov, A., Wagner, U., Makler, V., & Zohary, T. (2009). Implementation of ecological modeling as an effective management and investigation tool: Lake Kinneret as a case study. Ecological Modelling,220(13–14), 1697-1718.
Guo, L. (2007). Doing battle with the green monster of Taihu Lake. Science,317(5842), 1166.
Hamrick, J. M. (1992). A three-dimensional environmental fluid dynamics computer code: theoretical and computational aspect.
Jia, J., Chen, Q., & Lauridsen, T. L. (2016). A systematic investigation into the environmental fate of microcystins and the potential risk: study in Lake Taihu. Toxins,8(6), 170.
Koza, J. R. (1994). Genetic Programming II. MIT press, USA (Vol.83, pp.53--65).
Koza, J. R. (1996). On the programming of computers by means of natural selection, MIT press, USA, 1996, vol 1.
Lin, Y. (2014). Unstructured cellular automata in ecohydraulics modelling. Civil Engineering & Geosciences.
Ma, W., Liao, W. G., Kuang, S. F., & Yu, X. Z. (2009). Analysis on designed wind field condition for pollution capacity calculation in a large-scale shallow lake. Journal of Hydraulic Engineering,40(11), 35-41.
Maier, H. R., Dandy, G. C., & Burch, M. D. (1998). Use of artificial neural networks for modelling cyanobacteria anabaena, spp. in the River Murray, South Australia. Ecological Modelling, 105(2), 257-272.
Moll, A., & Radach, G. (2003). Review of three-dimensional ecological modelling related to the North Sea Shelf system: part 1: models and their results. Progress in Oceanography,57(2), 175-217.
Qin, B., Xu, P., Wu, Q., Luo, L., & Zhang, Y. (2007). Environmental issues of Lake Taihu, China. Hydrobiologia,581(1), 3-14.
Qin, B., Zhu, G., Gao, G., Zhang, Y., Li, W., Paerl, H. W., & Carmichael, W.W. (2010). A drinking water crisis in Lake Taihu, China: linkage to climatic variability and lake management.
Environmental Management,45(1), 105-112.
Recknagel, F., Bobbin, J., Whigham, P., & Wilson, H. (2003). Comparative application of artificial neural networks and genetic algorithms for multivariate time-series modelling of algal blooms in freshwater lakes. Journal of Hydroinformatics,4(2), 125-133.
Whigham, P. A., & Recknagel, F. (2001). An inductive approach to ecological time series modelling by evolutionary computation. Ecological Modelling,146(1), 275-287.
Yang, M., Yu, J., Li, Z., Guo, Z., Burch, M., & Lin, T. F. (2008). Taihu Lake not to blame for Wuxi's woes. Science,319(5860), 158-158.
Ye, F., Chen, Q., & Li, R. (2010). Modelling the riparian vegetation evolution due to flow regulation of Lijiang River by unstructured cellular automata. Ecological Informatics,5(2), 108-114.
Zhang, H., Hu, W., Gu, K., Li, Q., Zheng, D., Zhai, S. (2013). An improved ecological model and software for short-term algal bloom forecasting, Environmental Modelling & Software, 48(10), 152-162.
Zhang, X., Recknagel, F., Chen, Q., Cao, H., & Li, R. (2015). Spatially-explicit modelling and forecasting of cyanobacteria growth in Lake Taihu by evolutionary computation. Ecological Modelling,306, 216-225.