IJPAR |Vol.6 | Issue 1 | Jan - Mar -2017 Journal Home page: www.ijpar.com
Research article Open Access
RP-HPLC method development and validation of levamisole in pure and
pharmaceutical formulation
B.Thangabalan, Anusha.G, S.Manohar Babu, B. Ram Sarath Kumar
SIMS College of Pharmacy, Mangaldas nagar, Guntur-522001. A.P. India.
*Corresponding Author:Anusha.G
ABSTRACT
A simple, fast, precise, selective and accurate RP-HPLC method was developed and validated for the determination of levamisole from pharmaceutical formulation. Chromatographic separation was achieved on a YMC C18 column (250 x 4.6mm, 5 µ particle size) using a mobile phase acetonitrile and water in the ratio of 80:20%V/V. The flow rate was 0.7ml / min and effluent was detected at 217nm. The retention time of levamisole was found to be 6.2min. Linearity was observed in the concentration range of 10 -50µg / ml .The method was validated according to ICH guidelines with respect to specificity, linearity, accuracy, precision and robustness. The method developed can be used for the routine analysis of levamisole.
Keywords: Levamisole, RP-HPLC
INTRODUCTION
Levamisole is chemically (s)-6-phenyl-2,3,5,6-tetrahydroimidazo[2,1-b] [1,3]thiazole used as anti helmenthic.
Figure 1: Chemical structure of levamisole
Several HPLC, GC and LC/MS-MS methods have been reported for the analysis of levamisole in plasma that suffer from either undesirably long
chromatographic run times and requirement for gradient analysis or use of an internal standard.
chromatography method for the estimation of levamisole in pure and pharmaceutical dosage form without any derivatization and having short retention time. This method was found to be linear, precise, accurate, sensitive, specific, and robust, and therefore suitable for routine analysis.
MATERIALS AND METHOD
HPLC Instrumentation and Chromatographic
conditions
The analytical separations were carried out on a waters 2487 HPLC system equipped with Photo Diode Array detector. The output of signal was monitored and integrated using LC – solutions 2000 software. The analytical column was YMC C18 (250 × 4.6mm, 5µ). Mobile phase consisted Acetonitrile and water in the ratio of 80:20% v/v. Mobile phase was mixed, filtered through 0.45µ membrane filter and degassed under ultrasonication. The mobile phase was used as diluent. The flow rate was 0.7 ml/min and runtime was 8 minute. The column was maintained at ambient temperature. UV detection was measured at 217 nm and the volume of sample injected was 20 μl.
Preparation of standard stock solution
100mg of levamisole was weighed accurately and dissolved in 100ml of mobile phase to get the concentration of 1000 µg/ml. Resultant solution was filtered through Whatman filter paper. The standard chromatogram for levamisole (20μg/ml) was shown in figure 2.
Preparation of working standard solution
Working standard solutions of levamisole were prepared by accurately transferring the (0.1,0.2,0.3,0.4, and 0.5ml) aliquots of the standard stock solution into a series of five 10 ml volumetric flasks. The volume was made up to mark with mobile phase to obtain concentration range of 10 – 50 µg/ml.
Preparation of sample solutions
25mg of tablet powder was weighed accurately and was taken into 25mL volumetric flask and then the sample was diluted to 25ml with mobile phase to get concentration of 1000µg/ml and used for analysis.
RESULTS AND DISCUSSION
HPLC method development and optimization
Table 1: Optimized chromatographic parameters Elution : Isocratic
Mobile phase : Acetonitrile: water (80:20) Column : YMCc18 column
Flow rate : 0.7ml/min Detection : 217nm Injection volume : 10μl Temperature : Ambient Retention time : 6.2min Run time : 8min Concentration : 10 - 50μg/ml
Validation of the method [8], [11],[12]
When method development and optimization are complete, it is necessary to accomplish method validation. The validation studies include linear range (correlation coefficient), method precision (RSD, %), method accuracy (% recovery and RSD, %), sensitivity studies (LOD & LOQ), and robustness.
System suitability studies [8],[11],[12]
System-suitability tests are an integral part of method development and are used to ensure adequate performance of the chromatographic
system. Retention time (RT), tailing factor (T), and peak asymmetry (AS) were evaluated. The system suitability test was performed using five replicate injections of standards before analysis of samples. The system suitability method acceptance criteria set in each validation run were: capacity factor > 2.0, tailing factor ≤ 2.0 and theoretical plates > 2000. In all cases, the relative standard deviation (R.S.D) for the analytic peak area for two consecutive injections was < 2.0%. System suitability parameters were shown in table 2.
Table 2: System suitability parameters
Parameters Values
Tailing factor 1.02 Theoretical plates 3800 Retention Time 6.2 min
%RSD 0.2359
Linearity [8],[11],[12]
The linearity of the method was evaluated by preparing six series of standard solutions of levamisole in the range of 10 – 50 µg/ml in mobile phase and injecting the solutions into the HPLC system. Excellent correlation between levamisole
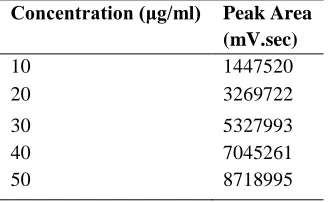
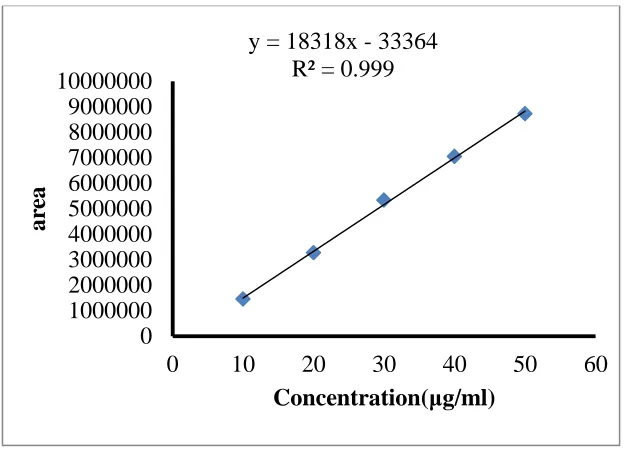
peak area and concentration was observed with R2 = 0.999 (Figure.3). The regression equation was found to be Y=18318x-33364. Statistical data are presented in table 3 and the calibration curve was shown in figure 3.
Table 3: Linearity results for levamisole Concentration (μg/ml) Peak Area
(mV.sec)
10 1447520
20 3269722
30 5327993
40 7045261
Figure 3: Calibration curve for Levamisole
Precision [8],[11],[12]
System precision [8],[11],[12] (Repeatability)
To study precision, five replicate standard solutions of levamisole (20µg/ml) were prepared
and analyzed using the proposed method. The percent relative standard deviation (% RSD) for peak responses was calculated. Results of system precision studies were shown in table 4.
Table 4: Results of system precision for levamisole
Sl.no Retention time (min) Peak area
1 6.567 3269721
2 6.546 3278563
3 6.545 3389672
4 6.524 3232761
5 6.435 3268544
Mean 6.5234 3287852
SD 0.051704 59561.22
%RSD 0.792592 1.811554
Method
precision
[8],
[11],
[12]
(Reproducibility)
The intraday and inter-day precision of the proposed method was determined by analyzing the corresponding responses 5 times on the same day
and on different days for concentration of sample solutions of 20µg/ml. The result was reported in terms of relative standard deviation (% RSD). Results of method precision studies were shown in table 5.
y = 18318x - 33364
R² = 0.999
0
1000000
2000000
3000000
4000000
5000000
6000000
7000000
8000000
9000000
10000000
0
10
20
30
40
50
60
ar
ea
Table 5: Results of Method precision for levamisole
S.no Standard area =3307922
Area % Labelled Claim
1 3345817 98.8
2 3325894 99.4
3 3369841 98.1
4 3258974 101.5
5 3374281 98.3
Mean 3334961 99.22
S.D 46735.33 1.370036 %RSD 1.401375 1.380807
Intermediate precision
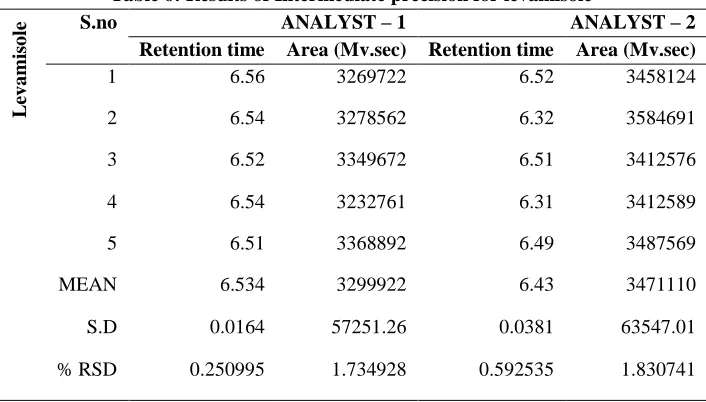
The intermediate precision of the proposed method was determined by performing the method by two analysts (Analyst 1 and Analyst 2) for
concentration of sample solutions 20µg/ml. The percent relative standard deviation (% RSD) for peak responses was calculated. The results for intermediate precision were shown in table 6.
Table 6: Results of Intermediate precision for levamisole
L
ev
a
mis
o
le S.no ANALYST – 1 ANALYST – 2
Retention time Area (Mv.sec) Retention time Area (Mv.sec)
1 6.56 3269722 6.52 3458124
2 6.54 3278562 6.32 3584691
3 6.52 3349672 6.51 3412576
4 6.54 3232761 6.31 3412589
5 6.51 3368892 6.49 3487569
MEAN 6.534 3299922 6.43 3471110
S.D 0.0164 57251.26 0.0381 63547.01
% RSD 0.250995 1.734928 0.592535 1.830741
Accuracy [8],[11],[12]
Accuracy of the method was confirmed by the standard addition method, which was carried out by performing recovery studies at 2 different concentrations 20µg/mL and 40µg/mL of these expected, in accordance with ICH guidelines, by replicate analysis (n=2). Known amount of standard drug solution (20µg/ml) was added to a pre analyzed sample solution (20, 40µg/ml) and percentage drug content was measured. The
closeness of obtained value to the true value indicates that the proposed method is accurate. %Recovery = [(Ct –Cpa)/ Cs] × 100.
Where, Ct = Total concentration of analyte Cpa = Concentration of pre-analysed sample
Cs = Concentration of standard added to pre-analyzed sample.
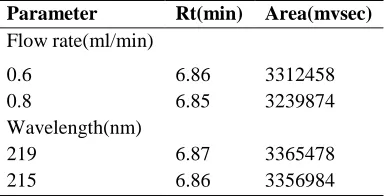
Robustness [8],[11],[12]
chromatographic condition. The robustness was checked by changing parameters like flow rate of mobile phase and detection wavelength
Change in the detection wavelength by ± 2nm (215nm and 219nm)
Change in flow rate by ± 0.1 ml/minute (0.6 ml/min and 0.8 ml/minute)
After each change, sample solution was injected and % assay with system suitability parameters were checked.
Robustness values were given in table 7
Table 7: Results of Robustness for levamisole
Parameter Rt(min) Area(mvsec)
Flow rate(ml/min)
0.6 6.86 3312458
0.8 6.85 3239874
Wavelength(nm)
219 6.87 3365478
215 6.86 3356984
Limit
of
Detection
and
Quantitation
[8],[11],[12]
Detection and Quantitation limit were calculated by the method based on the standard deviation () and slope of the calibration plot, using the formula
Limit of Detection × 3.3/S Limit of Quantitation × 10/S
Where = the standard deviation of the response. S = the slope of the calibration curve (of the analyte).
Results of LOD & LOQ were found as 0.2040 µg/ml and 0.6120 µg/ml.
Specificity
Specificity of an analytical method is its ability to measure the analyte accurately and specifically in the presence of component that may be expected to be present in the sample matrix. Chromatograms of standard and sample solutions were compared in order to provide an indication of specificity of the method.
Assay
of
pharmaceutical
formulation
[8],[11],[12]
The proposed validated method was successfully applied to determine levamisole in their pharmaceutical dosage form and the % Assay results were shown in table 8.
Table 8: Results of % assay by using RP – HPLC method
Drug Sl.no Amount found(mg) Test area Standard area %Assay
(AT /AS*100) levamisole 1 149.6735 3300722
3307922
99.78234
2 149.766 3302761 99.84398
3 149.5756 3298562 99.71704
CONCLUSION
A simple, rapid, accurate, and precise RP-HPLC method for the analysis of levamisole in pure and in pharmaceutical dosage forms had been developed and validated in accordance with ICH guidelines. The RP-HPLC method developed is cost-effective due to short retention time which enabled analysis of levamisole samples with a small amount of mobile phase. From the % RSD values of precision and recovery studies the method
REFERENCES
[1]. James W. Robinson, Eileen M. Skelly Frame, George M. Frame Under graduate instrumental analysis, 5, 2005, 1.
[2]. H. Kaur: Instrumental methods of chemical analysis, 4, 2008, 9-12.
[3]. J. Mendham, RC. Denney: Vogel’s text book of quantitative chemical analysis, 6, 2005, 31-33. [4]. Y.R. Sharma : Elementary organic spectroscopy , 4, 2010, 2.
[5]. Willard, Merit: Instrumental methods of analysis, CBS publishers and Distributors, New Delhi, 7, 1986, 514. [6]. Ashutosh kar: Pharmaceutical Drug analysis, new age international publishers, 2, 2005, 452,461-466. [7]. B.K. Sharma: Chromatography, Goel Publishing House, Meerut, 19, 2007, 10.
[8]. Skoog, Holler, Nieman: Principles of instrumental analysis, 5, 2007, 728-731. [9]. William Kemp: Organic spectroscopy, 2008, 251.
[10].Dr. S. Ravi Shankar: Text book of pharmaceutical analysis, Tirunelveli: Rx Publications, 3, 2006, 6-18.
[11].David G. Watson, Pharmaceutical Analysis, A Text book for pharmacy students & pharmaceutical chemists; Churchill Livingstone Publications, 1999, 197-199.
[12].Chatwal Anand - Instrumental Methods of Chemical Analysis, Himalaya Publishing House, 2001, 634-635. [13].Debukanski BW, Degroodt JM, Beernaert H, Determination of levamisole and thiabendazole in meat by HPLC
and photodiode array detection. Zeitschriftfür Lebensmittel Untersuchung und Forschung, 193(6), 1991, 545-547.
[14].Marriner S, Galbraith EA, Bogan JA, Determination of the anthelmintic levamisole in plasma and gastro-intestinal fluids by high-performance liquid chromatography. Analyst, 105(1255), 1980, 993-996.
[15].Vandamme TF, Demoustier M, Rollmann B, Quantitation of levamisole in plasma using high performance liquid chromatography. European journal of drug metabolism and pharmacokinetics, 20(2), 1995, 145-149. [16].Sari P, Sun J, Razzak M, Tucker IG, HPLC assay of levamisole and abamectin in sheep plasma for application
to pharmacokinetic studies. Journal of liquid chromatography & related technologies, 29(15), 2006, 2277-2290. [17].Du Preez JL, Lötter AP, Solid-phase extraction and HPLC determination of levamisole hydrochloride in sheep
plasma. The Onderstepoort journal of veterinary research, 63(3), 1996, 209.
[18].Sari P, Razzak M, Tucker IG, Rapid, simultaneous determination of levamisole and abamectin in liquid formulations using HPLC. Journal of liquid chromatography & related technologies, 27(2), 2005, 351-364. [19].Cannavan A, Blanchflower WJ, Kennedy DG, Determination of levamisole in animal tissues using liquid
chromatographythermospray mass spectrometry. Analyst, 120(2), 1995, 331- 333.