63
EIGHT PHASE OPTIMAL SEQUENCE DESIGN FOR
MIMO RADAR USING PSO
*Mr.J Pandu, **Dr.C.Naidu ***Dr.N.Balaji
*Department of ECE Sreyas IET, Hyderabad ,India ** Department of ECE, VNRVJIET, Hyderabad, India ***Department of ECE, UCEN,JNTUK, Guntur , India
ABSTRACT
MIMO Radar applications desire a set of sequences with discretely low autocorrelation side lobe peaks and low cross correlation. Invade such sequences is a combinal problem. If the autocorrelation and cross correlation are convenient in the aperiodic sense then there are hardly any theoretical aids available thus the problem of signal design referred to above is a defying problem for which many optimization algorithms are available those are,artificial bee colony(ABC), ant colony optimization algorithm, Genetic algorithm and particle swarm optimization algorithm were reported in the journal papers . This paper intent at gadget of an efficient optimization algorithm is design to find an optimal solution for pulse compression radar .these sequences are useful for MIMO radar applications .The proposed optimization algorithm i.e particle swarm optimization algorithm for identifying the optimal pulse compression sequence .
Keywords: polyphase , orthogonal waveforms ,cross spectral density matrix(CSDM),MIMO Radar,ASP .
INTRODUCTION
whose BT=1.The technique of pulse compression in waveforms is employed either in the form of Frequency coding or Phase coding.
An LFM signal is a frequency modulated waveform whose carrier frequency varies linearly with time, over a specific period. This is one of the oldest and frequently used waveforms. It finds application in CW and pulsed radars. Since an LFM waveform is a constant amplitude waveform, it makes sure that the amplifier works efficiently. Also, this waveform spreads the energy widely in frequency domain. In Non-linear Frequency Modulation the carrier frequency of the waveform is varied according to any non-linear law over time. The variation can be symmetrical or asymmetrical over time. Some of the nonlinear frequency modulations can be summed up as quadratic FM with even symmetry about the carrier frequency, quadratic FM with odd symmetry. With the advent of high speed digital hardware another class of signals evolved where the FM is digitally generated as a staircase stepped FM.
This can be broadly classified into binary and M phase coding. Following are various popular phase coded waveforms. First is Binary phase coding ,in this technique, the phase of any sub pulse takes any of the two alphabets values, either 1 or -1, according to the sequence. Various types of binary codes with good autocorrelation properties are used in bi-phase coding. Some of the commonly used codes are Barker codes, Maximal length sequences is 13. In poly phase coding the phase of the sub pulses takes any of the M- arbitrary values. Frank codes, p1 code, p2 code ,p3 code, and p4 coded waveform are some of the commonly used sequences in Polyphase coding technique. The range side lobes for polyphase coded waveforms are lower than that of binary-coded waveform of same length.
ORTHOGONAL WAVE FORMS
Orthogonal poly phase code consists of Length of the sequence (Nc),set size of (L) and Phase of the sequence (M). Signals which probably containing Nc sub pulses represented by a complex number sequence, the set of the sequence is given by
𝑠𝑙 𝑛 = 𝑒𝑗 ∅𝑙 𝑛 (1)
Where n=1,2, …., Nc and l=1, 2, …., L Where Øl (n), (0≤Øl (n)<2π) is the phase of sub pulse n of signal.
∅𝑙(𝑛)𝜖 0, 2𝜋 𝑀𝑐, 2.
2𝜋
𝑀𝑐, … , 𝑀𝑐 − 1 .
2𝜋
𝑀𝑐 (2)
65
Assume a set a poly phase codes with contains the set as Nc whose set size is L, one can briefly signify the phase values of S with following L× Nc phase matrix.
𝑆 𝐿, 𝑁𝑐, 𝑀𝑐 =
𝜙1(1) 𝜙2(2) … 𝜙1(𝑁𝑐)
𝜙2(1) 𝜙2(2) … 𝜙2(𝑁𝑐)
∶ 𝜙𝐿(1)
∶
𝜙𝐿(2) … ∶ 𝜙𝐿(𝑁𝑐)
(4)
Here the phase sequence in row (1≤ l ≤ L) is the sequence of polyphase signal , and complete elements in the matrix can be elected from the set of phases .From the cross correlation and autocorrelation distinguishing of orthogonal polyphase codes, we get.
𝐴 𝜙𝑙, 𝑘 =
1 𝑁𝑐
exp 𝑗 𝜙𝑙 𝑛 − 𝜙𝑙 𝑛 + 𝑘 = 0 0 < 𝑘 < 𝑁𝑐 𝑁𝑐−1
𝑛=1
1
𝑁𝑐 exp 𝑗 𝜙𝑙 𝑛 − 𝜙𝑙 𝑛 + 𝑘 = 0 − 𝑁𝑐 < 𝑘 < 0
𝑁𝑐
𝑛=−𝑘+1
For l=1, 2, …. L (5)
𝐶(𝜙𝑙, 𝑘) ≈
1
𝑁𝑐 exp 𝑗 𝜙𝑞 𝑛 − 𝜙𝑝 𝑛 + 𝑘 = 0 0 < 𝑘 < 𝑁𝑐
𝑁𝑐−𝑘
𝑛 =1
1 𝑁𝑐
exp 𝑗 𝜙𝑞 𝑛 − 𝜙𝑝 𝑛 + 𝑘 = 0 − 𝑁𝑐 < 𝑘 < 0 𝑁𝑐
𝑛=−𝑘+1
For p≠q and p, q=1, 2, … L (6)
where and are the aperiodic function of autocorrelation polyphase sequence
and the function of cross correlation sequences and .Where k defined as the discrete time index. Therefore, crafting of an orthogonal polyphase code made corresponding to the building of a
polyphase matrix in equation 6 with and constraints in equation 5 and
correlation energy in equation 7 .Here is the weight factor if it is less than one means more weightage is given to auto-correlation and less weightage is given to cross-correlation.
𝐸 = 𝐴(𝜙𝑙, 𝑘) 2+ 𝜆 𝐶(𝜙
𝑝, 𝜙𝑞, 𝑘) 2 𝑁𝑐−1
𝑘=−(𝑁𝑐−1)
𝐿
𝑞=𝑝+1 𝐿−1
𝑝=1 𝑁𝑐
𝑘=1 𝐿
𝑙=1
(7)
MIMO RADAR SIGNAL MODEL
A. Autocorrelation Function and Transmit Beam patterns
In previous papers [5,7,8] it was shown how the choice of transmit waveform signal correlation could affect the transmit beam pattern of a MIMO radar. For an array independently transmitting narrowband wide-sense stationary waveforms, the transmit beam pattern function is
𝑃𝑁(𝜃) = 𝐴𝐻(𝜃)𝑅𝑎(𝜃) (8)
Here 𝐴𝐻(𝜃) is the narrow-band transmit array steering vector parameterized by the angle 𝜃 and R is
the zero-lag signal correlation matrix. Similarly, for an array transmitting wideband signals, the transmit beam pattern is
𝑃𝑤(𝜃) = 𝐴𝐻 𝜃, 𝑓𝑐+ 𝑓𝜗 S(f)a(𝜃, 𝑓𝑐+ 𝑓𝜗) (9)
Again 𝐴𝐻 𝜃, 𝑓
𝑐+ 𝑓𝜗 , is the narrowband transmit steering vector parameterized by the angle 𝜃, but now
specifically calculated at the frequency 𝑓𝑐+ 𝑓𝜗.The matrix S( f ) is the cross-spectral density matrix
(CSDM) of the transmitted waveforms. It is defined as the element wise Fourier transform of the signal correlation matrix.
𝑆(𝑓) = 𝑅(𝜏)𝑒𝑇 −𝑗 2𝜋𝑓𝑡𝑑𝑡
0 (10)
Returning to the definition of the MIMO ambiguity function, we can identify the role of the transmit beam pattern. To begin, consider the second model simplification. The term 𝐴𝐻𝑇 𝜃1 𝑅4(𝜃1𝜃0, 𝑗) 𝐴𝑇 𝜃0
appears. If the two target parameters are equal, 𝜃1= 𝜃0, this term becomes the transmit beam pattern.
The dependence of the covariance function on j drops out is
𝑅𝑖,2Î(𝜃1,𝜃1, j) = 𝑠𝑖 𝑡 − 𝜏𝑖,𝑗 𝑝1 𝑠𝑖 ∗(𝑡 − 𝜏𝑖 ,𝑗 𝑝1 𝑑𝑡)
= 𝑠𝑖(𝑡)𝑠𝑖 ∗(𝑡 − 𝜏𝑖,𝑗 𝑝1 − 𝜏𝑖 ,𝑗 𝑝1 )𝑑𝑡)
67 = 𝑅𝑖,2Î( 𝜏𝑖 𝑝1 − 𝜏𝑖 𝑝1 ) (11)
= 𝑠𝑖,𝑖 𝑓 𝑒
𝑗 2𝜋 𝜏𝑖 𝑝1 −𝜏𝑖 𝑝1 𝑓df (12)
Taking the result of above equation and substituting back into the quadratic form, one finds the expression for the wideband transmit beam pattern
𝐴𝐻𝑇 𝜃1 𝑅2(𝜃1𝜃0, 𝑗)𝐴𝑇 𝜃1 = 𝑠𝑖,𝑖 𝑓 𝑒𝑗 2𝜋 𝜏𝑖 𝑝1 −𝜏𝑖 𝑝1 𝑓𝑒𝑗 2𝜋 𝜏𝑖 𝑝1 −𝜏𝑖 𝑝1 𝑓𝑐𝑑𝑓 𝑁𝑇
𝐼=1 𝑁𝑇
𝑖=1
= 𝐴𝐻𝑇 𝑓𝑐+ 𝑓 𝑆(𝑓)𝐴𝑇 𝑓𝑐+ 𝑓 𝑑𝑓 (13)
The above equation (9) is the same as equation (13) except for a slight notation difference. We find the presence of the parameter p1 instead of 𝜃. The difference is that p1 is a true spatial parameter, whereas 𝜃 is only an angle parameter. If the far-field simplifications were applied, then the angle parameter 𝜃 would appear. Regardless, this equation is telling us how much gain one can expect for targets located at different points spatially. It is much easier to identify the transmit beam pattern in the narrowband simplification of the cross-correlation function . The quadratic form a
𝐴𝐻𝑇 𝜃1 𝑅 ∆𝜏, ∆𝑓 𝐴𝑇(𝜃0) becomes the narrowband transmit beam pattern when 𝜃0= 𝜃1(∆𝜏 = 0, ∆𝑓 = 0).
Now, if we return the above equation, we see that letting 𝜃0= 𝜃1 results in the cross correlation
function becoming a scaled version of the transmit beam pattern. This is actually just the autocorrelation function defined as
𝛹2 𝜃
1, 𝜃0 = 𝑎𝑇𝑅𝐻 𝑁𝑅
𝑗 =1
𝜃1 𝑅2(𝜃1,𝜃1,j) 𝑎𝑇 𝜃1, 𝑒−𝑗 2𝜋𝜏𝑗 𝑝1 (𝑓𝑐+𝑓𝜗 1)𝑒−𝑗 2𝜋𝑖 𝜏𝑗 𝑝1 (𝑓𝑐+𝑓𝜗 1)
= 𝑎𝑇𝑅𝐻 𝑁𝑅
𝑗 =1
𝜃1 𝑅2(𝜃1,𝜃1,j) 𝑎𝑇 𝜃1
= 𝑁𝑅 𝑎𝑇𝐻 𝑝1, 𝑓𝑐+ 𝑓 𝑆 𝑓 𝑎𝑇(𝑝1, 𝑓𝑐+ 𝑓)𝑑𝑓
=∅ 𝜃1 (14)
OPTIMIZATION ALGORITHMS FOR MIMO RADAR
SIMULATION RESULTS
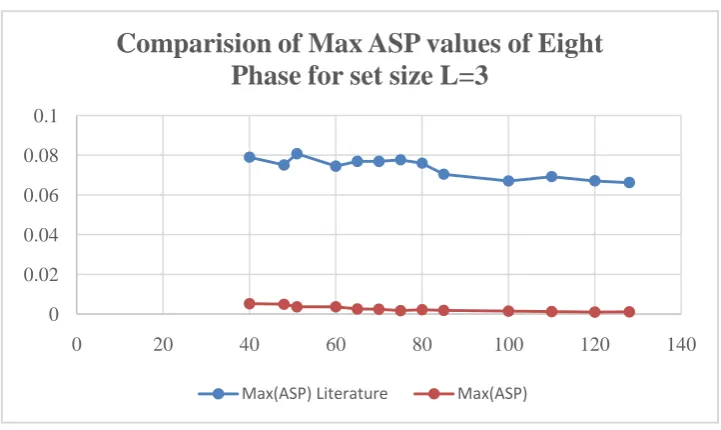
In this paper optimal sequence for MIMO Radar using Particle Swarm Optimization Algorithm is carried out. In the present work, Particle Swarm Optimization Algorithm is to optimize the eight phase polyphase coded sequence to achieve good auto correlation and cross- correlation properties . On the basis of algorithm the poly-phase , eight phase coded sequences are set with lengths varying from 7 to 128 and number of transmitting ,receiving antennas are L=3 and L=4. The Maximum autocorrelation sidelobe peak (ASP) and Maximum cross correlation peak (CP) values obtained using proposed algorithm is compared with literature values. The results shows an advance in Autocorrelation Sidelobe Peak (ASP)s . It infers that sequences generated by Particle Swarm Optimization Algorithm have good correlation properties.
Table.I Auto Correlation Side Lobe Peaks of Six Phase Synthesized Sequence Sets with L=3, and Sequence Length N= 40 to 128.
S.No Length of
Sequence
Max(ASP) Reported
Max(ASP) Literature
1 40 0.0052 0.079
2 48 0.0049 0.075
3 51 0.0036 0.080
4 60 0.0036 0.074
5 65 0.0025 0.076
6 70 0.0024 0.076
7 75 0.0017 0.077
8 80 0.0022 0.076
9 85 0.0018 0.070
10 100 0.0015 0.067
11 110 0.0012 0.069
12 120 0.0010 0.067
13 128 0.0011 0.066
69
Figure 1.Max (ASP) values of Eight phase sequence set L=3 designed using PSO compared with literature values
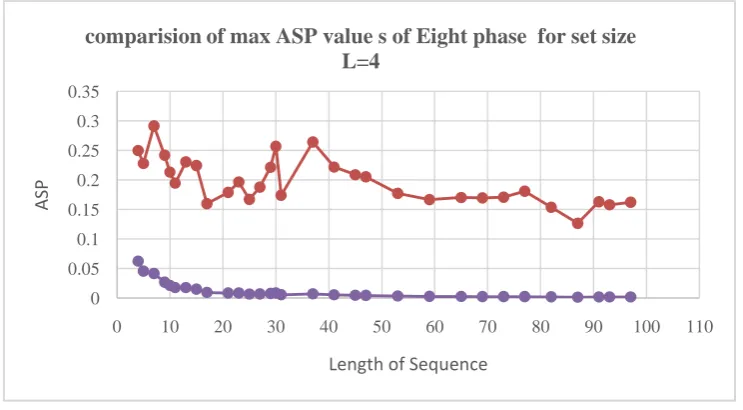
Table II Auto Correlation side lobe peaks of Six phase synthesized sequence sets with L=4, and Sequence length N= 7 to 117.
S.No Length of
Sequence
Max(ASP) Reported
Max(ASP) Literature
1 7 0.0625 0.079
2 13 0.0456 0.0751
3 17 0.0268 0.0720
4 21 0.0123 0.0731
5 29 0.0177 0.0721
6 31 0.0149 0.0769
7 37 0.0094 0.0777
8 45 0.0085 0.0762
9 49 0.0085 0.0744
10 53 0.0066 0.0731
11 61 0.0069 0.0792
12 87 0.0076 0.0771
13 95 0.0085 0.0762
14 97 0.0056 0.0741
The auto correlation side lobe peak values obtained for different length of the sequences .the average value of ASPs is 0.0069 it is better than the literature values.
0 0.02 0.04 0.06 0.08 0.1
0 20 40 60 80 100 120 140
Comparision of Max ASP values of Eight
Phase for set size L=3
Figure 3.Max (ASP) values of Eight phase sequence set L=4 designed using PSO compared with literature values.
Table I compares the obtained values of ASPs with literature values. ASPs of Eight phase synthesized sequence sets with three transmitting antennas (L=3) , and Sequence length varying from N= 40 to 128 are tabularized and Table II compares the obtained values of ASPs with literature values. Auto correlation side lobe peaks of four transmitting antennas (L=4) synthesized sequence sets ,and Sequence length various from N= 7 to 117. Fig. 1 and Fig.2 illustrates the Max (ASP) values of L=3 and L=4 designed using Particle swarm optimization algorithm compared with literature values .
CONCLUSION
Properties of Auto correlation side lobe peaks of Eight phase produced order sets with three and four transmitting antennas for Sequence length N= 7 to 128 is obtained and compared with the literature values. From the design result, it concludes that the results obtained have great improvement in ASPs things of all the sequence lengths. In order to carry out the implementation of particle swarm optimization algorithm for the optimization of orthogonal poly phase sequences is developed for MIMO radar.
REFERENCES
[1] H. Deng, “Polyphase code design for orthogonal netted radar systems”, IEEE Transactions on Signal Processing, Vol. 52, pp. 3126-3135 (2004).
[2] E. Fishler, A. Haimovich, R. Blum, L. Cimini, D. Chizhik, and R.Valenzuela, “MIMO radar an idea whose time has come”, in Proc. of the IEEE Int. Conf. on Radar, Philadelphia (2004).
0 0.05 0.1 0.15 0.2 0.25 0.3 0.35
0 10 20 30 40 50 60 70 80 90 100 110
ASP
Length of Sequence
71
[3] C. C. Cook and M. Bernfeld, Radar Signals An Introduction to Theory and Application. Artech House, 1993.
[4] N. Levanon and E. Mozeson, Radar Signals. Wiley, 2004.
[5] E. Fishler, A. Haimovich, R. Blum, D. Chizhik, L. Cimini, and R. Valenzuela, “Mimo radar: An idea whose time has come,” in Proc. IEEE Radar Conf., pp. 71–78, 2004.
[6] F. C. Robey, S. Coutts, D. Weikle, J. C. McHarg, and K. Cuomo, “Mimo radar theory and experimental results,” in Proc. of 37th ASILOMAR 2004 Conf. on Signals, Systems and Computers, pp. 300–304, 2004.
[7] S.P.Singh and K.Subha Rao, “Discrete frequency-Coded radar signal design ,” IET Signal Process , Vol.3,No.1,pp.7-16, july,2008.
[8] S.P.Singh and K.Subha Rao, “Sixty-Phase Sequences Design with Good Autocorrelation Properties ,” IETE Journal of research , Vol.57,No.3,pp.256-262, June ,2011.
[9] N.Balaji and Kakarla Subba rao , “VLSI –based Real –time Signal Processing Solution Emplyoing Four –Phase Codes for Spread –spectrum Application,” IETE Journal of Research ,Vol.58,No.1,pp.57-64,Jan-Feb.2012.
[10] J.Pandu , Dr. N.Balaji, and Dr.C.D.Naidu “FPGA based Solution for the Identification of RADAR Pulse Sequences for Defense Applications ”, Global Journal of Researches in Engineering, Vol .14 ,No.2, pp 17-24 , February, 2014.
[11] J.Pandu , Dr. N.Balaji, and Dr.C.D.Naidu “Optimal Coded Sequence Design for Radar using Fractional Oppositional Particle Swarm Optimization”,IEEE International Conference on Recent Advances and Innovations in Engineering (ICRAIE-2014),May 09-11, 2014, Jaipur ,India .
[12] Jain Li.Petre Stoica “ MIMO Radar Signal Processing” a johan willey &sons .INC. Publication.
[13] Yuri I. Abramovich, Gordon J. Frazer, “Bounds on the Volume and Height Distributions for the MIMO Radar Ambiguity Function,” on IEEE Signal Processing Letters, Vol .15, pp .505– 508,2008.
[14] Chun-Yang Chen, P. P. Vaidyanathan, “MIMO Radar Ambiguity Properties and Optimization Using Frequency-Hopping Waveforms,” in IEEE Transactions on Signal Processing, Vol 56, No. 12, , pp. 5926- 5936, Dec.2008.
[15] T. Aittomki and V. Koivunen, (2016) “Radar Waveform Sidelobe Level Optimality and
[16] Yongzhe Li; Vorobyov, S.A.; Koivunen, V., (2015) “Ambiguity Function of the Transmit Beam space-Based MIMO Radar,” in IEEE Transactions on Signal Processing, Vol.63, No.17, pp.4445-4457, Sept. 2015.
[17] Chaudhari, S. Jantti, J., Koivunen, V., (2015) “Detection and Classification of OFDM Waveforms using Cepstral Analysis,” IEEE Transactions on Signal Processing, Vol. 63, No. 16, pp. 4282-4299,2015.
[18] Kapetanovic, D., Abrudan, T., Rusek, F., Koivunen, V., (2012) “Construction of Minimum Euclidean Distance MIMO Precoders and their Lattice Classifications.” IEEE Transactions on Signal Processing, Vol.60, No. 8, pp. 4470-4474,2012.
[19] Aittomaki, T.; Koivunen, V. (2010) “Performance of MIMO Radar With Angular Diversity Under Swerling Scattering Models.” IEEE Journal of Selected Topics in Signal Processing, Special Issue on MIMO Radar, Vol.4 , No, 1.,pp. 101 – 114,2010.
[20] Koivisto, T.; Koivunen, V., “Diversity Transmission of Synchronization Sequences in MIMO Systems,” IEEE Transactions on Wireless Communications,Vol.11, No.11, pp.4048-4057, November ,2012.
[21] Pun ,m.koivunen,V.Poor ,H.V.(2011) “ performance analysis of joint opportunistic Sceduling and Receiver design for MIMI-SDMA.” IEEE Downlink Systems Transactions on Communications ,Vol.59,No.1,pp.268-280,2011.
BIOGRAPHY
Mr. J. Pandu obtained is B.Tech degree from VNR Vignana Jyothi Institute of Technology, Bachupally, Hyderabad. He recived Master’s degree from Osmania University Hyderabad and Pursuing his (Ph.D) from JNTUH Hyderabad. Presently he is working as a Assoc professor in the Department of ECE, Sreyas Institute of Engineering &Technology, Nagole, Hyderabad. He is a life Member of ISTE . His areas of research interest are Signal Processing, Radar, and Embedded Systems.
73