University of Windsor University of Windsor
Scholarship at UWindsor
Scholarship at UWindsor
Electronic Theses and Dissertations Theses, Dissertations, and Major Papers
5-16-2018
Development and Integration of Stretchable Electronic
Development and Integration of Stretchable Electronic
Components into Light-Emitting Devices
Components into Light-Emitting Devices
Yiting Chen
University of Windsor
Follow this and additional works at: https://scholar.uwindsor.ca/etd
Recommended Citation Recommended Citation
Chen, Yiting, "Development and Integration of Stretchable Electronic Components into Light-Emitting Devices" (2018). Electronic Theses and Dissertations. 7430.
https://scholar.uwindsor.ca/etd/7430
Development of Optimal Material Extrusion Additive Manufacturing Tool Path
Parameters for Minimizing Void Regions Using Contemporary Tool Path Solutions
By
Hasti Eiliat
A Dissertation
Submitted to the Faculty of Graduate Studies
through the Industrial and Manufacturing Systems Engineering Graduate Program
in Partial Fulfillment of the Requirements for
the Degree of Doctor of Philosophy
at the University of Windsor
Windsor, Ontario, Canada
2018
Development of Optimal Material Extrusion Additive Manufacturing Tool Path
Parameters for Minimizing Void Regions Using Contemporary Tool Path Solutions
By
Hasti Eiliat
APPROVED BY:
______________________________________________
C. Duty, External Examiner
University of Tennessee
______________________________________________
R. Caron
Mathematics and Statistics
______________________________________________
M. Wang
Mechanical, Automotive and Materials Engineering
______________________________________________
G. Zhang
Mechanical, Automotive and Materials Engineering
______________________________________________
J. Urbanic, Advisor
Mechanical, Automotive and Materials Engineering
DECLARATION OF CO-AUTHORSHIP / PREVIOUS PUBLICATION
I. Co-Authorship
I hereby declare that this dissertation incorporates material that is result of joint research, as follows:
Chapter 1 of the dissertation was co-authored with Luis Fernando Villalpando and Hasti Eiliat
under the supervision of Professor Dr. Ruth Jill Urbanic. In all cases, the key ideas, primary
contributions, experimental designs, data analysis, interpretation, and writing were performed by
the author. The contribution of co-authors was primarily through the provision of relationship
between parameters of material extrusion process and strength. Luis Fernando Villalpando
contributed to the statistical analysis and graphing results; Hasti Eiliat provided feedback on
refinement of ideas and editing of the manuscript.
I am aware of the University of Windsor Senate Policy on Authorship and I certify that I have
properly acknowledged the contribution of other researchers to my dissertation, and have obtained
written permission from each of the co-author(s) to include the above material(s) in my dissertation.
I certify that, with the above qualification, this dissertation, and the research to which it refers, is
the product of my own work.
II. Previous Publication
This dissertation includes seven original papers that have been previously published/submitted for
Dissertation
Chapter Published title/full citation
Published
status
Chapter 1
Using Genetic Algorithms to Optimize the Build Orientation for Fused Deposition Molded Components Containing Internal Reinforcement Structures. Hasti Eiliat and Ruth Jill Urbanic. 2014, ASME International Mechanical Engineering Congress and Exposition, Montreal, Quebec, Canada [1].
Published
Chapter 1
Experimental Evaluation of Light-weighting Design Options for the Fused Deposition Modelling Process. Hasti Eiliat, Ruth Jill Urbanic, and Luis Fernando Villalpando. 2015, 65th Annual Conference and Expo of the Institute of Industrial Engineers, Nashville, Tennessee, USA [2].
Published
Chapter 2
An Optimization Approach for Components Built by Fused Deposition Modeling with Parametric Internal Structures. Luis Fernando Villalpando, Hasti Eiliat, and Ruth Jill Urbanic. 2014, 47th CIRP International Conference on Manufacturing Systems, Vol. 17, pp. 800 -805 [3].
Published
Chapter 3
Minimizing Voids with Using an Optimal Raster Orientation and Bead Width for a Material Extrusion Based Process. Hasti Eiliat and Ruth Jill Urbanic. 2016, ASME International Mechanical Engineering Conference and Exposition, Phoenix, Arizona, USA [4].
Published
Chapter 3
Minimizing Voids for a Material Extrusion Based Process. Hasti Eiliat and Ruth Jill Urbanic. 2018, Rapid Prototyping Journal, pp. 1-23 [5].
Published
Chapter 4
Visualizing, Analyzing, and Managing Voids in the Material Extrusion Process. Hasti Eiliat and Ruth Jill Urbanic. 2018, Advanced Manufacturing Technology Journal, pp. 1-15 [6].
Published
Chapter 5
Determining the Relationships between the Build Orientation and Voids in Additive Manufacturing Material Extrusion Processes. Hasti Eiliat and Ruth Jill Urbanic. 2018, Advanced Manufacturing Technology Journal
Submitted
I certify that I have obtained a written permission from the copyright owner(s) to include the above
III. General
I declare that, to the best of my knowledge, my dissertation does not infringe upon anyone’s
copyright nor violate any proprietary rights and that any ideas, techniques, quotations, or any other
material from the work of other people included in my dissertation, published or otherwise, are
fully acknowledged in accordance with the standard referencing practices. Furthermore, to the
extent that I have included copyrighted material that surpasses the bounds of fair dealing within the
meaning of the Canada Copyright Act, I certify that I have obtained a written permission from the
copyright owner(s) to include such material(s) in my dissertation.
I declare that this is a true copy of my dissertation, including any final revisions, as approved by
my dissertation committee and the Graduate Studies office, and that this dissertation has not been
ABSTRACT
A problem with the planning solutions for the additive manufacturing material extrusion process is
a lack of optimization strategies to improve upon the standard raster and contour toolpaths. After
experimental testing, it was recognized that a component’s strength relationship with respect to the
volume of material usage is inconsistent and that failures occurred in regions of voids. From
previous studies, it was found that a build orientation in the material extrusion process influences
the support material requirements, processing time, surface finish, voids volume, etc. This
dissertation aims to identify, minimize, and manage void regions during the toolpath generation,
and studies the effects of build orientation on the amount and location of unwanted voids in the
finished part. This includes comparing all possible build orientations to minimize voids in each
layer, preventing void regions from being stacked in 3D, and avoiding creating an internal chimney.
This approach is divided into three phases. Phase I is minimizing voids in each layer, phase II is
identifying and managing voids between layers, and the third phase is comparing the total voids in
all possible build orientations. Material extrusion processes, with a wide selection of nozzle sizes
(0.4 mm to 21 mm), are considered suitable candidates for this solution. To carry out this study, a
literature review was performed to understand the influence of the build parameters. Then, an
analysis of valid parameter settings to be targeted was performed on a commercial system. The
mathematical model is established based on the component geometry and the available build
options for a given machine-material configuration. A C++ program has been developed to select
a set of standard (available) toolpath parameters to determine the optimal output process variables
(bead width, raster angle, and the overlap percentage), managing voids between layers, and
compare total voids in all possible build orientations. Case studies are presented to show the merits
of this approach. It is found that the entire void area is significantly reduced (~7%) with the phase
DEDICATION
This dissertation is dedicated to my family and my friends, especially …
ACKNOWLEDGEMENTS
I would like to thank my advisor, Dr. Urbanic, for sharing her wisdom and expertise with me
throughout this research. Her guidance and supervision for establishing the project are appreciated.
I also would like to thank Dr. Caron for reviewing the work throughout the process and for his
suggestions on the mathematical model.
I would like to express my appreciation to my committee members, Dr. Wang and Dr. Zhang, for
their time and consideration. I am thankful to CAMufacturing Solution, Inc., specifically Bob
Hedrick for the support and patience during this initiative.
I could have never finished this task without the support and encouragements from Dr. Mary Anne
Johnston. I am thankful for her guidance and her open arms and ears. I would like to thank my best
friend, Hamed, who brings happiness and peace in my life
I thank my parents for their help and support. Also, I want to thank my angel sister, Dr. Hoda Eiliat,
for her faithful friendship and encouragement.
Lastly, I wish to thank my colleagues, friends, and everyone who shared a part of their time and
TABLE OF CONTENTS
DECLARATION OF CO-AUTHORSHIP / PREVIOUS PUBLICATION ... iii
ABSTRACT ... vi
DEDICATION ... vii
ACKNOWLEDGEMENTS ... viii
LIST OF TABLES ... xi
LIST OF FIGURES ... xiii
LIST OF APPENDICES ... xviii
LIST OF ABBREVIATIONS ... xix
NOMENCLATURE ... xxi
CHAPTER 1 INTRODUCTION ...1
Material Extrusion Process ... 1
Typical Materials ... 3
Process Planning ... 5
Classifications ... 10
Advantages and Disadvantages ... 15
Dissertation Objectives and Main Contribution ... 17
Dissertation Outline ... 25
CHAPTER 2 LITERATURE REVIEW ...27
Toolpath Parameters ... 27
Build Orientation ... 27
Bead Height ... 30
Bead Width ... 33
Percent Overlap ... 35
Toolpath on Surface Finish and Accuracy ... 42
Generating New Toolpath ... 43
CHAPTER 3 METHODOLOGY ...45
Phase I _ Optimizing Voids Area ... 45
Determining Toolpath Parameters ... 48
Determining Voids Area ... 54
Phase II _ Optimizing Voids Position ... 60
Managing Nozzle Movements ... 62
Managing Voids Position ... 69
Covering Voids ... 75
Phase III _ Optimizing Build Orientation ... 77
CHAPTER 4 EXPERIMENTS FOR PHASE I AND II ...82
Solid Shapes ... 83
Non-Solid Shapes ... 91
Combination of Solid and Non-Solid Shapes ... 96
CHAPTER 5 EXPERIMENTS FOR PHASE III ...111
CHAPTER 6 CONCLUSIONS AND FUTURE RESEARCH ...120
REFERENCES ...126
APPENDICES ...137
Appendix A ... 137
Appendix B ... 141
Appendix C ... 143
Appendix D ... 148
Appendix E ... 151
LIST OF TABLES
Table 1. Example of some build materials for the material extrusion process [18] ____________________ 4
Table 2. Characteristics of ABS and PC materials _____________________________________________ 5
Table 3. OEM software for material extrusion process [21] _____________________________________ 8
Table 4. Characteristics of different material extrusion processes ________________________________ 11
Table 5. Control and fixed parameters for Fortus 400 machine [18] ______________________________ 12
Table 6. Stratasys machine series [18] _____________________________________________________ 13
Table 7. Comparison of decision making for the FDM and RepRap machines ______________________ 14
Table 8. Comparison between injection molding and material extrusion process for Figure 11 _________ 16
Table 9. Comparison of time, build and support materials for open face up and down of Figure 19 ______ 22
Table 10.Comparison of time, build and support materials for open face up and down of Figure 20 _____ 23
Table 11. Comparison of time, build and support materials for optimal position ____________________ 23
Table 12. Results of changing the part orientation ____________________________________________ 27
Table 13. The new height of the car seat with different bead height in the OEM software _____________ 31
Table 14. Different kinds of the air gap ____________________________________________________ 36
Table 15. Literature review on toolpath parameters and strength ________________________________ 39
Table 16. The literature review of toolpath parameters and surface finish/accuracy __________________ 44
Table 17. The relationship between bead height and bead width for a Fortus 400 mc and the insight®
software ____________________________________________________________________________ 46
Table 18. An optimal combination of bead heights to produce Figure 29 __________________________ 49
Table 19. The relationship between raster angle, bead width and overlaps for Figure 43 (b and c) ______ 52
Table 20. The relationship between toolpath parameters and the edge voids area ____________________ 58
Table 21. Voids possibility matrices for some simple shapes ___________________________________ 65
Table 22. Methods for dividing concave shapes _____________________________________________ 66
Table 23. Details of points and area of voids in the first layer of Figure 58 ________________________ 70
Table 24. Details of points and area of voids in the first layer of Figure 59 ________________________ 71
Table 25. Details of points and area of voids in the first layer of Figure 60 ________________________ 72
Table 26. The formula of voids points _____________________________________________________ 73
Table 27. Category of shapes ____________________________________________________________ 82
Table 28. Target applications for this dissertation ____________________________________________ 83
Table 29. Convex and concave shape examples ______________________________________________ 84
Table 30. Convert concave shape to convex shape ___________________________________________ 84
Table 31. Parameters of the solid hexagonal shape ___________________________________________ 85
Table 32. Cover and Uncover Voids ______________________________________________________ 86
Table 35. Comparison voids for seven-side non-symmetric convex shape _________________________ 89
Table 36. Comparison voids for multiple 2D geometry extrusions examples _______________________ 90
Table 37. Comparison voids for Figure 81(a) _______________________________________________ 92
Table 38. Comparison voids for Figure 82 _________________________________________________ 94
Table 39. Comparison voids for Figure 83 _________________________________________________ 96
Table 40. Calculating an optimal bead width and overlap for section 5 in Figure 85 _________________ 97
Table 41. Comparison voids for Figure 82 _________________________________________________ 97
Table 42. Details of each layer for each solid convex shape ____________________________________ 98
Table 43. Comparison the OEM software with the first and second approaches of the new model with
overlaps limit 50% ___________________________________________________________________ 103
Table 44. Difference between the OEM software (for the seat orientation shown) and the new model with
different overlaps limit ________________________________________________________________ 107
Table 45. Comparing voids in different rotation around X and Y axes ___________________________ 110
Table 46. Comparing cases parameters when the allowable overlaps are 0% and 50% _______________ 115
Table 47. ANOVA for car seat case study _________________________________________________ 116
Table 48. Voids volume with OEM software _______________________________________________ 116
Table 49. Pros and cons of the three phases ________________________________________________ 122
LIST OF FIGURES
Figure 1. Seven categories of additive manufacturing processes: (a) Material Extrusion [9], (b) Powder Bed
Fusion [10], (c) Vat Photo Polymerization [11], (d) Binder Jetting [12], (e) Material Jetting [13], (f) Sheet
Lamination [10], and (g) Directed Energy Deposition [14] ______________________________________ 2
Figure 2. Material extrusion process [16] ____________________________________________________ 2
Figure 3. (a) A four-layer cylinder, (b) Top view of the cylinder _________________________________ 3
Figure 4. Build and support materials (*.stl file is from [17]) ____________________________________ 3
Figure 5. Process planning for the material extrusion process ____________________________________ 5
Figure 6. Relationship of resolution and number of triangles for a sphere [11] ______________________ 6
Figure 7. Closed volume model features [17] ________________________________________________ 7
Figure 8. (a) Watertight 3D model, (b) Set of triangles to convert the 3D model to a *.stl file, and (c) Slice
the part to 33 layers with bead height 0.254 mm ______________________________________________ 8
Figure 9. Two classifications for the material extrusion process _________________________________ 10
Figure 10. A strength comparison of different types of processes [26] [27] ________________________ 15
Figure 11. An example for comparison between injection molding and material extrusion process ______ 16
Figure 12. Interior light weighting strategies inspired a primitive atomic crystal structure [29] _________ 17
Figure 13. (a) Sample with strategically placed interior voids, (b) Comparison of the compressive strength
of the material used ___________________________________________________________________ 18
Figure 14. Tensile failure point with ABS and polycarbonate materials (adapted from [4]) ____________ 18
Figure 15. (a) Direction parallel toolpath, (b) Contour parallel toolpath (adapted from [4]) ____________ 18
Figure 16. Voids in the tensile specimen ___________________________________________________ 19
Figure 17. Voids and discontinuity (a) Direction parallel toolpath and voids for one layer, and (b) Contour
parallel toolpath and voids for one layer. ___________________________________________________ 19
Figure 18. Different rotation of one part ___________________________________________________ 20
Figure 19. Bottom vent cover geometry and time and material build estimates _____________________ 21
Figure 20. Cover vent cover geometry and time and material build estimates _______________________ 22
Figure 21. Different rotation and position of voids ___________________________________________ 24
Figure 22. Problem statement in the process planning of material extrusion process _________________ 25
Figure 23. The comparison of (a) The build and support materials (cm3), (b) Number of layers and (c) Build
times (min) for the 0°, 45° and 90° rotations about the X-axis __________________________________ 28
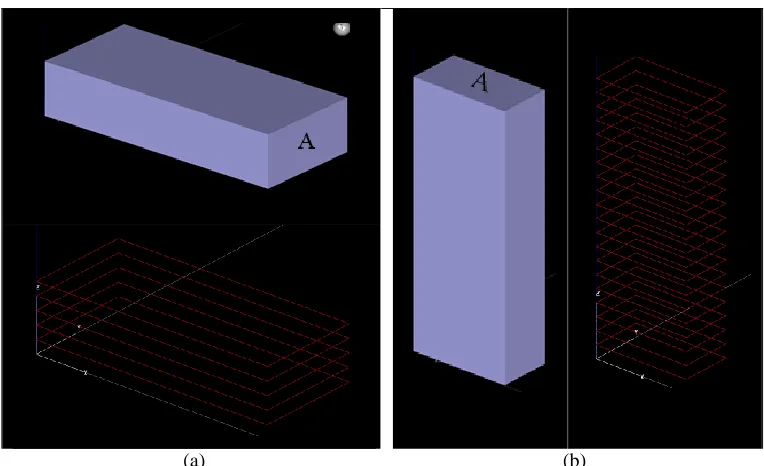
Figure 24. (a), (b) Part orientation influences the tensile strength of the sample (b) being weaker than
sample (a) in the longitudinal direction ____________________________________________________ 28
Figure 25. The relationship between part orientation and compressive strength on surface “A” _________ 29
Figure 26. The relationship between build orientation and voids (a) 90o around the X-axis, and (b) 30o
Figure 28. Compare the final height of part (a) and the height of the finished part after using available bead
heights in Figure 27 (b to e) _____________________________________________________________ 30
Figure 29. Car seat example with height, 150.0086 mm _______________________________________ 31
Figure 30. One part with different bead heights (a) 0.254 mm and (b) 0.127 mm ____________________ 32
Figure 31. The relationship between bead height and voids in the first layers, (a) bead height 0.1270 mm (b)
bead height 0.3302 mm ________________________________________________________________ 32
Figure 32. The relationship between feeding rate/ linear speed and bead width _____________________ 33
Figure 33. Top view of one layer with bead width (a) 0.4016 mm and (b) 0.8314 mm ________________ 33
Figure 34. Comparison of voids between two different bead width sizes, (a) 3D model, (b) layer with
0.4064mm bead width, and (c) 0.8314 mm bead width ________________________________________ 34
Figure 35. The relationship between the bead width with time and surface finish (the sample parts are from
[41]) _______________________________________________________________________________ 35
Figure 36. Zero air gaps, bead width, and bead height _________________________________________ 36
Figure 37. One part with or without overlaps with two different bead width sizes ___________________ 37
Figure 38. Compare three toolpath with raster angle (a) 00, (b) 450, and (c) 300 _____________________ 38
Figure 39.Three phases for minimizing total voids in the material extrusion processes _______________ 45
Figure 40. Phase I process flow diagram ___________________________________________________ 47
Figure 41. (a) Slicing the part to four layers with bead height Sj, (b) Points and lines in a layer _________ 47
Figure 42. Compare the final height and number of layers with bead heights from Figure 27 __________ 49 Figure 43. The relationship between raster angle and the bounding rectangle, (a) r=00 and (b) r=1350 ___ 50
Figure 44. Wr Of one layer when the raster angle is, (a) 0o and (b) 45o____________________________ 51
Figure 45. (a) Optimal bead with and (b) Optimal overlaps per raster angle from 00 to 1790 for one layer of
Figure 43(a) _________________________________________________________________________ 53
Figure 46. Three categories of voids – (a) corner, (b) edge, and (c) contour center ___________________ 54 Figure 47. The relationship between corner void with (a) gl=500, (b) gl=1000, and (c) gl=1600 with two
bead width sizes: (left) 20 mm and (right) 40 mm ____________________________________________ 55 Figure 48. (a) Exact screenshot of a layer in the real OEM software, (b) Sorting Ψt for this layer _______ 56
Figure 49. The relationship between raster angle and voids area for an optimized bead width with (a) 400
raster angle without overlaps, (b) 550 raster angle without overlaps, (c) 400 raster angle with a 15% overlap
condition. ___________________________________________________________________________ 57
Figure 50. Steps of Phase I ______________________________________________________________ 60
Figure 51. Phase II diagram added to phase I diagram _________________________________________ 61
Figure 52. Nozzle movements, (a) Shape of a layer, (b) Contour toolpath, (c) Position of rasters, (d) Stop
and start points, (e) Nozzle path, and (f) Complete nozzle movements ____________________________ 63
Figure 56. (a) 3D view, (b and c) First Layer (4 regions)and second Layer (5 regions) before connecting
start points of some regions, (d) after connecting 0% overlaps, (e) 50% overlaps ____________________ 68
Figure 57. (a) Layer with triangle shape example, (b) Relationship of raster angle and voids, (c) relationship
of bead width, overlap, and raster angle ____________________________________________________ 69
Figure 58. Void regions for the layer with 00 raster angles _____________________________________ 70
Figure 59. Void regions for the layer with 300 raster angles ____________________________________ 71
Figure 60. Void regions for the layer with 1200 raster angles ___________________________________ 72
Figure 61. Combination voids for the three layers, respectively and the black circles show the voids which
are not covered by these three layers ______________________________________________________ 72
Figure 62. Position of voids _____________________________________________________________ 73
Figure 63. The position of voids with points’ illustration ______________________________________ 74
Figure 64. (a) 3D view, (b) Logic of tracking voids between layers ______________________________ 75
Figure 65. Example for phase II, 22 layers for a specific build orientation of a box __________________ 76
Figure 66. Difference between voids when the start point of the nozzle is on the (a) left side or (b) right side
___________________________________________________________________________________ 76
Figure 67. (a) The voids of the layer that need to be covered by next layer, (b) adding one more contour _ 77
Figure 68. Color code of Figure 39, Phase I (blue), phase II (green), and phase III (orange) ___________ 77
Figure 69. Rotation around X and Y axes __________________________________________________ 79
Figure 70. 3D example of rotation around X and Y axes _______________________________________ 80
Figure 71. The position of voids of different rotations around X and Y axes _______________________ 81
Figure 72. The position of voids around a dice ______________________________________________ 81
Figure 73. (a) Insight® software toolpath, (b) Voids in part after processing _______________________ 85
Figure 74. Three optimal layers for the Table 31 _____________________________________________ 86
Figure 75. (a to c) Optimal layers for the hexagonal shape, (d) finished part after processing __________ 87
Figure 76. Infinite-side shape with twelve layers _____________________________________________ 88
Figure 77. Seven-side non-symmetric convex shape __________________________________________ 88
Figure 78. Compare first (a) and second (b) layers in the existing OEM software ___________________ 88
Figure 79. Covering voids between seven layers _____________________________________________ 90
Figure 80. Multiple 2D extruded shapes with their blueprints (mm) (adapted from [4]) ______________ 91
Figure 81. (a) 3D example of the shape with internal holes (b) Blueprint (mm), (c) Optimal splitting
(adapted from [4]) ____________________________________________________________________ 92
Figure 82. (a) Complex shapes with holes and its blueprint, (b) dividing complex shapes, and (c)
connection rasters between the divided shapes ______________________________________________ 93
Figure 83. Examples of shapes with internal holes ___________________________________________ 94
Figure 84. Optimal splitting of Figure 83 ___________________________________________________ 95
Figure 85. Divided the complex shape to seventeen solid convex shapes __________________________ 96
Figure 87. Cluster/grouping bead width for Figure 85 _________________________________________ 99
Figure 88. Cluster/grouping raster angle for Figure 85 _______________________________________ 100
Figure 89. Cluster/grouping overlap for Figure 85 ___________________________________________ 100
Figure 90. Car seat example, (a) 3D model, 00 with X and Y axes, and (b) Slice it during Z-axis ______ 101
Figure 91. (a) The first layer, (b) The second layer, (c) The third layer, and (d) Relationship between raster
angle and voids area for layers 1, 2, and 3, with the 45°/-45° solution highlighted __________________ 102
Figure 92. Actual percentage overlap bins _________________________________________________ 103
Figure 93. Multiple layers of the car seat example ___________________________________________ 104
Figure 94. The relationship between Raster Angle and Voids Area for Layers 1st, 6th, and 8th _________ 105
Figure 95. The sensitivity of the new model with its constraints, the relationship between layers and (a)
overlaps, (b) bead width, (c) voids area by changing maximum allowable overlaps _________________ 106
Figure 96. Different voids area in the first layer with part rotation with Z-axis (a) 900, (b) 600, and (c) 1500
in the OEM software – note the standard raster angle is relative to the machine ‘world coordinates’ ____ 108
Figure 97. 3D view, support materials and the first layer when Figure 90, (a) 600 rotates around X-axis, (b)
600 rotates around Y-axis, and (c) 600 rotates around X and Y axes _____________________________ 109
Figure 98. Comparing voids, processing time, number of layers, and support materials in different rotation
around X and Y axes _________________________________________________________________ 110
Figure 99. Three case studies with 0o rotations around X and Y axes(a) Toy car seat, (b) Valve cover I, and
(c) Valve cover II ____________________________________________________________________ 111
Figure 100. The rotation which has the minimum voids for each part ____________________________ 112
Figure 101. Bead width and overlaps per layer for (a) Car seat and (b) Valve cover I and II __________ 113
Figure 102. Comparison of time and support material between two optimal orientations _____________ 113
Figure 103. Optimal rotation to minimize voids with overlap percent set to 0% ____________________ 114
Figure 104. a) Voids per rotations and (b) Comparing voids in the small range of rotations ___________ 117
Figure 105. The frequency of voids with the new model for the car seat case with 50% allowable overlaps
__________________________________________________________________________________ 118
Figure 106. The frequency of voids with the new model for the valve cover II study with 50% allowable
overlaps ___________________________________________________________________________ 118
Figure 107. The worst rotation for car seat case study ________________________________________ 119
Figure 108. Algorithm for minimizing and managing voids ___________________________________ 121
Figure 109. Complex 3D parts __________________________________________________________ 123
Figure 110. Toolpath with connection rasters (a) and no continuity between rasters (b) ______________ 123
Figure 111. Unwanted overlaps of start and stop points between layers __________________________ 124
Figure 112. (a) 3D geometry and cross-section of the specimen with three overlapped beads. (b) Average
Figure 114. Voids volume (mm3) per rotation around X and Y axes for a Car seat with allowable overlaps
(a) 50% and (b) 0% __________________________________________________________________ 148
Figure 115. Voids volume (mm3) per rotation around X and Y axes for Valve cover I with allowable
overlaps (a) 50% and (b) 0% ___________________________________________________________ 149
Figure 116. Voids volume (mm3) per rotation around X and Y axes for Valve cover II with allowable
overlaps (a) 50% and (b) 0% ___________________________________________________________ 150
Figure 117. (a) 3D model, (b) Voids in the OEM software toolpath, (c) Expectation of the new model
toolpath ____________________________________________________________________________ 152
Figure 118. (a) 3D model of tensile strength sample, (b) the view of 3D model from Z and X axis, and (c)
Layers of the sample _________________________________________________________________ 153
LIST OF APPENDICES
Appendix A: Published/submitted papers—Acceptance/Permission Letter ____ 137
Appendix B: Additive Manufacturing Categories ________________________ 141
Appendix C: Voids Possibility Matrix _________________________________ 143
Appendix D: Total Voids per Build Rotation 148
Appendix E: Mathematical Model Steps 151
LIST OF ABBREVIATIONS
3DP™ 3D Printing
3SP™ Scan, Spin, and Selectively Photo cure
ABS Acrylonitrile Butadiene Styrene
AM Additive Manufacturing
AM-ME Additive Manufacturing Material Extrusion
ASTM American Society for Testing and Materials
BAAM Big Area Additive Manufacturing
CAD Computer Aided Design
CLIP™ Continuous Liquid Interface Production
CNC Computer Numerical Control
DED Directed Energy Deposition
DLP™ Digital Light Processing
DMD™ Direct Metal Deposition (DM3D)
DMLS™ Direct Metal Laser Sintering
EBM™ Electron Beam Melting
FDM™ Fused Deposition Modeling
FFF Fused Filament Fabrication
LENS™ Laser Engineered Net Shaping
LMD Laser Metal Deposition
LOM Laminated Object Manufacture
LSAM Large Scale Additive Manufacturing
MAAM Medium Area Additive Manufacturing
MJF™ Multi-Jet Fusion
MJM Multi-Jet Modeling
OEM Original Equipment Manufacturer
SAAM Small Area Additive Manufacturing
SCP™ Smooth Curvatures Printing
SDL Selective Deposition Lamination
SHS™ Selective Heat Sintering
SLA™ Stereolithography Apparatus
SLM™ Selective Laser Melting
SLS™ Selective Laser Sintering
NOMENCLATURE
𝐵𝑙𝑟 Binary voids possibility in edge 𝑙 with raster angle 𝑟.
𝑒̂𝑙 Angle between the edge 𝑙 and X axis.
𝜀 Tolerance of the part height (mm).
𝑓 ∈ 𝐹 New convex shapes after dividing a concave shape.
𝔤̂𝑙 Angle of corner 𝑙.
𝐻 Height of the part (mm).
𝑖 ∈ 𝐼 Bead width.
𝑗 ∈ 𝐽 Bead height.
𝑙 ∈ 𝐿 Integer number of corners for layer 𝑞.
𝑀𝑞𝑓 Voids possibility matrix of profile 𝑓 in layer 𝑞.
𝑚 Total number of raster angles which are studied for layer 𝑞.
𝑁𝑗 Integer number layers with bead height 𝑗.
𝑛 Total number of edges in layer 𝑞.
𝑂𝑖 Percentage of overlap with bead width 𝑤𝑖𝑗.
𝑂∗ Maximum allowable percentage of overlap.
𝑞𝜖𝑄 Integer number of layers.
𝑟 Raster angle.
𝑅𝑖 Integer number of rasters with bead width 𝑤𝑖𝑗.
𝑠𝑙+1𝑙 Slope of the edge between corner 𝑙 and 𝑙 + 1.
𝑇(𝑁𝑗) Number of total layers.
𝑣𝑞𝑐 Area of corner voids for layer 𝑞 (mm2).
𝑣𝑞𝐸 Area of edge voids for layer 𝑞 (mm2).
𝑤𝑖𝑗 Bead width 𝑖 for bead height 𝑗 (mm).
𝑊𝑟 Length between lowest and highest Y-axis (mm).
Ψ𝑡 Distance between Y-axis of two continuous corners (mm).
(𝑥𝑟𝑙,𝑦𝑟𝑙) Point of corner 𝑙 in the layer 𝑞 with raster angle 𝑟.
𝑌𝑙+1𝑙 , 𝑋
𝑙+1𝑙 Formula of the edge between corner 𝑙 and 𝑙 + 1.
𝑦𝑟𝑚𝑎𝑥 Maximum Y-axis in the bounding rectangle (mm).
𝑦𝑟𝑚𝑖𝑛 Minimum Y-axis in the bounding rectangle (mm).
(𝒳(𝜃𝑥,𝜃𝑦), 𝒴(𝜃𝑥,𝜃𝑦), 𝒵(𝜃𝑥,𝜃𝑦)) Point of *.stl file with 𝜃
CHAPTER 1
INTRODUCTION
The material extrusion process is one of several additive manufacturing (or 3D printing) procedures
employed to fabricate a component or assembly without using special tools, fixtures, or human
intervention. The material extrusion process is used in various industries like automotive,
aerospace, education, and medical, etc. The most previous researchers have focused on the build
orientation targeted reducing support material requirements, optimizing surface finish, etc.
However, research needs to be performed to develop methodologies while considering the fill
conditions concerning an optimal build orientation. The goal of this dissertation is identifying,
minimizing, and managing void regions during the toolpath generation and studies the effects of
build orientation and the amount of unwanted voids in the finished part. This chapter will explain
how the toolpath leaves voids and why it impacts the strength and performance of a finished
product. This chapter summarizes the background of the material extrusion process and describes
machines, materials, classifications, advantages, and disadvantages of the material extrusion
process. In the end, the problem statement, motivation, and dissertation outline are explained,
individually.
Material Extrusion Process
S. Scott Crump is the inventor of Fused Deposition Modeling (FDMTM) and co-founder of Stratasys,
Ltd in 1989 [7]. In late 1980s Additive Manufacturing Material Extrusion (AM-ME) processes
were identified as a part of rapid prototyping or fixtureless manufacturing. The AM-ME process is
the one of Additive Manufacturing (AM) process. The AM process is the process of building
products by layering a material directly from a Computer Aided Design (CAD) model in a
structured manner to fabricate a component or assembly. In 2010, the American Society for Testing
and Materials (ASTM) group formulated a set of standards that classify the range of AM processes
into seven categories [8], Figure 1 (a to g) shows these processes.
As it shows in the figure, each of these processes uses specific materials and descriptions. This
dissertation focuses on material extrusion process (AM-ME) which Figure 1(a) shows and
(a) (b) (c) (d)
(e) (f) (g)
Figure 1. Seven categories of additive manufacturing processes: (a) Material Extrusion [9], (b) Powder Bed
Fusion [10], (c) Vat Photo Polymerization [11], (d) Binder Jetting [12], (e) Material Jetting [13], (f) Sheet
Lamination [10], and (g) Directed Energy Deposition [14]
As Figure 2 shows, the AM-ME process is a layering technology where each layer is built from
extruded beads of material – typically a thermoplastic. In the AM-ME process, the material is
extruded through a nozzle, where it is heated and then deposited in beads placed side by side. The
component or assembly is built incrementally, layer by layer. The nozzle can move along the X
and Y axes horizontally, and a platform (or deposition head) moves up or down vertically after
each new layer is deposited [15].
Figure 2. Material extrusion process [16]
deposition as the material is in a melted state. Figure 3 (b) shows a top view of the last layer which
is layer 4. The top view shows how the nozzle had moved during the process, and how the toolpath
creates voids. This process is independent of material in AM-ME. The next section explains types
of material in AM-ME and names some of them in industry.
(a) 3D View (b) Top View
Figure 3. (a) A four-layer cylinder, (b) Top view of the cylinder
Typical Materials
There are two types of material in the AM-ME process which are the build material and support
material. As it shows, for producing Figure 4 (a), the build material, red part of Figure 4 (b), and
the support material, gray part of Figure 4 (c), are used during the process. In the end, the support
material is needed to remove from Figure 4 (c) to get Figure 4 (a).
(a) 3D Model (b) Build Material (c) Build and Support Material
Figure 4. Build and support materials (*.stl file is from [17])
Table 1 shows the categories for some of the thermoplastic materials that are used in industry as
the build material. The build material is divided into four groups; standard thermoplastics,
engineering thermoplastics, high-performance thermoplastics, and sacrificial tooling material
thermoplastics [18]. Table 1 describes the features and product examples for each kind of materials.
Layer 4
Layer 3 Layer 2
Table 1. Example of some build materials for the material extrusion process [18]
Build Material Feature Product Example
S ta n d a rd Th er m o p la stic s
ABS-ESD7 Static dissipation
ABS plus In 9 colors and has option for custom colors
ABSi Translucence
ABS-M30 In six colors for high tensile, impact and flexural strength
ABS-M30i Biocompatibility
ASA In 10 colors for high mechanical strength, UV stability, and the best aesthetics En g in ee rin g Th er m o p la stic s
FDM Nylon 6 Ductile engineering plastic
FDM Nylon 12 Maximum toughness
PC Superior mechanical properties and heat resistance
PC-ABS The highest impact strength, plus the mechanical properties and heat resistance of PC and the surface appeal of ABS
PC-ISO Biocompatibility and superior strength
H ig h -Per fo rm a n ce Th er m o p la stics
PPSF/PPSU Highest heat and chemical resistance
ULTEM 1010 The highest heat resistance, chemical resistance and tensile strength of any FDM thermoplastic
ULTEM 9085 Best mix of mechanical, chemical and thermal properties
cia l T o o lin g te ria l
In this dissertation, Acrylonitrile Butadiene Styrene (ABS-M30) and Polycarbonate (PC) are used
as the build materials, which are in the standard thermoplastics and engineering thermoplastics
groups, respectively. Table 2 compares the characteristic of these two materials.
Table 2. Characteristics of ABS and PC materials
Characteristic ABS PC
Heat Deflection 96 0C 138 0C
Support Material Dissolving Breakaway
Price per m3 [19] ~ $27,500 ~ $50.000
The support material in the AM-ME process is Acrylonitrile Butadiene Styrene (ABS),
Polycarbonate (PC), PPSF, ULTEM 1010, ULTEM 9085, or ST130. In this dissertation, ABS and
PC are used as the support materials. The removal process for these two materials are dissolving
and breakaway, respectively (Table 2).
Process Planning
The process planning of AM-ME is same for all materials. The AM-ME process is separated into
six steps. The steps are categorized into three main groups; pre-processing, processing, and
post-processing (Figure 5).
Software, slicing, parameter, machine steps are in the pre-processing group. Below, these steps are
explained deeply.
Software Step: The process planning is started by a 3D model which is developed by CAD software.
The CAD software can be Autodesk Inventor, Catia, IronCAD, McNeel Rhino, ProEngineering,
Solid Edge, SolidWorks, and UGS NX. SolidWorks is used as the CAD software in this
dissertation. The CAD model needs to be a watertight or closed volume model (Figure 8 (a)). The
reason is the closed volume 3D model can convert to a *.stl file. A *.stl file uses triangular facets
to represent a shape, where each facet is defined regarding the coordinates of its three vertices [20].
The number of triangles is related to the size and resolution of the surface. As it shows in Figure 6
by increasing numbers of the triangles, the resolution of the sphere is improved.
Figure 6. Relationship of resolution and number of triangles for a sphere [11]
The *.stl file is readable by the Original Equipment Manufacturer (OEM) software, i.e., Insight®
or Catalyst® software. Thus, the 3D model needs to be comprised a set of triangles that are
connected by their common edges or corners to be ready for the AM-ME machine. It means the 3D
model needs to be a closed volume model. The features of the closed volume model are listed below
(a) Every triangle edge has exactly two neighbors. It implies that there are no holes or
non-manifold edges. (Figure 7 (a)).
(b) Every node in the triangle is connected to only one "fan" of triangles around it. That is, for
a given node, every triangle that shares that node must be accessible from any other triangle
that shares the same node by moving across triangle edges (Figure 7 (b)).
(a) (b)
(c) (d)
Figure 7. Closed volume model features [17]
Slicing Step: The OEM software is a type of control machine software to develop a build file form
the *.stl file. Table 3 gives some examples of OEM software in the market. This dissertation uses
Insight® software as an OEM software. This table describes the functions for each software. The
slicer function for the OEM software, such as the Cura software, prepares the selected model and
generates the G-code for a machine. The 3D printer host function allows users to control and
monitor all activities from the web browser and handheld machines. The 3D design and CAD
function enable users to change the 3D model before sending the model to machines. The STL
checker, STL repair, and STL editor functions let users check, repair, and edit a *.stl file during
Table 3. OEM software for material extrusion process [21]
Software Function
Cura Slicer, 3D Printer Host CraftWare Slicer, 3D Printer Host Insight Slicer, 3D Printer Host Catalyst Slicer, 3D Printer Host 123D Catch 3D Design, CAD 3D Slash 3D Design, CAD TinkerCAD 3D Design, CAD 3DTin 3D Design, CAD Sculptris 3D Design, CAD ViewSTL STL viewer
Netfabb Basic Slicer, STL Checker, STL Repair Repetier Slicer, 3D Printer Host
FreeCAD 3D Design, CAD Sketch Up 3D Design, CAD
3D-Tool Free Viewer STL Viewer, STL Checker Meshfix STL Checker, STL Repair Simplify3D Slicer, 3D Printer Host
Slic3r Slicer
Blender 3D Design, CAD Mesh Lab STL Editor, STL Repair
Meshmixer STL Checker, STL Repair, STL Editor OctoPrint 3D Printer Host
Figure 8 (b) shows the *.stl file of the 3D model (Figure 8 (a)) with a set of triangles. These triangles
help the OEM software to slice the 3D model to different layers like Figure 8 (c). The next step in
the AM-ME process is choosing process parameters.
Parameter Step: The commercial OEM software employed to develop a process plan typically
requires the user to input a material type, a fill strategy, and a slice height. The component position,
orientation, and scale can also be altered. Depending on the software solution, the bead width may
be changed from a default value, and tool path editing can be performed. The process parameter
configuration for a material-bead geometry is highly coupled (i.e., changing the travel speed will
change the bead height and width), but this is opaque to the user. Some software solutions have
pre-set process parameter settings; other software tools require the user to establish the heating
conditions, travel speed, material feed rate, and so forth. These software tools may help users to
select parameters to improve the features of a finished part such as the surface quality, minimizing
the support material, or choosing an orientation to fit the component in the build envelope.
Machine Step: This step is sending the build file (proprietary or open source format) to the machine.
The build file contains information to tell the machine to move to the various points (X, Y and, Z)
at the desired speed (toolpath). G-Code is a control language for AM-ME machine typically used
for open source machines. The next section explains these type of machines. This step is the last
step of the pre-processing group.
Toolpath Step: This step is AM-ME process, it starts with feeding the plastic filament through a
heated nozzle where the material is melted and deposited onto a build platform. As layers are
deposited onto the platform, each layer deposits on top of the other until the part is completed.
Post Processing Step: After finishing producing the part, post-processing needs to be done such as
smoothing a rough surface finish, polishing, cleaning a part, or removing support material, etc.
As Figure 9 shows, there are two types of classifications based on process planning of AM-ME.
These two classifications are classification based on nozzle size and classification based on the
Figure 9. Two classifications for the material extrusion process
Classifications
In the market, there are different types of AM-ME process. This section will be described the two
strategies for categorizing the AM-ME process. One is classified based on nozzle sizes, and the
other one is based on process machines.
(a) Classification of Material Extrusion Based on Nozzle Size
The AM-ME process family includes systems with a wide variety of nozzle and available bead
sizes, such as the Large Scale Additive Manufacturing (LSAM), Big Area Additive Manufacturing
(BAAM), Medium Area Additive Manufacturing (MAAM), Small Area Additive Manufacturing
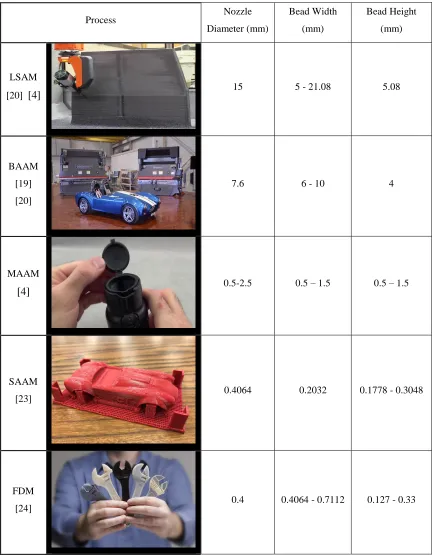
(SAAM), and Fused Deposition Modeling (FDM). Table 4 presents a partial set of different
achievable bead sizes for these AM-ME processes. This classification proves that the AM-ME are
used for a wide variety of applications in the schools, automotive, aerospace, and medical domains
with different sizes and qualities for both prototype and functional components. Consequently,
there are extreme variants with the surface finish, build time, and the final component size for these
AM-ME. The FDM and other small bead systems are ideal for components that fit within a 0.2 to
1 mm build envelop, as the bead widths vary from 0.13 to 1 mm. BAAM and LSAM processes are
additive machines that produce beads with a 6 to 21 mm bead width and a 4 to 5 mm bead height.
These systems are designed to allow AM-ME to be utilized for large scale (physical dimensions)
production manufacturing, such as a car body. The size and speed of these systems enable large
Table 4. Characteristics of different material extrusion processes
Process Nozzle
Diameter (mm)
Bead Width
(mm)
Bead Height
(mm)
LSAM
[20] [4] 15 5 - 21.08 5.08
BAAM
[19]
[20]
7.6 6 - 10 4
MAAM
[4] 0.5-2.5 0.5 – 1.5 0.5 – 1.5
SAAM
[23] 0.4064 0.2032 0.1778 - 0.3048
FDM
(b) Classification of Material Extrusion Based on Source Machines
Closed (proprietary formats, limited process planning control) and open source machines are two
kinds of machines for the AM-ME. These machines are described partially, below.
Closed Source Machine: Stratasys in Eden Prairie, Minnesota developed a closed source machine
or the Fused Deposition Modelling (FDM) [18]. FDM machines have two semi-melted
thermoplastics; the build material and support material. Both materials are extruded through two
separate nozzles that trace the part cross sectional geometry layer by layer. The semi-melted
thermoplastic hardens immediately after flowing from the nozzles and bonds to the layer below.
Once a layer is built, the platform lowers, and the extrusion nozzles deposit another layer, it will
shift 90° between each layer to maximize the strength between layers. Once the processing is
completed for a layer, the Z-axis increments the appropriate amount, and the process is repeated.
Then all support material needs to be removed after finishing the process. Most of the decision
making parameters for the FDM process is determined automatically, which makes the process
inflexible. The OEM software for this kind of machines automatically slice and generates the
toolpath. This dissertation uses the Fortus 400 as a closed source machine. The maximum build
size for the machine is 406 x 356 x 406 mm and parts are produced within an accuracy of +/- 0.127
mm. This machine is flexible to build complex 3D components. Table 5 shows the control and
fixed parameters for the Fortus 400 machine.
Table 5. Control and fixed parameters for Fortus 400 machine [18]
Control Parameters Fixed Parameters
Bead width (mm) 0.4064 to 0.7112. Maximum Part Dimensions (cm) 35.56 deep, 40.64 wide, 40.64 tall XY Dimensional
Tolerance (mm) ± 0.0015 or ± 0.127
Minimum “safe” wall thickness
(mm) 3.175
Slip fit for shaft 0.254 larger than the shaft Minimum wall thickness (mm) 0.9144 Press fit for the shaft
(mm) 0.127 larger than the shaft
Minimum clearance between
surfaces (mm) 0.1778
Air gap (mm)
(-0.0254) – (+2,54) Can safely be increased to 250% of the default
Minimum “safe” clearance
between surfaces (mm) 0.3302 Part Orientation 0°- 90° Model build temperature 367° F Bead Height / Slice
FDM is created in 1989 by Scott Crump. It was one of the first commercially viable rapid
prototyping technologies, now a part of Stratasys Inc. [18]. Table 6 shows different Stratasys
machine series in the market.
Table 6. Stratasys machine series [18]
Machine O E M So ft wa re Build Envelope Size Layer
Thicknesses Achievable Accuracy
F o rt us 3 8 0 mc In sig h
t 355 x 305 x
305 mm
0.330 mm
0.254 mm
0.178 mm
0.127 mm
± .127 mm or
± .0015 mm/mm
F o rt us 4 5 0 mc In sig h
t 406 x 355 x
406 mm
0.330 mm
0.254 mm
0.178 mm
0.127 mm
± .127 mm or
± .0015 mm/mm
F o rt us 9 0 0 mc In sig h
t 914.4 x 609.6 x
914.4 mm
0.508 mm
0.330 mm
0.254 mm
0.178 mm
+/- .089 mm or
+/- .0015 mm/ mm
Co nn e3 Sy st ems Ob jet Stu d
io 340 × 340 ×
200 mm
0.01524 mm
20-85 micron for features
below 50 mm; up to 200
microns for full model size
O bje ct 1 0 0 0 plu s Ob jet Stu d
io 1000 x 800 x
500 mm
0.01524 mm
Up to 85 microns for
features smaller than
50mm; Up to 600 microns
for full model size
Str a ta sy s J 7 5 0 Po ly jet Stu d
io 490 x 390 x
200 mm
14 microns
(0.00055 in)
20-85 microns for features
below 50 mm; up to 200
Open Source Machine: An open source machine, such as the RepRap, work the same as a printer,
but rather than ink, it puts down thin layers of material. The RepRap machine requires all
decision-making parameters such as the travel speed, material feed rate, melting temperature or power
requirements to be identified manually. The tool paths also need to be generated using appropriate
software tools. Thus, working with a RepRap system, users need more knowledge of CNC
machines and the control software. Determining the calibration configuration for a material-bead
geometry set may take time because of the coupled relationships between the different variables.
Table 7 summarizes the difference between these two source machines. As the OEM software for
the FDM process will automatically slice the STL file and generate the tool paths for both the build
and support materials, is easier to use than the RepRap machine. In the RepRap machines, all
parameters for the slicing, and generating a toolpath for the build and support materials need to be
manually coded by the users. In below table, the multiple choice for closed source machine means
advanced editing required to adjust the parameters.
Table 7. Comparison of decision making for the FDM and RepRap machines
Close Source Machine Open Source Machine
Type of Material Multiple choices Controlled by User
Type of Support Material Multiple choices Controlled by User
Slice Height Multiple choices Controlled by User
Bead Width Multiple choices Controlled by User
Air Gap Multiple choices Controlled by User
Raster Orientation Multiple choice Controlled by User
Part Orientation Controlled by User Controlled by User
Toolpath Fixed Controlled by User
Bed Size Fixed Fixed
Extrusion Temperature Fixed Controlled by User
Nozzle Diameter Fixed Fixed
Material Feed rate Fixed Controlled by User
Travel Speed Fixed Controlled by User
As same as other manufacturing processes, the AM-ME method has advantages and disadvantages.
Advantages and Disadvantages
The AM-ME process is becoming more common [22] [23] [24] as this process uses reduced
materials and energy to fabricate a component or assembly, and can be used to produce light,
optimized products with minimal production operations [25]. However, the reasons why the
AM-ME is becoming one of the essential manufacturing processes are
This process uses less material, reusing material and producing lighter products with
eliminating production steps in the other manufacturing processes.
Products are built layer by layer instead of machining part from stock.
Products can be fabricated as soon as the CAD model has been created.
This process enables fabrication of designs with complex geometries that would be
impossible to achieve using other procedures [25].
It provides the ability to design products with more complex parts instead of many simpler
parts [25].
It enables rapid response to markets and creates new production options outside of factories.
However, same as other processes there are disadvantages. These disadvantages of the AM-ME
process are
The inherent problem with the AM-ME process is that the final fabricated product is
weaker when compared AM-ME built component to other traditional manufacturing
processes when using the same materials. It is due to the limited bonding between the layers,
and between the side-to-side beads. Figure 10 shows a process comparison for strength
between different manufacturing processes. It shows that the AM-ME process, compared
to injection molding and plastic forming, is weaker.
Figure 10. A strength comparison of different types of processes [26] [27]
The average speed of producing is around one to five cubic per inches per hour.
The building time, high-quality machines and price of material are higher than other
material is 19.58 cm3. The bead height, bead width, and raster angle for this process are
0.254 mm, 0.6096 mm, and 450, respectively.
Diff
e
rent Vi
ew
Figure 11. An example for comparison between injection molding and material extrusion process
Table 8 compares the total time process and cost of materials of the CNC machining
process and AM-ME process for this product. The time and cost of the AM-ME process
are seven times and three times more than the CNC machining process, respectively.
Table 8. Comparison between injection molding and material extrusion process for Figure 11
Process Time of Process (min) Cost of Total Material
CNC Machining 150 ~ $3
Material Extrusion 1010 ~ $17
This process needs extensive knowledge of CAD design.
The process has component size and materials options limitation.
Layering and multiple interfaces cause defects in the product such taller and shorter product
due to the slice height, discontinuities or voids.
Parts are built one at a time. Thus it is preventing economies of scale.
Not having variety toolpath for processing as compared to Computer Numerical Controlled
(CNC) machining toolpath [2] [28].
Dissertation Objectives and Main Contribution
As it was explained before, one conventional material employed in the AM-ME process is ABS
plastic. As the ABS, thermoplastic material costs are high compared to the other material (Table
8), preliminary research focused on balancing mechanical strength and material usage using a
parametric interior light weighting strategy [29]. After testing some tensile and compression
samples with strategically placed interior voids (Figure 12), unexpected repeatable results occurred,
which are explained below.
Figure 12. Interior light weighting strategies inspired a primitive atomic crystal structure [29]
In selected cases ((Figure 13 (a)), the compressive strength is weak for the volume material used
(encircled value in Figure 13 (b)). Thus, unexpectedly, the build strength had an inverse relationship
concerning the volume material usage in this case. For some components that exhibited this failure,
the estimated volume of the build material to be utilized was approximately 12% less than the
theoretical volume of the element but was in-line with other samples with similar material volumes.
When performing compressive tests for specimens with differently designed interior pockets, the
observed compressive forces varied between 19 and 30.5 kN for specimens with 52 cm3 (3.17 inch3)
of material [4]. The experimental deviations between three test specimens for each compressive
(a) (b)
Figure 13. (a) Sample with strategically placed interior voids, (b) Comparison of the compressive strength
of the material used
The other unexpected result is illustrated with the tensile test. The failure points are not in the center
for several (most) cases. The cases are experiments with diverse internal raster fill angle
orientations [20]. Figure 14 shows tensile specimens with different materials.
ABS Polycarbonate
Figure 14. Tensile failure point with ABS and polycarbonate materials (adapted from [4])
The reason for these unusual tensile and compressive test results is due to the presence of
unexpected voids created by the tool path deposition pattern. The toolpath in the AM-ME process
is the trajectory of the nozzle or print head during the manufacturing process to fill the interior of
each layer [30]. There are two kinds of toolpaths typically employed for the AM-ME process. The
first one is a direction parallel toolpath for the interior area of the layer. The raster fill angle or the
fill direction varies 90° between layers [31] and the second one is a contour parallel toolpath for
the boundary of the layer [32]. Figure 15 shows these two toolpaths, respectively.
As Figure 16 shows, there are unwanted voids (which are the regions not covered with the material
during the build process) between the contour tool path and the raster fill tool path for a tensile
sample. In this figure, the raster angle, raster, contour, and bead width are shown, respectively.
Figure 16. Voids in the tensile specimen
An additional issue is related to the start and stop points in the tool path. These introduce
discontinuities, which reduces the strength, and typically occur near to the unwanted void regions
(Figure 17 (a)). Having voids, discontinuities, and 3D voids that are interconnected through
multiple layers (chimneys) will introduce internal failure points for a product. Therefore, this
dissertation aims to identify voids region in a toolpath to minimize them in each layer, and to
manage available build solutions to avoid creating an internal chimney condition. Figure 17 (a and
b) illustrates two toolpath types, direction parallel, and contour parallel toolpath, respectively. The
figure shows unwanted voids with both toolpaths, but the number, sizes, and locations vary. If this
information can be captured, then these resultant voids can be reduced, or managed (i.e.,
repositioned).
(a) (b)
Figure 17. Voids and discontinuity (a) Direction parallel toolpath and voids for one layer, and (b) Contour
parallel toolpath and voids for one layer.
The other issue is the component orientation in the build envelope influences the positions and
cross-sectional areas to be filled, along with the void regions within a component, will be different. Figure
18 shows the three different rotations for one part around the X and Y axes.
The figure shows the number of layers, the area of each layer, the volume of support materials, etc.
are different between these build orientations. The bead height, bead width and raster angle for this
example are 0.254 mm, 0.5064 mm, and 45o.
# of Layers 47 41 80
Support Material
(cm3) 0.926 1.558 0.203
Build Material
(cm3) 1.929 2.317 1.475
Average Volume
per Layer 0.041 0.057 0.018
Time (min) 13 18 9
(a) (b) (c)
Figure 18. Different rotation of one part
The next example shows the relationship between the build orientation and total materials. For
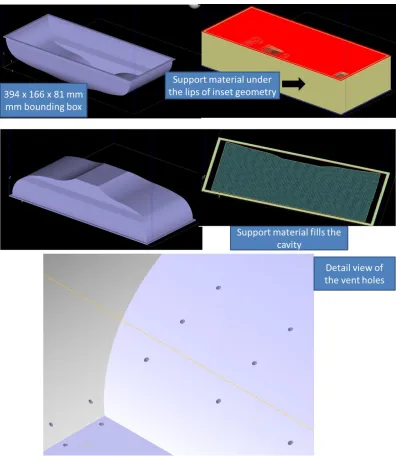
example, the thin covers, with vent holes, are utilized to illustrate the positive and negative
characteristics of the AM-ME processes. The cover in Figure 19 has a large surface volume, and
wall thicknesses that vary between 1.2 - 2.0 mm. The vent holes or slots have a 0.4 mm radius. The
Figure 19. Bottom vent cover geometry and time and material build estimates
The build times are long for any build orientation, and there is support material required for
overhanging structures (Table 9). The critical decisive characteristic for the AM-ME process family
is that complex components such as this part can be readily manufactured using an AM-ME
machine for a moderately low cost and reduced material waste compared to a machining solution;
however, support material (here approximately 380 – 1010 cm3) may be required. Consequently,
support structure optimization has been designed to minimize support material requirements, and
Table 9. Comparison of time, build and support materials for open face up and down of Figure 19
0.178 mm slice thickness, 2:1 ratio bead thickness: bead height
Open face UP Open face DOWN
Solid, Basic Supports
Solid Build & Sparse Support Material
Solid, Basic Supports
Solid Build & Sparse Support Material
Time 39hr 9 m 32 hrs. 3 m 58 hrs. 44 m 34 hrs. 59 m Build
(cm3) 189.0 188.9 228.2 208.3
Support
(cm3) 646.8 384.4 1013.1 403.7
Total
material 835.8 573.3 1241.3 612.0
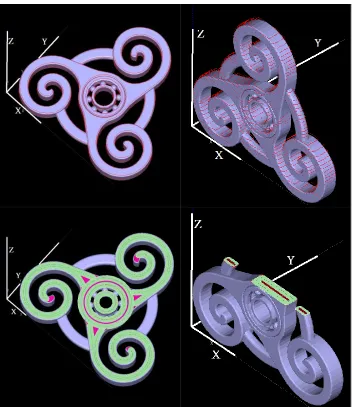
A complementary venting cover (Figure 20 and Table 10) has an optimal build orientation, as there
is one build orientation that minimizes support material and the total build time (Table 11).
Figure 20. Cover vent cover geometry and time and material build estimates
Table 10 compares the time, build material, and support material for two positions shown in Figure
![Figure 7. Closed volume model features [17]](https://thumb-us.123doks.com/thumbv2/123dok_us/1350809.1167958/30.612.135.511.71.329/figure-closed-volume-model-features.webp)
![Table 3. OEM software for material extrusion process [21]](https://thumb-us.123doks.com/thumbv2/123dok_us/1350809.1167958/31.612.191.457.97.378/table-oem-software-material-extrusion-process.webp)
![Table 5. Control and fixed parameters for Fortus 400 machine [18]](https://thumb-us.123doks.com/thumbv2/123dok_us/1350809.1167958/35.612.108.540.466.696/table-control-fixed-parameters-fortus-machine.webp)
![Figure 12. Interior light weighting strategies inspired a primitive atomic crystal structure [29]](https://thumb-us.123doks.com/thumbv2/123dok_us/1350809.1167958/40.612.143.488.215.423/figure-interior-weighting-strategies-inspired-primitive-crystal-structure.webp)