Development and validation of HPLC method for the estimation of Escitalopram oxalate in tablets.
6
0
0
Full text
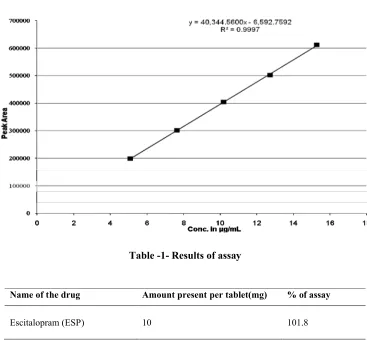
(2) 2 N.Ramathilagam et al / Int. J. of Pharmacy and Analytical Research Vol-2(1) 2013 [1-6]. MATERIALS USED Escitalopram was kindly supplied by Unichem Lab. Ltd. Mumbai, India. CITA S-10 was taken for study, which contains Escitalopram-10mg. Methanol (Merck Ltd., Mumbai, India) and HPLC grade acetonitrile (Molychem, mumbai), methanol, ammonium acetate, glacial acetic acid (Finar chemicals, ahmedabad and HPLC grade water.. Preparation of mobile phase Acetonitrile: Methanol: 5mM Ammonium acetate buffer pH (3.0) in the ratio of 30: 20:50 were mixed, sonicated for 10 minutes and filtered through the membrane filter of micron 0.45µ.. Preparation of standard solution 10 mg of escitalopram were dissolved in methanol by sonication and makeup to 10 mL. 1 mL and 10 mL respectively. The worked final concentrations were prepared 10µg/mL respectively.. Preparation of sample solution A quantity of tablet powder equivalent to 10 mg (103.6 mg) was accurately weighed and transferred to 100 mL volumetric flask, dissolved in few mL of methanol, sonicated for 15 mints and made up to the volume by mobile phase acetonitrile: methanol: 5mM ammonium acetate buffer pH (3.0)in the ratio of 30: 20:50. This will give the concentration of 10 µg of escitalopram per millilitre solution of tablet sample.. METHOD DEVELOPMENT Selection of wavelength Stock solutions of 10mg/ml were prepared for escitalopram drug in methanol and further diluted to get the concentration of 10µg/mL for escitalopram was prepared with methanol. The wavelength was selected by scanning the above standard drugs between 200 to 400 nm. The scanned results showed that reasonably maximum absorbance for escitolapram and was recorded at 238 nm. Therefore, 238 nm was selected as the detection wavelength for the HPLC investigation. [Figure1].. Method The samples were applied Kromosil (250x4.6)mm 5µ column with Rhedyne injector in reverse saturation mode using acetonitrile: methanol: 5mM ammonium acetate buffer pH (3.0)in the ratio of 30: 20:50 as mobile phase with flow rate of 1.0 mL/min. The sample was performed using UV/VIS. JASCO UV-1570 detector with flow rate 1ml/min. The instrument computes accurate results within minimal time. The retention time was obtained 5.36 for escitolapram respectively. The result of assay was reported in the table-1and figure-2.. VALIDATION OF THE METHOD Accuracy Accuracy was determined by tablet samples with different known concentrations of the drug (50%, 100% and 150%). Each concentration was injected in triplicate and the assay was performed as per the test method. From this % recovery and the amount present or recovered were calculated. Results of recovery study are reported in table-2.. Precision Standard stock solutions of escitalopram were prepared in the same manner for the standard preparation and prepared the mixed standard solution. This solution containing 10µg/mL of escitalopram. The repeatability was performed for three times. Results of precision are reported in table-3.. Linearity Linearity was determined in the range of 50-150 % (50, 75, 100, 125 and 150%) targeted concentration of assay procedure. five series of standard solutions containing 5.09,7.64,10.18,12.73 and 15.27 µg/mL of escitalopram were injected. Linearity of each drug was observed and response ratio of each drug was found out linearity of each drug is reported in table-4 and graph1.. Ruggedness The above sample prepared solution and diluted to get the concentration of 10 µg of escitalopram per millilitre of tablet sample. From this 20 µL was injected through column separately by two different analysts in the same HPLC system and same column. The result was reported in a table -5.. Robustness The above prepared standard mixture was determined by the variation of flow rate and variation of wavelength. The result was reported in a table -6.. RESULT AND DISCUSSION The present study was aimed to develop an accurate precise and linear HPLC method for analysis of escitalopram (ESP) and in. www.ijpar.com.
(3) 3 N.Ramathilagam et al / Int. J. of Pharmacy and Analytical Research Vol-2(1) 2013 [1-6]. pharmaceutical dosage forms as per ICH guidelines. Escitalopram dosage form showed the linearity response over range 5.09-15.27 µg/mL. The correlation coefficient for three drugs was found to be 0.9997. The recovery studies of these three drugs were found to be 101.86 (ESP). The. precision % RSD was found to be 0.68 for (ESP) respectively. The raggedness and robustness were studied with replicates standard solution of these drugs, and the result was found to be acceptance criteria.. Fig-1- Overlain UV spectra of standard. Fig-2- Assay chromatogram of ESP. www.ijpar.com.
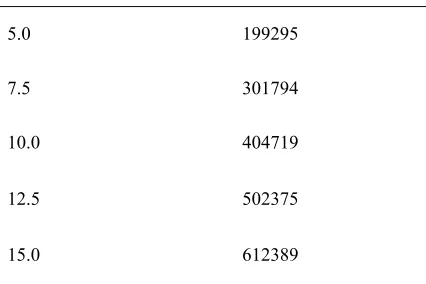
(4) 4 N.Ramathilagam et al / Int. J. of Pharmacy and Analytical Research Vol-2(1) 2013 [1-6]. Graph -1- Linearity chart of standard escitalopram. Table -1- Results of assay. Name of the drug. Amount present per tablet(mg). % of assay. Escitalopram (ESP). 10. 101.8. Table -2- Results of recovery studies Name of the drug Escitalopram (ESP). Amount taken (mg) 5 10 15. Amount found (mg) 5.07 10.18 15.09. % recovery 100.73 101.86 100.95. Table -3- Results of precision study. Injection No. 1. 2. 3. 4. 5. 6. Avg SD %RSD. Retention time. Peak area. 5.350 5.342 5.342 5.333 5.342 5.350 5.3432 0.0063 0.12. 400836.000 402876.563 406464.000 403422.750 407893.500 406821.250 404719.0105 2745.7042 0.68. www.ijpar.com. % of mean recovery 100.50 100.65 101.08.
(5) 5 N.Ramathilagam et al / Int. J. of Pharmacy and Analytical Research Vol-2(1) 2013 [1-6]. Table 4- Results of linearity studies of standard escitalopram Concentration in µg/mL Standard peak area 5.0. 199295. 7.5. 301794. 10.0. 404719. 12.5. 502375. 15.0. 612389. Table-5-Ruggedness data of analyst – I and II Analyst. Mean of peak area %RSD. Recovery Quantity. % Recovery. Analyst-I Analyst-II. 403392 404399. 10.18 10.34. 101.86 103.41. 0.71 0.81. Table -6- Robustness study. Parameters Retention Time Peak area. Variations Flow rate at 0.8ml\min 6.7 507187. Flow rate at 1.2ml\min 4.4 328262. Wavelength at 236 nm 5.3 377228. Wavelength at 240 nm 5.3 399867. CONCLUSION The proposed method gives good resolution of escitalopram within short analysis time (7minutes). The validation parameters are validated, and the results are complied with in the ICH guidelines. The method is very simple, specific, accurate, rapid. and precise for the simultaneous determination of escitalopram dosage form. Therefore, the method can be used for routine quality control analysis of these drugs.. REFERENCES [1] CIMS October-January (2011-2012)Tolterodine, page no: 166. [2] United States Pharmacopoeia - National Formulary, (24th) Asian Edition. USA: The United States Pharmacopoeia Convention Inc; (2000). p. 1428-1435. [3] Vetrichelvan.T., Arul.K., Sumithra.M., Umadevi.B. 2010. Colorimetric method for the estimation of escitalopram oxalate in tablet dosage form. Indian Journal of Pharmaceutical Sciences. 72(2): 269-271. [4] Kakde, R. B. and Satone, D. D. 2009. Spectrophotometric Method for Simultaneous Estimation of Escitalopram Oxalate and Clonazepam in Tablet Dosage Form. Indian J Pharm Sci. 71(6): 702–705. [5] Sonu Sundd Singh, Hiten Shah, Sapna Gupta, Manish Jain, Kuldeep Sharma, Purav Thakkar and Ruchy Shah. (2004). Liquid chromatography-electrospray ionisation mass spectrometry method for the determination of escitalopram in human plasma and its application in bioequivalence study. Journal of Chromatography B. 811(2): 209-215. [6] Santosh Vilashchand Gandhi, Nilesh Dnyandev Dhavale, Vijay Yeshawantrao Jadhav, Shweta Sadanand Sabnis. (2008). Spectrophotometric and Reversed-Phase High-Performance Liquid Chromatographic www.ijpar.com.
(6) 6 N.Ramathilagam et al / Int. J. of Pharmacy and Analytical Research Vol-2(1) 2013 [1-6]. Methods for Simultaneous Determination of Escitalopram Oxalate and Clonazepam in Combined Tablet Dosage Form. Journal of AOAC International. 91(1): 33-38. [7] Bhanu Raman, Brajesh A. Sharma, Pradeep D. Ghugare, Sanjay Nandavadekar, Dharmendra Singh, Pravin K. Karmuse. (2010). Structural elucidation of process-related impurities in escitalopram by LC/ESI-MS and NMR. Journal of Pharmaceutical and Biomedical Analysis. 53(4): 895-901. [8] Snil R. Dhaneshwar, Mahadik, Mahadeo V. Kulkarni, Mahesh J.(2009). Column Liquid ChromatographyUltraviolet and Column Liquid Cromatography/Mass Spectrometry Evaluation of Stress Degradation Behavior of escitalopram oxalate. Jounal of AOAC International. 92(1): 138-147. [9] Christine Greiner, Christoph Hiemke, Wolfgang Bader and Ekkehard Haen. (2007). Determination of citalopram and escitalopram together with their active main metabolites desmethyl(es-)citalopram in human serum by column-switching high performance liquid chromatography (HPLC) and spectrophotometric detection. Journal of Chromatography B. 848(2): 391-394. [10] Ravindra Kumar, Y., Ramulu, G., Vevakanand, V.V., Gopal Vaidyanathan, Keesari srinivas, Kishore Kumar, M., Mukkanti, K., Satyanarayana Reddy, M., [11] Beibei Zhang, Zunjian Zhang , Yuan Tian and Fengguo Xu. (2005). High performance liquid chromatography-electrospray ionization mass spectrometric determination of tolterodine tartrate in human plasma. Journal of Chromatography B 824(1-2): 92-98. [12] Validation of Compedial Assay- Guidelines’ Pharmacopieal Convention, Rockville, MD, 1985. [13] ICH guidelines for validation of analytical procedures: text and methodology, 1995, p.p1-15. [14] USP 25-NF 20 (United States Pharmacopieal convention, Rockville, MD, 2002), p.p- 2256 [15] FDA, ‘Analytical Procedures and Methods Validation: Chemistry, Manufacturing, Controls’, Federal Register (Notices) 65 (1690, 52, 776, -52,777 (August 2000). [16] International Conference on Harmonization; Draft Guidance on Specifications: Test Procedures and Acceptance Criteria for New Drug Substance and Products: Chemical Substance, Federal Register (notices) 65, (251), 83041-83063 (2000). [17] Asian Guideline for Validation of Analytical Procedure Adopted from ICH guideline, Q2A27 Oct. 1994 and ICH Q2B, 6th Nov. 1994. [18] Guideline for Industry Text on Validation of Analytical Procedures, ICH Q2A, 1985, p.no.1-7. [19] Guidance for Industry Q2B Validation of Analytical Procedures: Methodology. 1996., P. no. 1-10. *******************************. www.ijpar.com.
(7)
Figure
Related documents
2D: 2 dimensional; 3D: 3 dimensional; AI: Artificial intelligence; AUC: Area under the receiver operating characteristic curve; CADx: Computer aided diagnosis; CM-CNN: CMs based
Three years after the implementation of Climate Resilient Green Economy initiative, the “Country Environmental Analysis (CSA)” indicates that the country’s
CAM journals had no pharmaceutical ads, and they published signifi- cantly more original science articles about DS; however, they were not significantly less likely to publish
The results obtained are presented in the form of counter maps and profiles of radial elongation, mechanical stresses on blade surface for the rotor blade of axial flow
15 International Research Journal of Commerce and Law http://ijmr.net.in, Email: [email protected] From the table it is clear that financial benefits are considered as more
Both natural frequency and static deformation of compressor mounting plate are strongly dependant on the considered parameters which are number of support points
Abdalla’s and Reyzin’s scheme [AR00] is based on modifying Ong-Schnorr signatures [OS90], and shortens the secret and public keys of the Fiat-Shamir-based scheme of [BM99] (at
Seasonal variation in the proportion of time spent feeding by individual Indri.. Seasonal variation in activity synchrony between adults in Group P and Group
